Let me tell you something important – which won’t be a surprise to regular followers of this blog: weather station data doesn’t do the trick for ecologists. It is just too different from the climate as experienced by most organisms, and relates to it in non-linear ways.
Yet, and that is the most important part, we made a huge step forward to solve that mismatch! We published the concept of our SoilTemp-database just now in Global Change Biology, introducing our ambitious plan to the scientific community and calling on all who want to listen to submit their microclimate data to our growing database (yes, that’s you as well! Do you have microclimate measurements? Then get in touch! More on our website).
And growing it does!
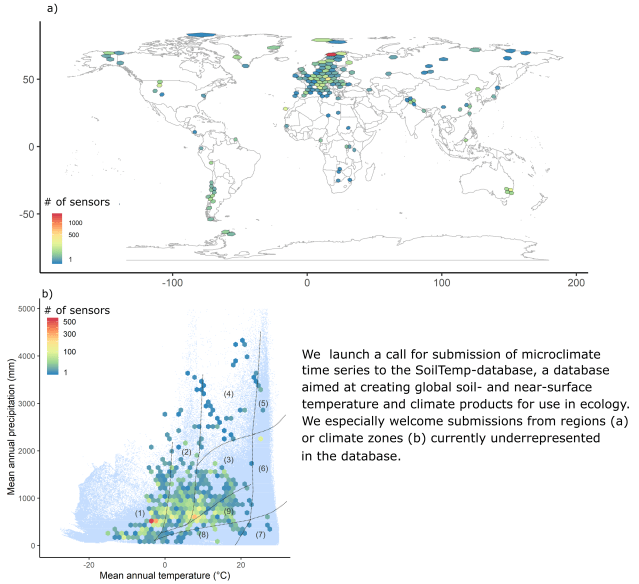
Overview figure of the database at the moment of paper acceptance (as it keeps growing!): a) shows the geographical spread of the 7538 (!) loggers from 51 (!!) countries we already have processed, while b) gives the spread in the worlds’ climatic space (the blue smear in the background indicates all types of combinations of temperature and precipitation that exist in the world, and we are covering quite a bunch of them).
The paper also explains why it is that this microclimate is so different from the macroclimate as interpolated from weather stations. In short, there is two things that together constitute that offset between micro- and macroclimate: horizontal and vertical features.
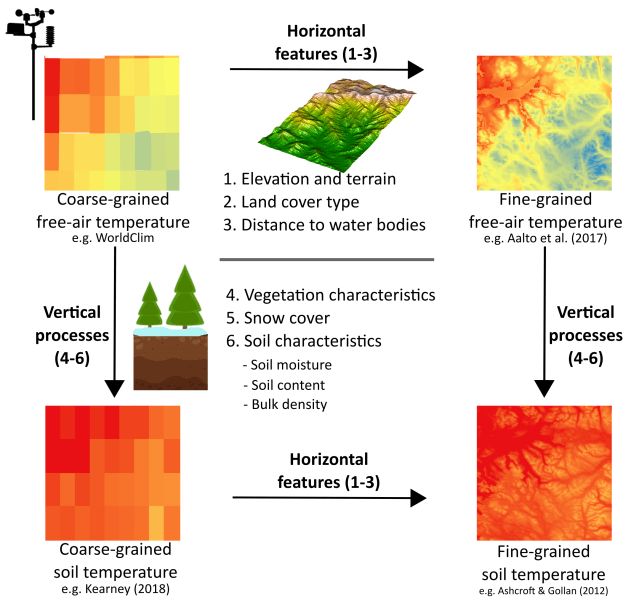
The difference between coarse-grained free-air temperature and fine-grained soil temperature is driven by horizontal andvertical features.
The horizontal features relate to the spatial resolution of the climatic data. They include features at a specific site (like effects of slope and aspect on local radiation balances, with south-facing slopes much warmer than their north-facing counterparts), and those where temperatures are also affected by neighboring locations (like topographic shading, cold-air drainage and atmospheric temperature inversions, which are landscape context dependent).
With horizontal features we capture the temperature differences between the left and right side of this picture, where local temperatures are driven by a difference in solar radiation input on a cold winter morning
The vertical features are what drives the difference between air and soil temperature and include the effects of vegetation characteristics (e.g. structure and cover), snow cover and soil characteristics (like moisture content, geological types, and soil texture). They cause an instantaneous temperature offset between air and soil temperatures, but also a buffering effect, i.e. the temporal variability in temperature changes is lower in the soil than in the air.
Vertical features involve those explaining why temperatures close to the soil are so different from those at the height of weather stations
It is the role of these two types of features that we hope to disentangle using our global database initiative. If we succeed, we will finally have the correct global climate data at hand to tackle the biodiversity and ecosystem crisis we are facing. And succeeding we will, just look at the fantastic list of co-authors on this first paper, showing the enthusiasm from all over the world for this question.
We’ll keep working frantically now, bringing together even more people from all over the world (our author list of the ‘real deal’ papers will hopefully be even longer!), and working towards tackling these questions. You bet you will hear more from us soon!
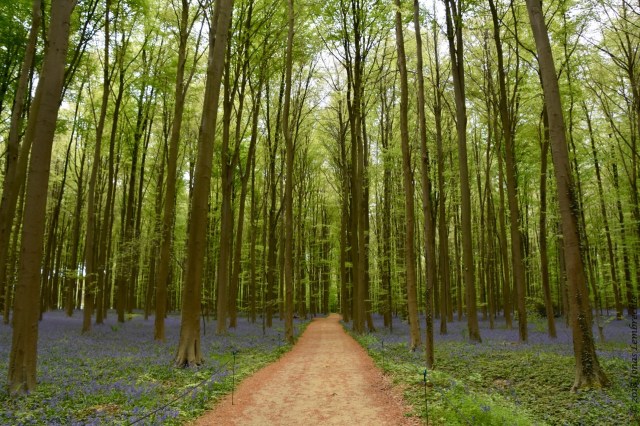
This would normally be the season where we take the students to the beautiful Hallerbos, close to Brussels, to teach them all about forest types and keystone plant species. This trip would importantly also involve stunning purple fields of bluebells all the way to the horizons.
None of that this year, though.
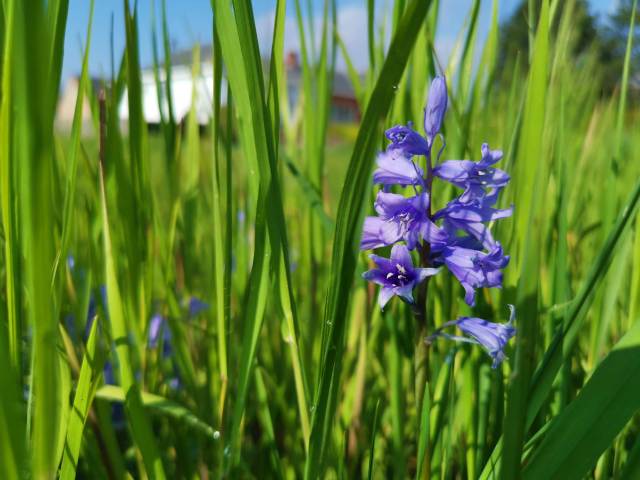
Bluebells popping up in an abandoned meadow close to my home
So this year, I’ll have to do with those few scattered bluebells popping up in the woods and fields close to my home, and the pictures and memories from last year’s course. The students – even worse – will have to do with a theoretical course on forest types.
Acer pseudoplatanus, the sycamore maple
For those finding that notion of missed nature opportunities a tad sad, I’m happy to take you back on a trip down memory line with some pictures of this amazing forest.
For more pictures, check out all ‘bluebell’-related posts on here!
For us scientists, it is tempting to throw our expertise into the fight against COVID-19. For spatial ecologists, this often means: predicting the risk of spread of the virus based on species distribution models, trying to identify its climatic niche – and thus where it is likely to show up as the season develops. After all, we have heaps of papers proving the validity of our modelling approaches for a whole range of species (and many diseases do indeed have a biogeography). This has already resulted in a myriad of preprints linking the spread of COVID-19 to climate, as summarized here.
Unfortunately, our ecological modelling techniques might not be sufficient in this case, for a variety of reasons. Many of these reasons are neatly summarized in the fantastic work from Chipperfield et al. , including the facts that 1) the distribution data for the virus is uncertain at best and highly biased at worst, due to undertesting, and 2) that the virus is far from its (climatic) equilibrium. These models might thus not only be unhelpful, but also perhaps counter-productive (think about the hopes that warm spring weather will easily get rid of the virus).
There is one problem with these models that I would like to stress a bit more, based on my own experiences as a microclimate ecologists: the climate we have at hand to model the distribution of the virus is just plain wrong. The coronavirus does not have much of a link with longterm averages in free-air temperatures measured by weather stations, and will thus not behave accordingly. We have been hammering on this nail for years now for a variety of organisms, like tundra plants (Lembrechts et al. 2019) and soil microbes (Lembrechts et al. 2020).
The problems might be even more acute for a virus than for these organisms, and they boil down to this: the spatiotemporal scale at which the organism operates, is so different from the climate data we have at hand, that there are likely several degrees of mismatch between the climate we use to model, and the climate as experienced by the organism.
It will likely not help to switch from long-term averages to current weather data, although that does take away the error caused by the fact that spring might have been much warmer this year than the average in many parts of the northern hemisphere. It will also not suffice to take into account urban heat island effects, even though the virus is spreading fastest in cities – which are indeed warmer than the average climate predicted by weather stations. The main issue lies in the fact that the coronavirus spends so little of its ‘lifetime’ in free-air: a lot of its time is spend either in human bodies, or indoors (where most of the transmissions take place) and on objects (gloves and mond masks, to name a few). None of these ‘habitats’ has temperatures only remotely near to what a weather station would give. Only for free-air transmission, this might be the case.
And this is an important note: humans are actively trying to make microclimates in their habitats – the indoor world – as comparable as possible across the whole world. We are warming our houses there where it’s cold, and cooling them where climate is warming. The effective result is a globally homogenised climate that is much more similar between human habitats across the globe than between these habitats and the weather stations closed to them.
So let that be a take-home message: modelling and predicting the climatic niche of any organism is tremenduously tricky, as long as we do not have the actual climate it experiences. This means that for so many organisms, we are far from ready to accurately predict their future distributions. And the coronavirus is just one example.
Remember my post from early 2019, where I put my R-skills to good use for society? The idea was to visualise the number of kittens in our local animal shelter throughout the season to get an idea of when the peaks could be expected.
This has turned out to be a crucial excercise for the animal shelters and the foster families taking care of the kittens: they used it to await patiently the peak to come in spring, to ensure they stocked enough kitten milk and other amenities for when the peak would be there, and prepared them for the second peak, right when after summer everything seems to cool down.
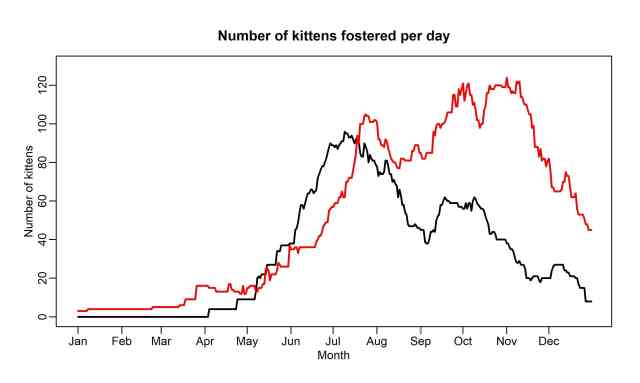
Number of kittens throughout the season in 2018 (black line) and 2019 (red line)
Yet one year of data is only that much. If we truly want to predict accurately how kitten numbers will evolve throughout the season, we’ll need to build a long-term monitoring scheme. As you can see in the graph, indeed, there were some surprises in 2019s’ red line: the peak came quite a bit later, with the mass of the kittens being dropped at the shelter only mid July, instead of mid June as in 2018.
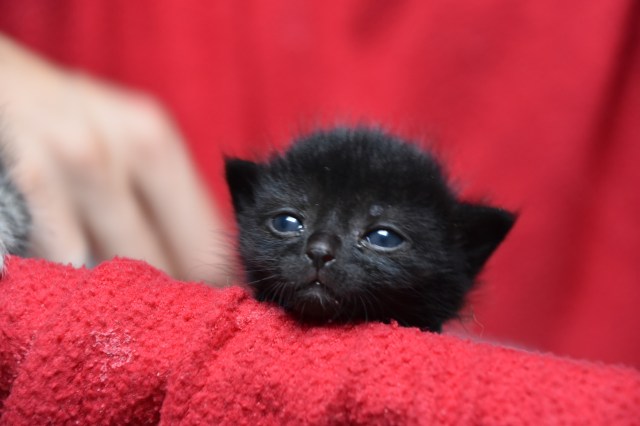
Please love me!
Moreover – and that caused special burden on the animal shelter – the second (and third!) peak in autumn far exceeded those of 2018, with both in October and November more than 120 kittens at the same time sheltered in foster families.
We will keep monitoring what comes in and goes out this year, to add a third time series to our graph. The ultimate goal would be to come up with a predictive model of those peaks in the season. I have high hopes, for example, that warm weather in springtime will be a decent predictor of the number of kittens coming in two to three months later.
But we should all know the dangers of correlative predictive modelling by now, especially for topics where we lack the expertise. Finding patterns is easy, deciphering the mechanisms behind them often needs four years of dedicated study. So, for now I’ll stick to my descriptive curves, and some broad generalisations.
But that limited expertise can tell you one more thing: with the ongoing social distancing, the peak in kittens will be severily delayed this year (as very few people will either find or save abandoned kittens), yet will hit us twice as hard after summer (when all abandoned kittens of the spring time will profit from the warm autumn weather to make new nests themselves).
Guest post by Sara Vicca (UA, dept. Biologie), Ann Crabbé (UA, dept. Sociologie) and Steven Van Passel (UA, FBE). This blog appeared earlier in Dutch on www.globalchangeecology.blog and in English on www.scientists4climate.be.Translated by Jonas Lembrechts with DeepL.
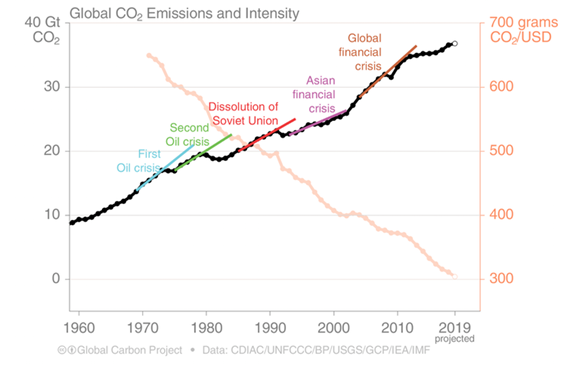
Is the coronavirus good news for the climate? It’s a recurring question these days. Not incomprehensible, because the impact of the measures on our emissions is clearly noticeable. Car traffic and energy consumption are decreasing and in the meantime it has been calculated that CO2 emissions in China decreased by a quarter in February. But these decreases are limited in time. In China, emissions are already rising and history teaches us that a decrease in CO2 emissions due to a crisis is usually short-lived. Emissions also fell during the oil crisis in the 1970s and during the banking crisis in 2008-2009, but after the crisis emissions rose again each time to break new emission records.
Figure 1: The course of global CO2 emissions over time (black line) and the CO2 intensity of the economy (orange line). During major crises, emissions fell slightly each time, but increased again after the crisis.
Will it be the same this time, too? Will CO2 emissions rise rapidly again after the corona crisis until the end of the year up till the level from before the crisis? Let’s hope not. Governments and all those who (rightly) take measures to re-launch the economy after the crisis, hopefully opt for measures that contribute to a ‘sustainable’ relaunch of the economy. This crisis may be an opportunity to take further steps on the transition path that some people have chosen very deliberately before.
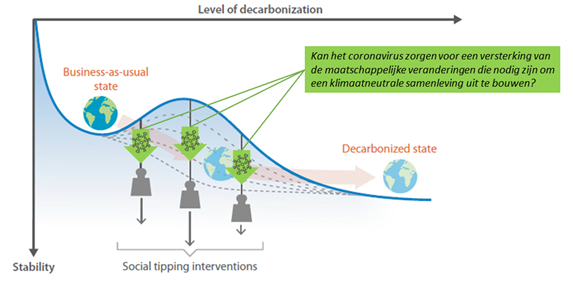
Which aspects are most important here? What should we, as a society, do to turn the corona crisis into a turning point in greenhouse gas emissions? A recent study on social tipping dynamicsoffers more insight into this. In February of this year, a group of scientists (including some big names such as Johan Rockström and Hans Joachim Schellnhuber) published a study in which they discuss so-called social tipping interventions (STIs).[1] These are social and technological changes that, through a snowball effect, can greatly accelerate the necessary social transition to a climate-neutral society. These social tipping interventions concern the following social aspects: (1) energy production and storage, (2) residential and living environment, (3) financial markets, (4) standards and values, (5) education, and (6) information. Below we briefly summarise what the study indicated and discuss some possibilities in the light of climate action in the (post-)corona era.
Figure 2: Social tipping interventions (TPIs) are actions that can create a snowball effect and thus greatly accelerate the transition to a climate-neutral society. The social changes caused by the coronavirus can also play a role here, by thwarting or strengthening TPIs.
Energy production and storage
The energy transition takes a central stand in tackling the issue of climate change: fossil fuels must be used in such a way that be replaced by renewable energy sources as soon as possible. The most important factor influencing the switch to fossil-free energy production is the financial return of the sustainable alternatives. The experts indicate that the tipping point here is likely to be reached when fossil fuel energy production becomes more expensive than the alternatives. Data shows that we are on the verge of reaching this critical threshold; renewable energy prices have fallen sharply in recent years and in many regions renewable energy has already become thecheapest energy source.
However, significant investments are still needed to adapt the existing electricity system to renewable sources such as wind and solar. An important action point of STI put forward here is the reorientation of fossil fuel subsidies towards subsidies for a decentralised energy system with the necessary energy storage and a better matching of supply and demand (smart grid).
Our homes and buildings account for about 20% of global CO2 emissions through direct and indirect emissions and reducing these emissions is a significant challenge for the transition to a climate-neutral society. An example of an STI here is setting up large-scale demonstration projects such as carbon neutral cities. Such projects are important as a source of information and inspiration for the general public, and as a stimulus for the development of sustainable building materials and technologies.
One of the plans in the Green Deal for Europe is a so-called renovation wave, which will aim for 3% renovation per year (instead of the current 1%). This will require technological, organisational, social and financial innovation . In addition to climate and health benefits, the renovation wave can also offer many opportunities for economic growth and job creation. At the moment, however, it is still unclear to what extent the corona crisis will lead to delayed implementation of the European Green Deal, or rather a flywheel effect: the economic recovery measures can also go hand in hand with the implementation of the Green Deal and mutually reinforce each other.
Financial markets
The 2008-2009 financial and economic crisis showed how quickly an event in one sector (the banking sector) can destabilize society and bring about changes in individual investment and consumption behaviour as well as in policy actions. In order to limit global warming to well below 2°C (as agreed in Paris), 33% of oil, 49% of gas and 82% of coal reserves should not be burned. This suggests a risk of a so-called carbon bubble or carbon soap bubble, which means that investments in fossil fuels will be insufficient if we comply with the Paris Climate Agreement.
A growing number of analysts believe that such a financial carbon bubble is emerging and that it could burst if a critical group of investors see it and act upon it. Simulations show that only 9% of investors can already topple the system. Other investors would then quickly follow. An example of an STI that could play an important role here is the divestment movement, where money is desinvested from fossil fuels, and instead invested in sustainable projects: “divest from what harms, invest in what helps”. A snowball effect could be caused when banks and insurers would warn about this carbon bubble. These concerns are already growing in Europe, and according to the study, the reduction in financial support for coal projects could indicate that a tipping point is near.
The corona crisis also shows how an event can disrupt the financial markets. On 12 March 2020, the Brussels stock market index Bel20 experienced its biggest fall ever (-14.21%), since the start of the index in 1991. Investors are uncertain about the economic impact of the coronavirus. Arrangements have been drawn up for deferring payment of loans for both companies and private individuals, in addition to, among other things, guarantee schemes, annoyance premiums and deferral of payment. In the longer term, it is very unclear whether the corona crisis will strengthen the carbon bubble or just slow it down. An important recommendation is that the recommendations of the TCFD (Task Force on Climate-related Financial Disclosures) should be followed thoroughly in order to avoid exactly that carbon bubble.
Standards and values
Some argue (perhaps rightly) that it is immoral to extract and burn more fossil fuels than the objectives of the Paris Climate Change Agreement allow. After all, this leads to a lot of unnecessary suffering and damage. Moreover, we know that the most vulnerable social groups are disproportionately affected by climate change. And then there is intergenerational inequality: future generations will be hardest hit, while they have no voice in the debate today.
Fortunately, norms and values can change. Global climate protests and school climate strikes may be an indication that such a change in norms and values is taking place. A recent study showed that a dedicated minority of about 25% of a group can change the opinion of the majority and thus change established norms and values. If dominant norms and values in society change, the pressure on policymakers to change existing institutions (regulatory systems) will increase. Policy initiatives such as the European Green Deal are in turn an important incentive to change the behaviour of companies, among others, a self-reinforcing process of change can be set in motion, in favour of climate neutrality.
Who knows, the corona crisis may lead to a shift in dominant values and norms in society. While many are concerned about the economic impact of the corona measures, others underline the extent to which the stagnation of social and economic life offers room to live differently, with less consumption pressure, more time for what counts (the family) and with the mental relief of being able to step out of the ‘rat race’ for a while. Political scientists are waiting, but anticipate shifts in dominant political values: more willingness to invest in ‘soft sectors’ (such as care), more room for solidarity, while denouncing globalisation and dependence on international markets. The latter may give rise to the strengthening of solidarity within Europe, including in the joint development of a greener economy that is less dependent on ‘external’ fossil fuels.
Education
General knowledge about the causes, consequences, and solutions of climate change has often been lacking, and this knowledge gap is at least often one of the reasons why people often do not feel addressed or involved in the climate story. On the other hand, recent school climate strikes show that younger generations are waking up to the climate problem. It is estimated that the number of school strikers grew to 1.5 million pupils in 125 countries in six months’ time. Many educational initiatives have now been set up to inform pupils and other target groups about climate change. Quality education not only supports and strengthens knowledge about climate, but can also inspire climate action and changes in individual and collective behaviour.
The big challenge, during the corona crisis and afterwards, is to reduce school and learning delays among pupils and students. Specialists are already worried about the proportionally greater learning disadvantages that vulnerable pupils are suffering as a result of the prolonged closure of schools. Digital distance learning may work for children who are doing well at home, but it does not offer a fully-fledged alternative for everyone.
Information
If we want to reduce greenhouse gas emissions, we naturally need to know where the emissions come from, which products cause more/less emissions, and how we can make sustainable choices. Such information can be provided to consumers, for example through product labelling programmes. On the other hand, the population also needs to be clearly informed about the purpose and impact of certain measures, such as shifts in subsidies and taxes. Sufficient communication about the impact of individual choices on emissions can encourage societal changes, although we know that knowledge alone will not suffice.
In these Corona times, Belgium excels in informing the population objectively, correctly and serenely. We were even praised for this by the British newspaper The Financial Times. Every day, experts give an update on the state of affairs: number of infections, hospital admissions, intensive care units, the number of people who were allowed to leave the hospital and the number of deaths. These moments of information are also used to comment on events, rumours and other events.
Perhaps certain aspects of this crisis communication can serve as a source of inspiration for those who want to share information about the climate problem? Inform people objectively and calmly about what works and what doesn’t, what has already been achieved and what we still have ahead of us. This strengthens the feeling that we have to work together on the transition to a climate-neutral world, that the climate transition will not only cost money, but will also bring financial benefits and that we will have a more pleasant and liveable world in its place.
In conclusion. Rockström, Schellnhuber and their co-authors also point out the importance of institutional changes in their article. Government subsidies and tax systems need to be reformed in order to stabilise the emerging more sustainable system. Without the necessary adjustments concerning financing, taxation and regulation, the transition will be slowed down. The authors of the study indicate that extreme climate-related events, such as extreme heat waves and floods, can create a ‘window of opportunity’ to make such adjustments. The corona crisis can also lead to reforms, including in financial flows and regulations. When that happens, let’s take advantage of that opportunity to, in one fell swoop, also tackle the climate problem.
[1] Ilona M. Otto, Jonathan F. Donges, Roger Cremades, Avit Bhowmik, Richard J. Hewitt, Wolfgang Lucht, Johan Rockström, Franziska Allerberger, Mark McCaffrey, Sylvanus S. P. Doe, Alex Lenferna, Nerea Morán, Detlef P. van Vuuren, Hans Joachim Schellnhuber. Social tipping dynamics for stabilizing Earth’s climate by 2050. Proceedings of the National Academy of Sciences Feb 2020, 117 (5) 2354-2365. https://www.pnas.org/content/117/5/2354
Yesterday, we had a new member joining the team! It was a virtual first day at work, but we are very happy nonetheless to have her on board now: Camille will be managing our citizen science project on garden microclimates, and will ensure we roll smoothly through the test phase this summer while building towards the full project for next year.
We are tremenduously happy to have her strengthen our team while we are frantically working backstage on getting everything ready for this ambitious plan.
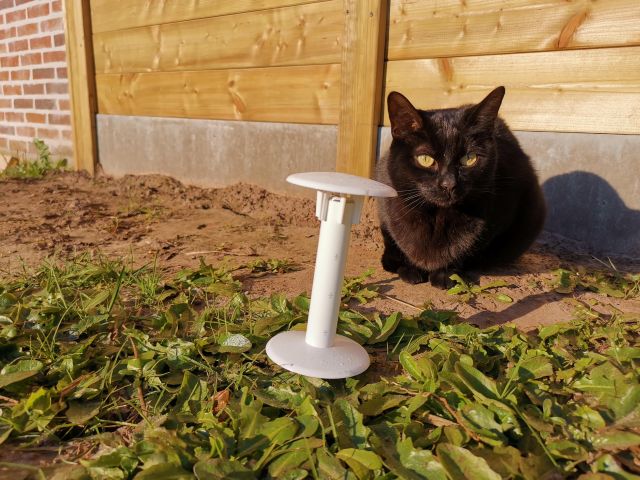
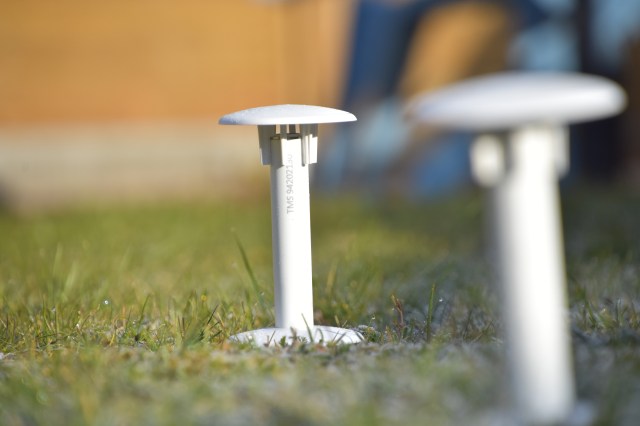
In the meantime, our first batch of TMS4 ‘garden daggers’ for the season – introduced here– is happily logging microclimate data from crispy frozen April mornings and sunny afternoons. Keep an eye out on this place for some first data on the microclimate variability in my own backyard soon!
Our TMS-logger catching the first sun of the morning with their feet in a crispy frozen lawn
As we are all locked up now anyway, we decided to spread the love for garden sciencing across the world, and launched a call on Twitter for our fellow scientists with idle microclimate loggers to start measuring their own gardens as well.
There was a lucky few for which the loggers were not inaccessible in the office, just enough to give our trial project the global flare that it deserves.
That said, we really hope to see all in person again soon in the future! Luckily, the 3D Lab has already gained quite some experience with ‘virtual labbing’, so we are not going to let this homeworking get us down!
Angelica archangelica along mountain road in the northern Scandes, Norway
Skjomen valley, northern Norway
Narvik, Northern Scandes, Norway
Luscinia svecica, Abisko, Sweden
Skjomen valley, northern Norway
Skjomen valley, northern Norway
Lake Törnetrask, Abisko Research Station, Abisko, Sweden
Laktatjakka valley
Seen from Nuolja, Abisko
Lake Törnetrask, Abisko Research Station, Abisko, Sweden
Narvik, Norway
Diapensia lapponica in one of our plots
Norway
Narvik, Norway
Narvik, Norway
Laktatjakka valley
Lake Torneträsk, Abisko, Sweden
Narvik, Norway
Laktatjakka valley
Abisko, Sweden
Epilobium angustifolium
Common heather
Skjomen valley, northern Norway
Saxifraga aizoides, Narvik, Norway
Trifolium repens
Hallerbos 2017
Young bluebell (Hyacinthoides non-scripta) surrounded by flowers of yellow archangel (Lamium galeobdolon)
The common bluebell (Hyacinthoides non-scripta), the signature flower of the Hallerbos
Single bluebell flower surviving on a wetter spot, as indicated by the field of wild garlic (Allium ursinum)
A really wet patch of forest, with giant horsetail (Equisetum telmateia) in a field of wild garlic (Allium ursinum)
Wild garlic (Allium ursinum) in the Hallerbos flowers a bit later than the bluebells, yet this one was already in full bloom
A bumblebee visiting yellow archangel (Lamium galeobdolon)
A bumblebee visiting yellow archangel (Lamium galeobdolon)
Wild garlic (Allium ursinum)
Wild garlic (Allium ursinum)
Weirdly beautiful, the inflorescence of pendulous sedge (Carex pendula), typical for the wettest spots in the forest
Weirdly beautiful, the inflorescence of pendulous sedge (Carex pendula), typical for the wettest spots in the forest
A little stream in the Hallerbos, surrounded by endless fields of wild garlic (Allium ursinum)
The herb-paris (Paris quadrifolia), less common in the forest
Wild garlic (Allium ursinum)
Bluebells (Hyacinthoides non-scripta)
Weirdly beautiful, the inflorescence of pendulous sedge (Carex pendula), typical for the wettest spots in the forest
Another one from the wet plots: large bitter-cress (Cardamine amara)
Another one from the wet plots: large bitter-cress (Cardamine amara)
Young beech leaves, as soon as they are fully grown, spring in the understory is over
A beech forest without understory, most likely too dry and too acid for any survivors
A young beech seedling (Fagus sylvatica), looking nothing like a beech, yet everything like a tiny dancer
Young beech seedling (Fagus sylvatica)
Bluebells (Hyacinthoides non-scripta)
Bluebells (Hyacinthoides non-scripta)
Bluebells (Hyacinthoides non-scripta)
Mountain melick (Melica nutans), a grass in the most amazing green
Bluebells (Hyacinthoides non-scripta) in a rare patch of mountain melick (Melica nutans), a grass in the most amazing green
Bluebells (Hyacinthoides non-scripta)
Bluebells (Hyacinthoides non-scripta)
Montpellier 2017
The entrance to the cathedral of Montpellier
The cathedral of Montpellier
The entrance to the cathedral of Montpellier
The cathedral of Montpellier
Narcissus poetics
The cathedral of Montpellier
The botanical garden of Montpellier
The botanical garden of Montpellier
The botanical garden of Montpellier
Brackish Camargue vegetation
Brackish Camargue vegetation
Brackish Camargue vegetation
A typical lagune
Brackish Camargue vegetation
Camargue horses
Camargue horses
Camargue horses
Brackish Camargue vegetation
Brackish Camargue vegetation
Brackish Camargue vegetation
Camargue horses
Brackish Camargue vegetation
Little egret in the evening sun
Flamingo’s in the evening sun
A typical lagune
Dandelion fuzz
Grass lily
Grass lily
Dandelion fuzz
Veronica in a sea of poplar fluff
Euphorbia in a sea of poplar fluff
Poplar
Gare du Midi, Brussels
Gare du Midi, Brussels
Gare du Midi, Brussels
Gare du Midi, Brussels
Sweden autumn 2016
Autumn in Abisko
Yellow leaves of mountain birch, with lake Torneträsk in the background.
Lapporten, the gate to Lapland, in Abisko
Rain blowing over the Abisko National Park
The colours of the north: red fireweed and yellow mountain birches, with lake Torneträsk on the background
Yellow leaves of mountain birch, with lake Torneträsk in the background.
Rain on the background, the ski lift in Abisko on the foreground
The steep slope of mount Nuolja on a dramatic looking morning
The beautiful colors of lake Torneträsk in Abisko
A little stream on top of the mountain, with a view on Lapporten, the gate to Lapland
Well, that is a beautiful table with a nice view on lake Torneträsk in Abisko
Our little experiment on top of the mountain in Abisko, with a view on Lapporten
Autumn in Abisko is extremely colorfull
The ski lift with a view on Abisko National Park and Lapporten
Hiking dowhill towards lake Torneträsk
This green is greener than the greenest green: moss on top of mount Nuolja
Well, that is a beautiful table with a nice view on lake Torneträsk in Abisko
The ski lift with a view on Abisko National Park and Lapporten
The ski lift with a view on Abisko National Park and Lapporten
The most beautiful hiking trail of the world: Nuolja in Abisko
Angelica archangelica, often the biggest plant of the Arctic
The most beautiful hiking trail of the world: Nuolja in Abisko
Cirsium helenioides, the melancholy thistle
Hiking down mount Nuolja
The steep slope of mount Nuolja on a dramatic looking morning
The colours of the north: red fireweed and yellow mountain birches, with lake Torneträsk on the background
The prettiest yellow and blue: autumn in Abisko
Fireweed, Epilobium angustifolium
Campanula or bellflower, I think ‘uniflora’
Vaccinium myrtillus
Cornus suecica, the prettiest red of the world
Hieracium alpinum, alpine hawkweed
Carex atrata, one of my favourite sedges
Alpine clubmoss, Diphasiastrum alpinum
Agrostis capillaris, bentgrass
Common yarrow (Achillea millefolium)
Anthoxanthum odoratum, sweet vernal grass, fully grown and mature
Snow scooter trail
Our plot in the mids of a field of horsetails (Equisetum pratense)
Equisetum pratense
Cliff overlooking the valley with the road to Norway
Seedling of Taraxacum officinale, the dandelion, after two years of growing in bad conditions
Poa alpina, the alpine meadow-grass, with its viviparous seeds
Massive flowerhead of Angelica archangelica
Angelica archangelica
Blueberry (Vaccinium myrtillus) in autumn
A lowland marsh in Abisko in autumn
Installing the plots of our trail observations on top of mount Nuolja
Installing the plots of our trail observations on top of mount Nuolja
Tanacetum vulgare (Tansy), non-native for the high north
Autumn forest down in the valley
The valley of Nuolja to Björkliden
Summer on the Nuolja-side
A full rainbow behind mount Nuolja in Abisko
It’s raining in the west, clouds trapped behind the mountains
A strong wind blowing rain from behind the mountains to our side
A strong wind blowing rain from behind the mountains to our side
Betula nana, the dwarf birch, mini autumn forest
Betula nana, the dwarf birch, mini autumn forest
The valley of Björkliden in autumn
The valley of Björkliden in autumn
The valley of Björkliden in autumn
The valley of Björkliden in autumn
Sweden spring 2016
Trifolium repens
Salix reticulata
Trifolium pratense
Cornus suecica
Western European species like the red clover (Trifolium pratense) here are often listed as non-native species in mountain regions.
A rainy hike
Melting snowpatch on a lake
Oxyria digyna
Ranunculus glacialis
Dryas octopetala
Although the alpine zone has been harder for invasives to access than most places, human structures like trails are often an easy gateway for the invaders to get up there. Picture from Abisko, Swedish Lapland.
Bartsia alpina
The valley of the lakes
Rubus arcticus
Ranunculus glacialis
Silene acaulis
Silene suecica
Eriophorum vaginatum
Overlooking the valley of Laktajakka
Amiens
Just outside of Amiens
Cathedral at night
Almost cold enough for ice-skating
The southern side
Frozen to the bone
Cathedral seen from the frozen Parc Saint-Pierre
Nice architectural curve
Gargoyle planning to eat the cathedral
Maria without a shirt
Cathedral with a glimpse of spring
View from my office window
Le Club d’Aviron in winter weather
House on the square before the cathedral
Colourful mirror
Sunny but cold, the Quai Bélu
Frozen mirror
Enjoying silence and the morning sun
Sunny but cold, the Quai Bélu
View from my office window
Cathedral at night
Cold!
Cathedral at night
Cathedral at night
Amiens is filled with cute little houses
The museum behind the beautiful gates
Sun rising above the water
Winter sun on the Place du Don
Sweden autumn 2015
Lichen
Sweden summer 2015
View on the 1000 meter plots
Doing research on a cold Arctic morning
Plots flooded by the snowmelt
Flooded by the snowmelt
Meltwater river, racing down the mountain
After a hike, even the most basic house looks cosy. Little hut in the mountains, open for everybody
Snowbridge, maybe don’t cross…
Snowbridge
View from a cliff
Silene acaulis or cushion pink, cutest plant of the Arctic
Two seasons in one image
Steep slope
Hiking down
Narvik Kirche, church of the subarctic
Narvik Kirche
Reindeer on top of the mountain
Narvik Kirche
Summer at the church
Summer flowers
Massive waterfall
Young willow catkins
View from Narvik’s hospital, with lilac flowers
Building a bridge over the fjord will gain al drivers at least an hour
Norwegian fjord
Posing with the water, getting soaked
Minimalistic mountains
Insect investigating our reindeer antler
Catching mosquitoes with our license plate, harvest of the year!
Posing with the plot
Fieldwork on the most beautiful spot of the world
Fieldwork on the most beautiful spot of the world
Summer bridge – still next to the sadly impassable river
Rhinanthus flower in the mountains
Plateau in the valley, beautiful brown
Experimental view from my favourite plot
Salix catkins
Extremely old Betula tree
Waterfall from a cliff
Buttercup is the earliest in spring, here
Rocks!
Alpine views
Views!
Fieldwork
Jumping over rivers
Plot
Golden plover
Angry lemming
Green, the whole north is green!
Snow, so much snow left!
Minimalistic mountain moments
Fieldwork
The research center
Red clover – focal invader
Look at this tiny cute snail!
Massive floods of melting water
Bartsia alpina
Hooray, a toilet!
Dryas octopetala
Lowest elevation plots
Butterball!
That’s a lot of water
Midnight sun is the best
At the lakeside
Beautiful Bistorta vivipara
Don’t fall in the water
Midnight sun
Wild river
Art – made by ages of wild rivers
Baby firework for America’s independence day
Midnight sun at the lake
The Abisko canyon was wilder than ever
That’s a crazy amount of water!
The Abisko canyon was wilder than ever
The Abisko canyon was wilder than ever
Black and white
Stone-man overlooking Abisko
Nothing as soft as a willow catkin
Label and soil temperature sensor attached
I’d drive to the top every day
Reflections
Rocks and clouds
Brave little birch
Brewing our camping poison
Basic camping stuff
Camping in Norway
Home-made temperature houses
Roadside research at its best
Norway is crazy
Horsetail is so funny
Little creek in magical forest
Birches, birches everywhere
Beautiful rock, a gift from the river
Another roadside fellow
Lichen
Ready to rock the summer
Collecting mosses
That’s a crazy old lichen
Tiny tiny piny trees, but old, so old!
Ready to jump into the fjord?
Ready to jump into the fjord?
That’s a spiky stone!
Views on Norwegian fjords
Silene in the mountains
Cute little orchid
Skua
Attacking skua, mind your heads!
Watch out for the attack of the fierce skua!
Black snail
New plot!
Still a lot of snow to melt, but this spot was free for a new plot
Reindeer are better than people
Two seasons in one picture
Let’s see what is happening to the balance in mountains! Is this a starting avalanche, or will it last a bit longer?
Cute little hut
Climbing mountains by car
Softest moss in history
Drosera in the marsh
Hiking in no-man’s land
The clouds are coming
Abisko valley
‘Butterball’
Fieldwork in the tundra
Abisko valley
Little plot
Clouds and sun and mountains
Making soup on a campfire with a view
Little creek on high elevations
Skua on the look-out
Melting snow in a river
Rhodiola rosea and the Törnetrask lake
Beginning of spring
Flooded plots, melting snow, impassible wetness
Ferns and horsetails
Chile 2015
Lunch made by our local colleague, with funny bread (tasty as well!)
Trips to the field sites were sometimes a real adventure, especially right after snowmelt


")


")
")


")


")


")


")


")


