
Remember my post from early 2019, where I put my R-skills to good use for society? The idea was to visualise the number of kittens in our local animal shelter throughout the season to get an idea of when the peaks could be expected.

This has turned out to be a crucial excercise for the animal shelters and the foster families taking care of the kittens: they used it to await patiently the peak to come in spring, to ensure they stocked enough kitten milk and other amenities for when the peak would be there, and prepared them for the second peak, right when after summer everything seems to cool down.
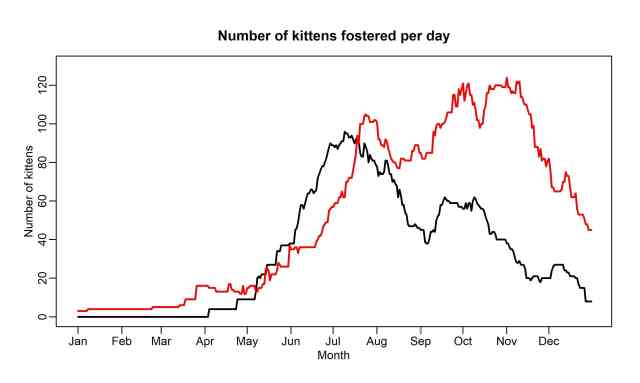
Number of kittens throughout the season in 2018 (black line) and 2019 (red line)
Yet one year of data is only that much. If we truly want to predict accurately how kitten numbers will evolve throughout the season, we’ll need to build a long-term monitoring scheme. As you can see in the graph, indeed, there were some surprises in 2019s’ red line: the peak came quite a bit later, with the mass of the kittens being dropped at the shelter only mid July, instead of mid June as in 2018.
Please love me!
Moreover – and that caused special burden on the animal shelter – the second (and third!) peak in autumn far exceeded those of 2018, with both in October and November more than 120 kittens at the same time sheltered in foster families.

We will keep monitoring what comes in and goes out this year, to add a third time series to our graph. The ultimate goal would be to come up with a predictive model of those peaks in the season. I have high hopes, for example, that warm weather in springtime will be a decent predictor of the number of kittens coming in two to three months later.
But we should all know the dangers of correlative predictive modelling by now, especially for topics where we lack the expertise. Finding patterns is easy, deciphering the mechanisms behind them often needs four years of dedicated study. So, for now I’ll stick to my descriptive curves, and some broad generalisations.
But that limited expertise can tell you one more thing: with the ongoing social distancing, the peak in kittens will be severily delayed this year (as very few people will either find or save abandoned kittens), yet will hit us twice as hard after summer (when all abandoned kittens of the spring time will profit from the warm autumn weather to make new nests themselves).
Mark my words!


")


")
")


")


")


")


")


")


