Forest variation

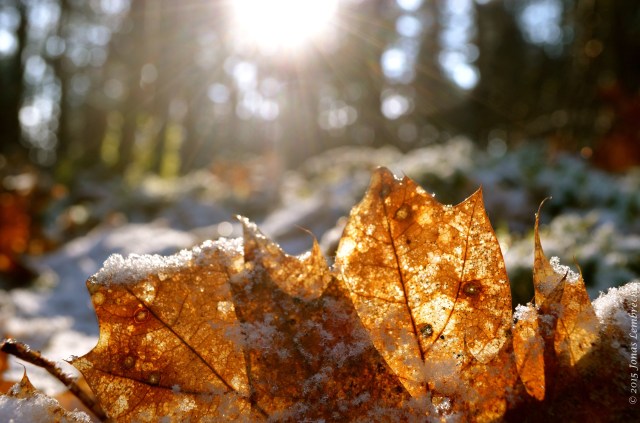
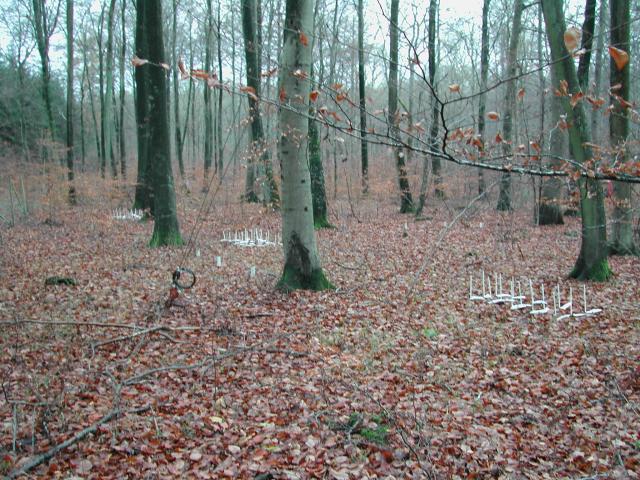
Small-scale variation. It is a super important part of my research. I mostly look at it from a human perspective: how humans can disturb an ecosystem and change the whole hidden set of abiotic and biotic factors that drive these systems with it.

Fot - 2

Arum maculatum (arum lily), a species of the dry beech forest floor

Yet, microvariation is of course not limited to human influences, it is omnipresent in many ecosystem and an important driver of the large diversity we observe in many places.

Fot - 7

Golden saxifrage (Chrysosplenium), typical for wet forests

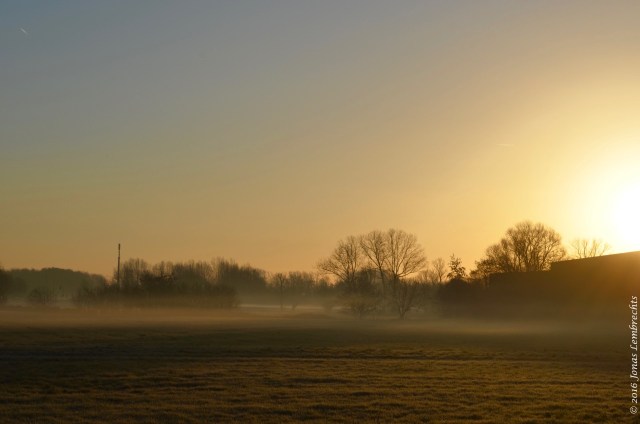
One of my favourite examples of natural microvariation is given by forests accompanying creeks. This forest type never counts for a large percentage of the forest area, yet it means an important lot for the biodiversity.

Fot - 9

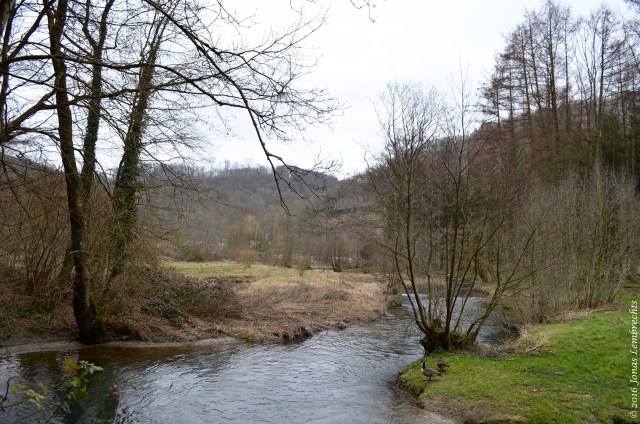
As conditions can change dramatically over the course of tens of centimeters, so does the vegetation, with the most rare species survival only on these few small spots throughout the forests of the region.

Fot - 8

Forest anemone

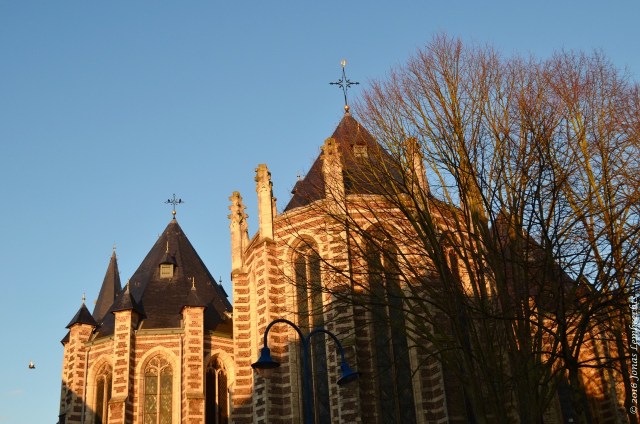
We found a beautiful patch of this forest type in the Condroz in the Walloon region, last week. Even more interesting, it was accompanied by some human disturbance: old stone walls and remnants that provided the totally opposite conditions and were a walhalla for rock species.

Fot - 6

Maidenhair spleenwort, a typical rock fern

Posted in Belgium | Tagged , , , , , , , , , , , , | Leave a comment

On how leaves decompose

Climate poses a stronger control on litter decomposition than the species or the origin of the litter. That is the main conclusion of our recent paper in Biogeosciences (on which I collaborated primarily as a statistician).
Leaf of Norway maple - National Park Hoge Kempen
Getting to know the details about the decomposition of organic matter is a key part in our growing understanding of climate change, as it is a fundamental part of the cycle driving the movement of elements like carbon and nitrogen throughout the ecosystem. The latter is in its turn strong interwoven with the causes and effects of climate change.
Litter Soroe 02
Experimental litter in bags in beech forest in Denmark  (These and the next pictures: MPE)
We now proved with data from a large European gradient that the rates at which this plant litter decomposes strongly depends on the climate. Temperature, precipitation and water content of the soil, all of them influenced how much of the litter remained, and which elements to find in the remaining parts.
OLYMPUS DIGITAL CAMERA

Pine forest in southern Estonia

 This clear correlation is interesting, as it allows us to predict the decomposition with a few parameters that are easy to obtain. Within our diverse set of sites throughout Europe, warmer and wetter climate makes the breakdown go faster. We could then start speculating if this decomposition would also accelerate when the climate gets warmer.
Litter Soroe 01

Litter bags distributed on the forest floor

This nice correlation with the climate of course does not replace the role of all kinds of other factors that drive decomposition on a small scale (like mycorrhiza and soil organisms, for example), yet the broad correlations found along the European gradient prove that fast large-scale predictions are definitely possible.

Reference

Portillo-Estrada et al. (2016). Climatic controls on leaf litter decomposition across European forests and grasslands revealed by reciprocal litter transplantation experiments. Biogeosciences.

Posted in Science | Tagged , , , , , , , , , | 1 Comment

Spring…

… is now really on its way here in Belgium!

Fot - 1

First flowers are coming through (with the catkins as usual in the lead), bringing the much desired colour back to the world. And finally, I can bike home from work in the beauty of the evening sun instead of the dark depths of endless winter nights.

And this year I am prepared to face the growing season. I spent considerable amounts of time this winter learning plant species, and I feel it is already paying off with the first ones coming through.

Fot - 3

Of course, it is still necessary to see them in real life, be close to them and study them, but keeping my summer knowledge alive during winter strongly improves my chances to get beyond what I knew in the previous years.

Fot - 2

And that is from vital importance in a business that relies as heavily on the correct determination of plant species as mine!

Posted in Belgium | Tagged , , , , , , , , , , | 1 Comment

Outreach

Outreach is to the scientific project as the church steeple to the church. It comes at the very end, and might not take the longest, but you definitely need it to finish up a story and get a feeling of satisfaction.

Fot - 1

The steeple of the church of Kontich in the evening sun

I am currently very busy putting steeples on two finished churches. The first one is a paper in Ecography, of which I am the first author, which we will try to promote through a press release, as I am convinced the results are relevant and interesting for a broad audience. There might then of course follow some more detailed explanations through blog posts as well.

Fot - 3

The second one is a paper in Biogeosciences, on which I collaborate as a statistician. For this one, the outreach will stay limited to a blog post.

Fot - 2

With these two papers, it has thus been a busy 2016 already, and we are only March… I truly hope we will have some more steeples to add to our churches before the year ends, but I assure you we are working hard to make that happen!

Fot - 4

Posted in Science | Tagged , , , , , , , , , , | 4 Comments

Close to home

Somehow, smoothly and almost unnoticed, I entered a truly different phase in my PhD, and it is a phase I find surprisingly comfortable.

Fot - 3

University building in the morning sun

It is that point at which most of the fundamental data is collected, when everything is getting nicely organised and you know exactly what data you have. A phase that thus clearly shifted the focus from data collection to writing and analysing.

Fot - 5

At the moment, there is thus not much travelling going on, except of the daily routine, biking from home to work and back (the tiny travels on which these pictures were taken). But that is a good thing. Data analysis is a demanding task, that asks for my attention for an extended period of time.

Fot - 1

Mist and morning sun

The good thing is, I know what I wat to tell. All the hypotheses for all sub-projects are already developed, and now it is the exciting work to search for answers within the data. And as I said, I find this phase surprisingly comfortable.

Fot - 6

The 3 swans, art on the university campus

It is comfortable, as I clearly notice that I learned a lot during the previous years. There has been serious trial and error, but through all these errors I worked towards a wide arsenal of skills that I can now use to go out and beyond.

Fot - 4

If 2012-me would have known me, he’d probably have been very impressed.

Posted in Belgium | Tagged , , , , , , , , , , | Leave a comment

An elegant proof of global warming

An easy yet elegant experiment to prove the role of carbon dioxide in global warming and show its effect to children, that was the question my colleagues were working on. The experiment is in fact really elegant, so I am happy to share it with you.

img_20160226_130517_24982885100_o

Experimental set-up, with from bottom to top: a glass of hot water, a tube with carbon dioxide and a thermal camera

What you need is in the first place a tube, connected to a carbon dioxide source (our imaginative atmosphere). At one end of the tube, there comes a warm object (a candle, a glass of hot water, the earth, or anything else you have at hand), the other side of the tube is guarded by the thermal camera (the exact reason why I got involved, as thermal camera specialist).

img_20160226_130506_25278483325_o

The thermal camera

The thermal camera will pick up the temperature of the warm object through the recording of infrared radiation. However, if we pump the invisible gas carbon dioxide into the tube, the temperature shown on the monitor will go down!

img_20160226_130542_24982889240_o

Interestingly, it is not really the temperature of our candle that is not really going down. The candle gives of infrared radiation, the camera records exactly that. However, carbon dioxide is highly effective in absorbing this infrared radiation (at least part of it), which is exactly why we call it a greenhouse gas. The heath will not be able to escape through the tube and get recorded by the camera, so the temperature appears lower.

img_20160226_130604_25160244362_o

The same thing would appear on our screen if we would imagine the thermal camera looking from outer space towards our earth. Earth omits heath as infrared radiation, our imaginative camera records it. However, several particles in our atmosphere, of which carbon dioxide is the most famous one, absorb this radiation and keep it trapped. The temperature of the earth gets higher, as less heath can escape towards our ‘thermal camera’ and outer space. So: the temperature on the camera appears lower, exactly because our candle/earth is warmer (which is an important sentence to grasp the meaning of the experiment).

img_20160226_130533_25160241792_o

Pressure gauge of the bottle with carbon dioxide

It took us some finetuning of the temperature range of the camera, but in the end we managed to show the pattern as nicely as the scientists in this video. Now, my colleagues will take this little experiment to the children’s university at the end of this week, to give a bunch of 8 till 14-year-olds an awesome day, a nice encounter with science and a reasonable idea of how global warming works.

Posted in Science | Tagged , , , , , , , , , | Leave a comment