Not all fieldwork pictures are equally breathtaking. While part of our team waded through the muddy mud of De Driehoek – one of our university campus’s last patches of nature – another group embarked on a rather more inspiring mission: retrieving microclimate sensor data from the cliffs of Freyr, Belgium’s highest rock wall. The pictures I received from them, made by photographer Kobe Burdack, might just be what you needed to want to join the project…
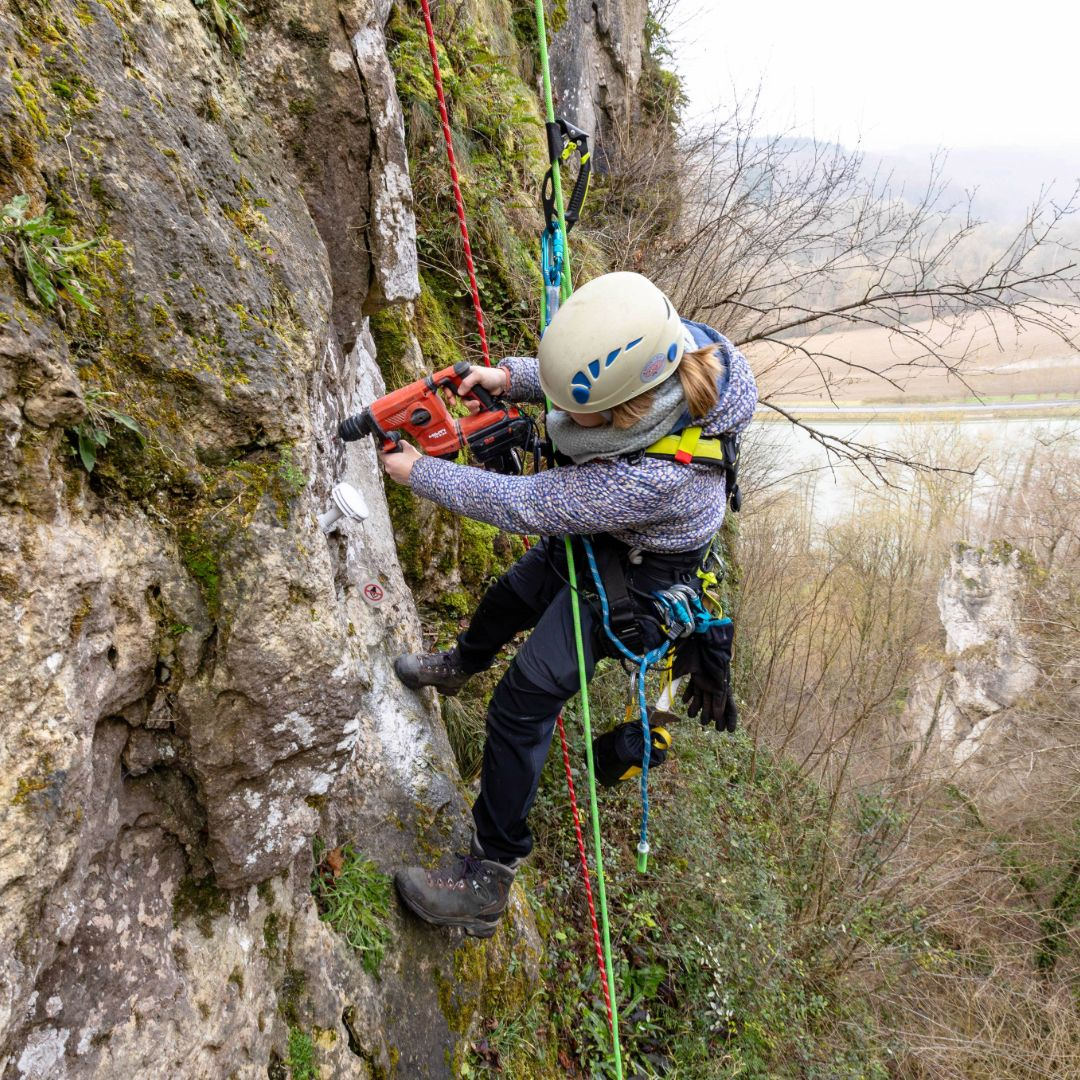
Last summer, as part of our MIREN Rocks project, we – well, not me… – monitored plant biodiversity on these cliffs to study rock vegetation worldwide. Our research explores the impact of climbing, species diversity, and the role of rock microclimates in shaping these unique ecosystems.
Master student Sarane preparing to rappel down to the sensor. Pictures by Kobe Burdack.
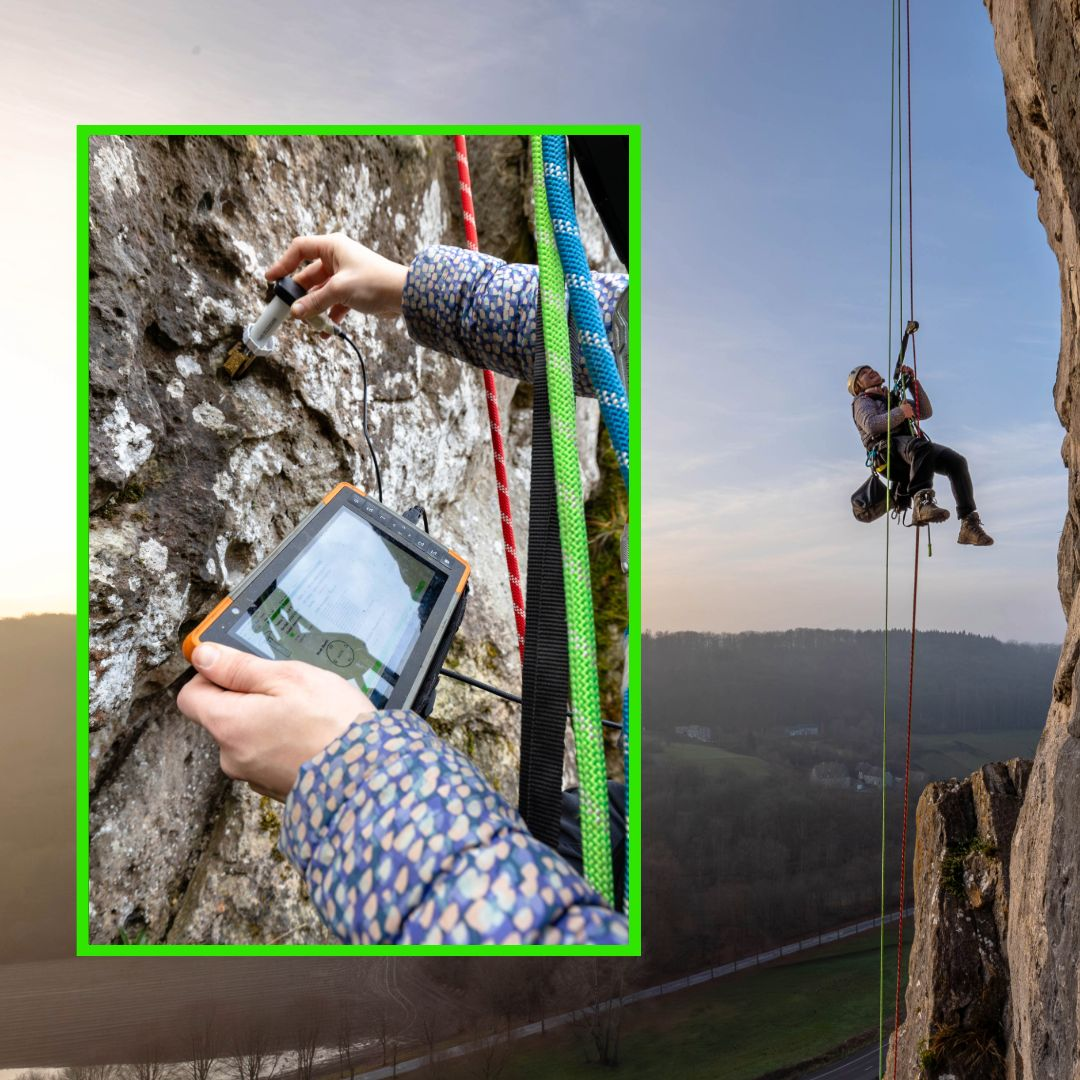
To track temperature fluctuations, we use TOMST Thermologgers, securely mounted to the rock face. These sensors are read using a Juniper Systems Mesa 2 field computer—compact enough to be carried to heights of more than 100 meters! However, installing them was far from simple. Unlike in more accessible terrains, this task required rope access techniques, high-quality climbing gear, and a reliable mounting method—eventually, drilling a hole proved most effective.
Drilling a hole for secure sensor installation. Pictures by Kobe Burdack.Reading out TOMST Thermologgers high above the river Meuse. Pictures by Kobe Burdack.
The MIREN Rocks project is always looking for new participants to expand our surveys to rock faces around the world. Do you have a background in ecology or botany, and are you comfortable climbing or working at heights? Join the survey! Visit our website for more details: https://www.mountaininvasions.org/miren-rocks
In 2012, during my master’s thesis, we began monitoring vegetation along three Norwegian mountain roads with a clear goal: to track how these plant communities would change over time. Time, of course, is a relative concept, and nature operates on a much slower clock than we do. Now, over a decade later—after one PhD, two postdocs, and six months as an assistant professor—we’ve finally published the first temporal analysis of those roads, covering the initial decade of monitoring (Clavel et al. 2024 in Oikos, here).
Red clover in the roadside of one of our Norwegian roads, back in 2014.
Naturally, we were curious to see whether a decade would be enough to reveal significant changes, particularly in the spread of non-native species. After all, much of my PhD work revolved around the hypothesis that plant invasions in these Norwegian mountains were relatively recent, spurred by a warming climate and possibly increased human activity in the region. My experiments had shown that some key non-native species in the area, like Achillea millefolium and Trifolium repens (and pratense), could thrive hundreds of meters above their current elevational limits—provided they found nutrient-rich disturbed plots (Lembrechts et al. 2016). Furthermore, a global study from the Mountain Invasion Research Network (MIREN), which includes our region, indicated that a decade was often enough to detect increases in non-native species richness and elevational limits along mountain roads (Iseli et al. 2023).
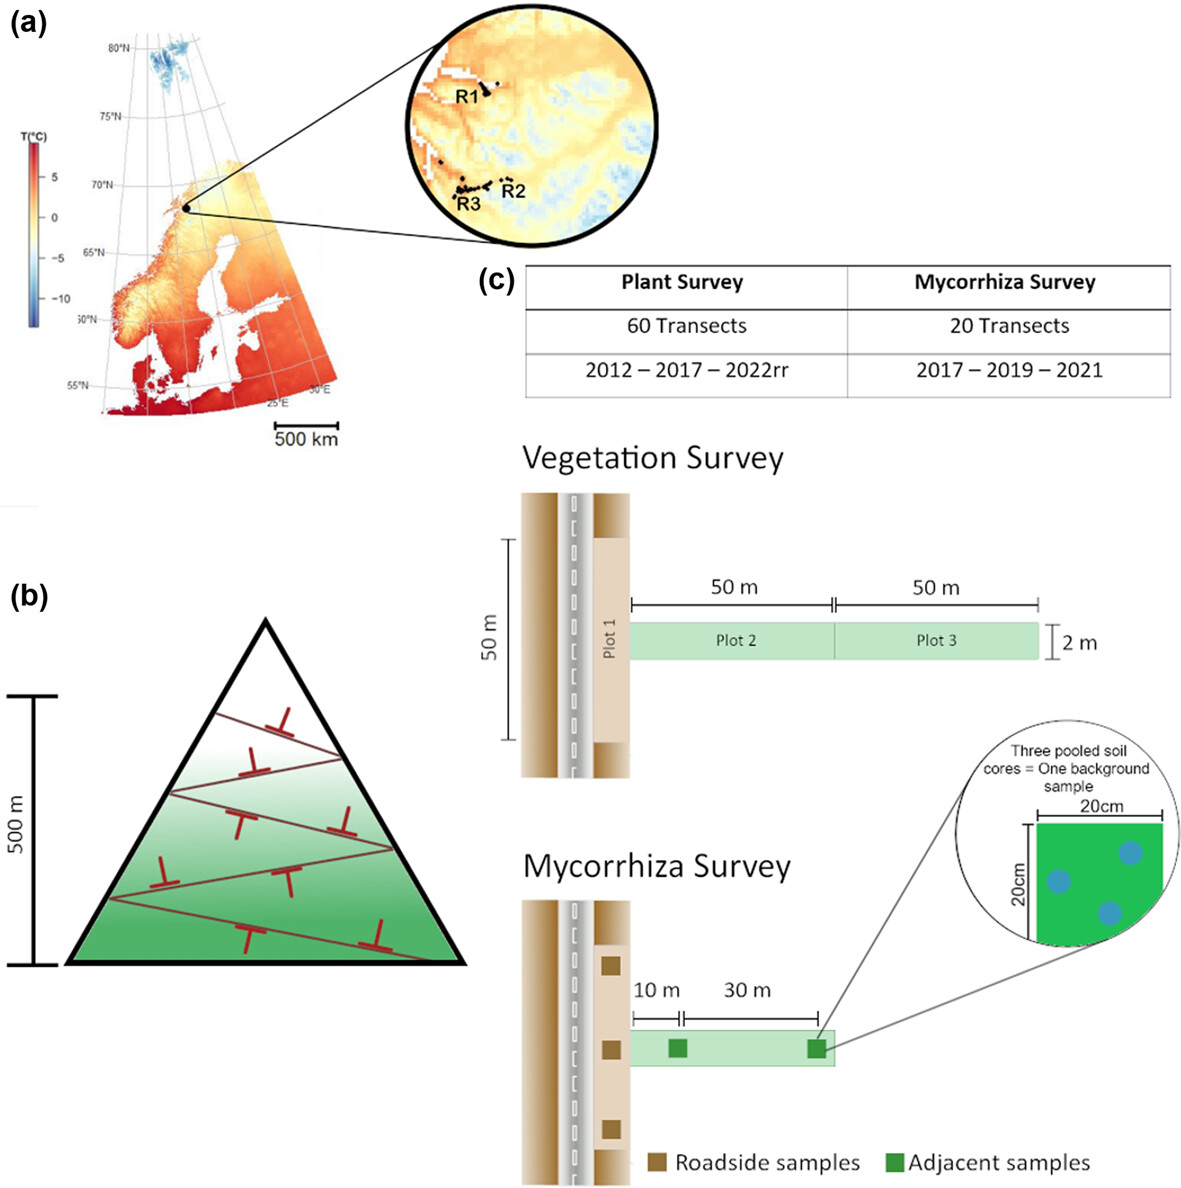
Study design, showing the typical T-shape of the MIREN-transects, as well as the plant and mycorrhizal surveys we did in them.
So, what’s happening with these non-native species in northern Norway? First, the headline result: we found no evidence of an upward shift in their elevational limits or increased invasion into adjacent, undisturbed vegetation. This stability aligns with another study we published earlier (Wiegmans et al. 2024), which showed that non-native species in northern Sweden have been present since the early 20th century, coinciding with railroad construction, and that their presence has actually declined slightly over the last century. This raises an intriguing possibility: perhaps these species have already reached their elevational limits, finding equilibrium with the current climate. If that’s true, their upward expansion may proceed only slowly, in step with climate warming, rather than leaping ahead as non-native species do in the early phases of their introduction.
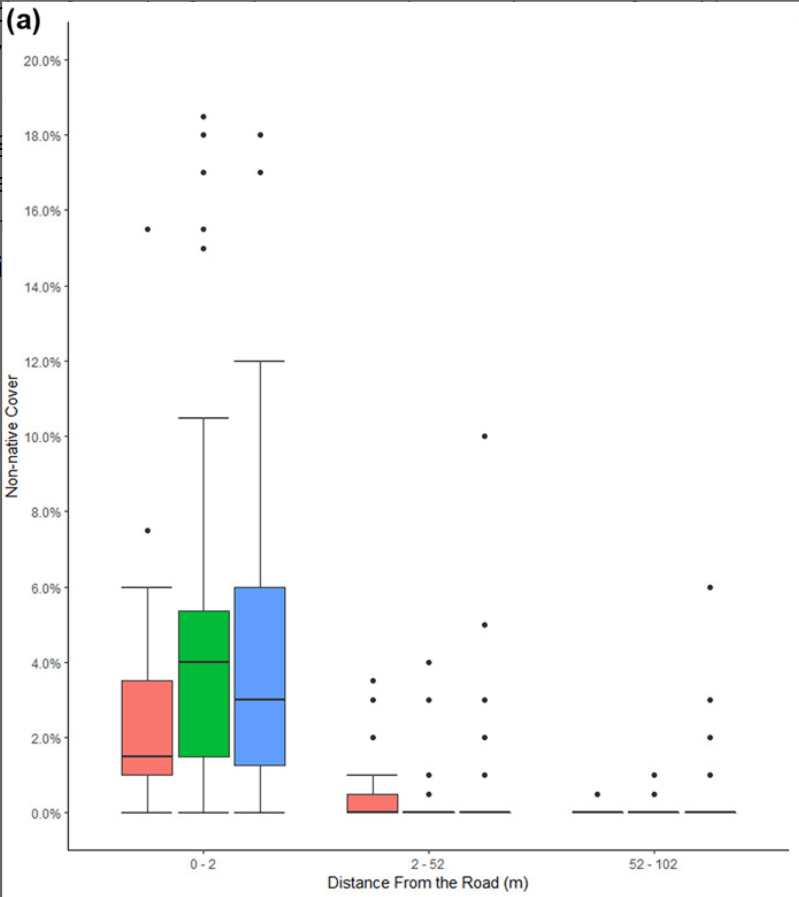
However, we did observe two clear signs of change: non-native species increased significantly in cover, and their richness rose from 17 to 23 species—a 35% increase! This could indicate that notable shifts are happening despite the lack of upward movement. But caution is warranted. These roads undergo periodic cycles of intensive roadside management, including the addition of fresh gravel, which resets succession along the roadsides. With only three time points over a decade, it’s too early to say whether these observed changes are part of a longer-term trend or simply a result of disturbance cycles. For now, the evidence suggests the area isn’t facing imminent danger from invasive species running rampant. Yet, if these species are currently at their climatic comfort zone, accelerating climate warming—as we fully expect—could quickly change the situation.
A significant increase in non-native cover in the roadsides (0-2 m from the road) over time (red = 2012, blue = 2022), yet not in the adjacent vegetation.
In earlier work, we also investigated whether the upward expansion of non-native species might be limited by a lack of suitable mycorrhizal fungi. We hypothesized that these species might be missing their underground partners, crucial for survival at higher elevations. Surprisingly, that wasn’t the case (Clavel et al. 2020). All the non-native species associate with arbuscular mycorrhizal fungi (AMF), which are present along the entire elevational gradient and flexible enough to pair with these plants. The native vegetation, however, is dominated by ericoid and ectomycorrhizal fungi, which seem to create a substantial barrier to non-native expansion away from the roadsides.
The heathland vegetation – with its ericoid mycorrhizal fungal community – remains highly resistant to non-native plant species in the system. Despite the increasing cover in the roadside, non-native presence in this type of vegetation remains virtually zero.
To delve deeper into this relationship, we conducted three surveys over five years to assess mycorrhizal diversity in plant roots along the roads. We wanted to tackle the chicken-and-egg question: do AMF facilitate non-native species expansion, or does non-native expansion drive AMF proliferation? Interestingly, we found an increase in AM fungal abundance at lower elevations along the roadsides over the past few years, which may correlate with the rise in non-native species cover. However, when we tested these relationships at the plot level, our results suggested that changes in non-native species cover didn’t drive AM fungal abundance. Instead, the shifts might rather be linked to changes in the native roadside community, which is itself more AMF-dominated than the surrounding natural vegetation.
And so, here we are, over a decade after my first tentative steps along these Norwegian mountain roads, with some initial conclusions: no rapid upward shifts in non-native species so far, but a clear expansion in their cover and richness. Whether this is due to rapid niche filling or simply interannual variations in disturbance is something we’ll need another decade of monitoring to unravel. For now, it seems unlikely that AM fungi are playing a leading role in this story.
Reference:
Clavel et al. (2025) Temporal effects of road disturbance on the spread of non-native plants and arbuscular mycorrhizal fungi in subarctic mountain ecosystems. Oikos https://doi.org/10.1111/oik.11075
The 3D Lab is a dynamic team of young scientists, brought together by their shared enthusiasm for exploring scientific topics under my guidance. Currently, the team comprises one postdoc, one PhD student, and several master and bachelor students. For many, this is their first real experience with science, and I am deeply committed to making it as inspiring and impactful as possible.
A key feature of our lab is a series of voluntary sessions—usually held weekly—that cover various topics essential for budding scientists. These sessions are designed to empower team members with practical skills and critical insights into the scientific process. They fall into three main categories:
Teamwork: Sharing findings, participating in journal clubs, “shut up and write” sessions, expert talks, and collaborative brainstorming.
Statistics and coding: From introductions to R and Python to advanced topics like the Tidyverse, linear mixed models, and data visualization in R.
The scientific process: Career prospects, paper writing, peer review, research design, and even hands-on fieldwork sessions – everything that makes you a scientist.
Most sessions (apart from fieldwork, obviously) are conducted online to accommodate diverse schedules, with recordings made available afterwards for key topics like R tutorials that students might need at a later point in their work. Interactivity is a priority—students share their input, collaborate, and learn from each other.
What topics do students value most?
Twice a year, I survey lab members (both new and returning) to understand their preferences for upcoming sessions. While I don’t strictly follow the voting results—sometimes students aren’t aware of what they need, I must admit—it provides valuable insights into their priorities. I thought to share those insights with you as well, as there might be others interested to learn about what students want!
Here’s what stood out in our latest poll:
Summary of the topical votes for the latest round. Students can vote for as many as they want, and their top 3 gets double points. If you want to know more details about some of these sessions not discussed below, let me know!
1. Statistics & coding: practical tools they crave
Unsurprisingly, sessions on the Tidyverse, figure creation in R, and linear mixed models consistently top the list. These workshops address gaps in the curriculum and equip students to handle real-world research challenges, and are really aligned with the ecological research they’ll be doing with me:
Tidyverse: essential for cleaning messy data and merging datasets—tasks they frequently encounter in our projects. Our groups’ PhD researcher, Stijn, has developed an excellent tool to guide them through these processes.
Figure making: A collaborative, creative session where we refine their data visualization skills together.
Linear Mixed Models: Building confidence to transition from theory to application on real datasets.
2. The scientific process: navigating uncertainty
The most popular session this year in the wishlists was the discussion on career prospects, perhaps as a reflection of the concerns young scientists might have about the competitive academic job market and the need to explore non-academic opportunities – which remain often hard to find.
Other popular sessions in this category include how to write a paper and how to design a research question. I’m continuously enhancing these sessions to be more interactive, allowing students to exchange tips, insights, and experiences, which creates an engaging and collaborative learning environment.
Finally, my aspiring ecologists are always eager to get into the field, joining colleagues on projects to explore nature and gain hands-on experience. These fieldwork sessions not only immerse them in exciting research but also provide invaluable support for each other in collecting sometimes tedious or complex data. Students awaiting their summer expeditions to Scandinavia often jump at the chance to participate in local fieldwork projects in the Netherlands during spring, building both skills and camaraderie.
3. Teamwork
Students value sessions where we discuss the latest research in their field. While journal clubs and paper presentations (IRead) are less popular—likely due to time constraints or hesitation as early-career scientists to come up with strongly founded opinions—they’re highly enthusiastic for:
Expert talks: Learning from guest speakers.
SciUpdates: Hearing my latest updates on the research in the field, followed by lively discussions to inspire new perspectives.
Based on their feedback, I plan to expand our sessions further to include e.g., spatial data analysis in R. As a final note: these sessions remain entirely optional, supplementing our mandatory biweekly lab meetings where we discuss progress and shared concerns.
I’m curious to hear from others running young labs! What kinds of sessions have been successful in your teams? How do you balance student interests with essential skills they might not yet recognize as priorities? Are there ideas here that you’d like to adopt?
The northern Scandinavian part of last years’ team
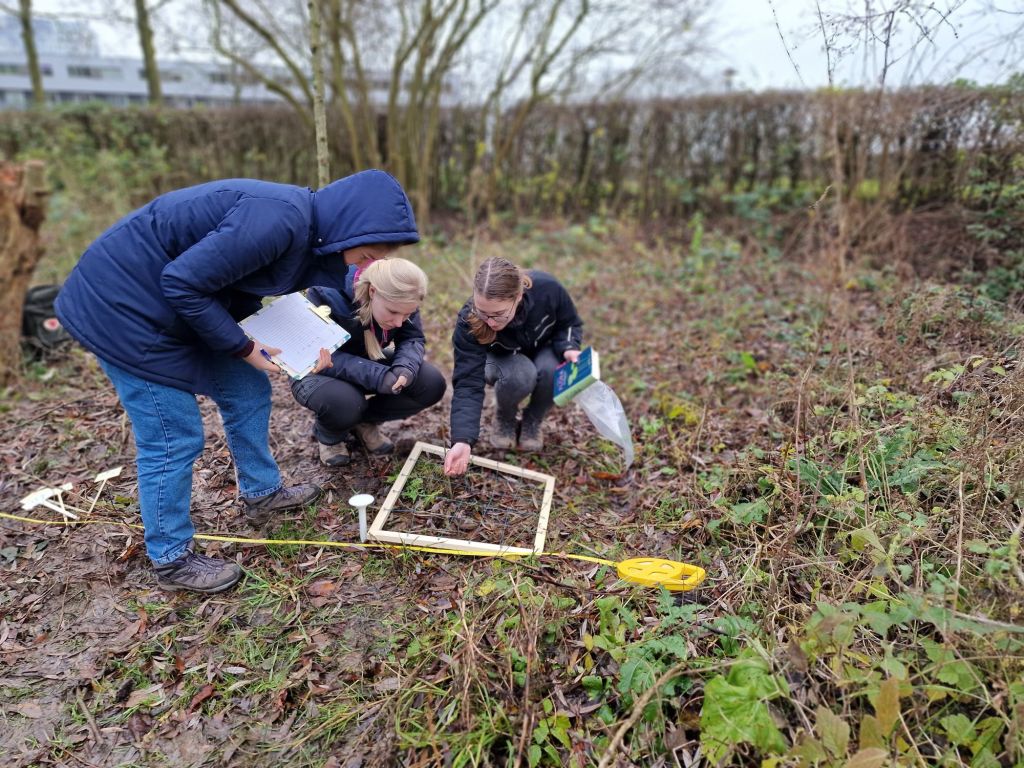
It’s fieldwork time again! We have started to enjoy some cold, grey and dark days in the Dutch mud the last weeks, for our new project on the scale at which biodiversity varies (more on that here).
Fieldwork in December, you might ask? Isn’t that by far the worst period to look at plant biodiversity? Oh, I can tell you, it is! The Dutch vegetation is looking pretty drabby at the moment – few hooray-moments about Dutch biodiversity, I must tell – and it’s also lacking quite a lot of its distinct features that facilitate identification.
First destination of our ambitious long-term biodiversity monitoring campaign tackles the biodiversity on the university campus itself: how much biodiversity manages to survive in between the buildings?
There are, however, two good reasons to go out into the field now. The first one is a very pragmatic one – I have a bunch of student interns for a short period of time that should do some fieldwork for their project.
The second one is a scientific one, though: we are interested not only in the spatial scale at which biodiversity varies, but also in the temporal scale: how much variation do you see in the same plot throughout the year and between years? How often should you monitor a plot to actually find all the species? What’s the period of highest diversity in a plot?
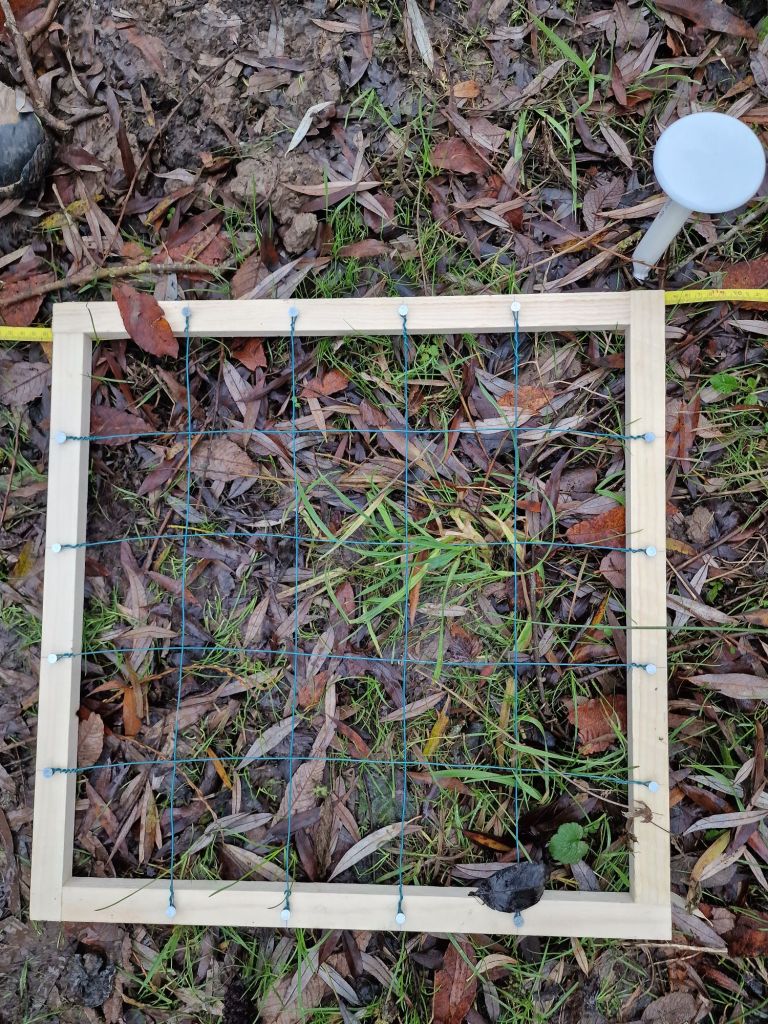
Biodiversity (and microclimate!) monitoring in the Netherlands during December may not be the most glamorous task, but what you see in the picture reflects the diversity we have—and that’s exactly why we monitor it!
Important questions with strong implications for the way we are tracking biodiversity changes, so you should be grateful for us braving the Dutch mud to find out!
One of the biggest dreams when we started the SoilTemp project was not only to bring together all available microclimate data into a single, unified database but also to align how we think about and measure microclimate. Today, we are excited to share a major step toward achieving that goal: our new paper, “Ten practical guidelines for microclimate research in terrestrial ecosystems“, is now published in Methods in Ecology and Evolution.
This paper provides exactly what every graduate student and researcher in ecology and biogeography has been waiting for: a comprehensive guide on everything you need to consider when integrating microclimate monitoring into your research. From defining why you need microclimate data, to determining what and where to measure, and deciding on how and when to collect your data, this paper has it all. It doesn’t stop there either: it also walks you through compiling, analyzing, and publishing your microclimate data in ways that maximize impact and accessibility.
The why, what, how, when and where of microclimate monitoring, as well as site-specific characteristics to think about. A series of questions everyone has to go through when designing the microclimate component of their study, and the paper walks you through each and every one of them.
It’s quite the giant of a paper as well, trying to go sufficiently in depth with all these aspects of the question to have practical relevance, and to really put you on the road to a successful microclimate project.
Microclimate research is of course not done once the data comes in. Part two of the paper guides you through your selection of reference data, how to compile your microclimate time series, the basics of microclimate data analysis and the publication of your data open access and, of course, into the SoilTemp database!
Where to measure?
One of my favorite parts of the paper – to name just one – focuses on where to measure microclimate. This section emphasizes the importance of matching spatial resolution and extent to the scale at which your study organisms experience their environment. It highlights the nested, hierarchical nature of microclimates: locally measured conditions (temperature, moisture, wind) are shaped by a combination of local, regional, and global climatic signals.
The nested nature of microclimates. Locally measured microclimate (e.g. temperature, moisture, wind) always represents a combination of local, regional and global climate signals. At each scale from macro to micro, climatic gradients can be unfolded, just like replicated geometric shapes in a fractal.
That chapter explores the concept of proximal microclimate, which refers to how closely microclimate measurements represent the actual conditions experienced by organisms. Proximal microclimate goes beyond simply placing sensors: it considers both the spatial and temporal alignment of measurements with biological processes. By addressing this, researchers can better connect microclimate data to ecological responses.
Additionally, we introduce practical approaches like stratified random sampling to select logger locations. This technique helps ensure that you capture as much environmental variation as possible, maximizing the value and representativeness of your dataset.
No ‘one-size-fits-all’ solution—and that’s okay!
Importantly, the paper doesn’t promise a single ‘golden rule’ to every microclimate monitoring challenge. There’s no universal sensor, setup, or methodology that works for all studies—and that’s because each research question is unique. What the paper does offer is a clear framework to help you identify the best strategy for your specific case, taking into account the unique characteristics of your study system.
Building on the latest advances in microclimate research
In addition to its practical advice, the paper builds on the latest advances in microclimate science, making it an invaluable resource for both beginners and experts. It not only provides you with step-by-step guidance but also connects you to a carefully curated list of must-read references in the field.
As you can expect, we are incredibly excited about this paper finally seeing the light of day, and hope it will inspire and support researchers around the world in designing successful microclimate studies.
Key takeaway: Microclimate research is a complex but essential part of understanding terrestrial ecosystems. With these ten practical guidelines, you’ll be better equipped to design, execute, and share impactful microclimate research—and maybe even contribute your data to the SoilTemp database!
Check out this inspiring and creative video by our ecology students at Utrecht University! Combining humor, innovation, and scientific depth, they shine a spotlight on an urgent global issue: drought and its devastating impact on ecosystems, livelihoods, and the climate. Most importantly, they explore how nature itself can play a pivotal role in the solution
This project marks my first experience supporting students in this particular science communication exercise, and I couldn’t be prouder of their work. They’ve transformed complex ecological concepts—like the biotic pump theory and precipitation corridors—into an engaging, accessible, and thought-provoking story.
First time for me supporting students in this science communication exercise, and I found it quite refreshing. It’s a fun way to dive deep into a topic and find a way to communicate scientific complexities to a broad audience.
🌍 Why does it matter? Forests are more than just carbon sinks; they are powerful drivers of the hydrological cycle, influencing rainfall patterns even far from coasts. Deforestation and drought amplify climate change effects, from biodiversity loss to increased wildfire risks. Strategic reforestation and conservation efforts could unlock nature’s ability to cool the planet and sustain life, offering hope for a more resilient future.
Young bluebell (Hyacinthoides non-scripta) surrounded by flowers of yellow archangel (Lamium galeobdolon)
The common bluebell (Hyacinthoides non-scripta), the signature flower of the Hallerbos
Single bluebell flower surviving on a wetter spot, as indicated by the field of wild garlic (Allium ursinum)
A really wet patch of forest, with giant horsetail (Equisetum telmateia) in a field of wild garlic (Allium ursinum)
Wild garlic (Allium ursinum) in the Hallerbos flowers a bit later than the bluebells, yet this one was already in full bloom
A bumblebee visiting yellow archangel (Lamium galeobdolon)
A bumblebee visiting yellow archangel (Lamium galeobdolon)
Wild garlic (Allium ursinum)
Wild garlic (Allium ursinum)
Weirdly beautiful, the inflorescence of pendulous sedge (Carex pendula), typical for the wettest spots in the forest
Weirdly beautiful, the inflorescence of pendulous sedge (Carex pendula), typical for the wettest spots in the forest
A little stream in the Hallerbos, surrounded by endless fields of wild garlic (Allium ursinum)
The herb-paris (Paris quadrifolia), less common in the forest
Wild garlic (Allium ursinum)
Bluebells (Hyacinthoides non-scripta)
Weirdly beautiful, the inflorescence of pendulous sedge (Carex pendula), typical for the wettest spots in the forest
Another one from the wet plots: large bitter-cress (Cardamine amara)
Another one from the wet plots: large bitter-cress (Cardamine amara)
Young beech leaves, as soon as they are fully grown, spring in the understory is over
A beech forest without understory, most likely too dry and too acid for any survivors
A young beech seedling (Fagus sylvatica), looking nothing like a beech, yet everything like a tiny dancer
Young beech seedling (Fagus sylvatica)
Bluebells (Hyacinthoides non-scripta)
Bluebells (Hyacinthoides non-scripta)
Bluebells (Hyacinthoides non-scripta)
Mountain melick (Melica nutans), a grass in the most amazing green
Bluebells (Hyacinthoides non-scripta) in a rare patch of mountain melick (Melica nutans), a grass in the most amazing green
Bluebells (Hyacinthoides non-scripta)
Bluebells (Hyacinthoides non-scripta)
Montpellier 2017
The entrance to the cathedral of Montpellier
The cathedral of Montpellier
The entrance to the cathedral of Montpellier
The cathedral of Montpellier
Narcissus poetics
The cathedral of Montpellier
The botanical garden of Montpellier
The botanical garden of Montpellier
The botanical garden of Montpellier
Brackish Camargue vegetation
Brackish Camargue vegetation
Brackish Camargue vegetation
A typical lagune
Brackish Camargue vegetation
Camargue horses
Camargue horses
Camargue horses
Brackish Camargue vegetation
Brackish Camargue vegetation
Brackish Camargue vegetation
Camargue horses
Brackish Camargue vegetation
Little egret in the evening sun
Flamingo’s in the evening sun
A typical lagune
Dandelion fuzz
Grass lily
Grass lily
Dandelion fuzz
Veronica in a sea of poplar fluff
Euphorbia in a sea of poplar fluff
Poplar
Gare du Midi, Brussels
Gare du Midi, Brussels
Gare du Midi, Brussels
Gare du Midi, Brussels
Sweden autumn 2016
Autumn in Abisko
Yellow leaves of mountain birch, with lake Torneträsk in the background.
Lapporten, the gate to Lapland, in Abisko
Rain blowing over the Abisko National Park
The colours of the north: red fireweed and yellow mountain birches, with lake Torneträsk on the background
Yellow leaves of mountain birch, with lake Torneträsk in the background.
Rain on the background, the ski lift in Abisko on the foreground
The steep slope of mount Nuolja on a dramatic looking morning
The beautiful colors of lake Torneträsk in Abisko
A little stream on top of the mountain, with a view on Lapporten, the gate to Lapland
Well, that is a beautiful table with a nice view on lake Torneträsk in Abisko
Our little experiment on top of the mountain in Abisko, with a view on Lapporten
Autumn in Abisko is extremely colorfull
The ski lift with a view on Abisko National Park and Lapporten
Hiking dowhill towards lake Torneträsk
This green is greener than the greenest green: moss on top of mount Nuolja
Well, that is a beautiful table with a nice view on lake Torneträsk in Abisko
The ski lift with a view on Abisko National Park and Lapporten
The ski lift with a view on Abisko National Park and Lapporten
The most beautiful hiking trail of the world: Nuolja in Abisko
Angelica archangelica, often the biggest plant of the Arctic
The most beautiful hiking trail of the world: Nuolja in Abisko
Cirsium helenioides, the melancholy thistle
Hiking down mount Nuolja
The steep slope of mount Nuolja on a dramatic looking morning
The colours of the north: red fireweed and yellow mountain birches, with lake Torneträsk on the background
The prettiest yellow and blue: autumn in Abisko
Fireweed, Epilobium angustifolium
Campanula or bellflower, I think ‘uniflora’
Vaccinium myrtillus
Cornus suecica, the prettiest red of the world
Hieracium alpinum, alpine hawkweed
Carex atrata, one of my favourite sedges
Alpine clubmoss, Diphasiastrum alpinum
Agrostis capillaris, bentgrass
Common yarrow (Achillea millefolium)
Anthoxanthum odoratum, sweet vernal grass, fully grown and mature
Snow scooter trail
Our plot in the mids of a field of horsetails (Equisetum pratense)
Equisetum pratense
Cliff overlooking the valley with the road to Norway
Seedling of Taraxacum officinale, the dandelion, after two years of growing in bad conditions
Poa alpina, the alpine meadow-grass, with its viviparous seeds
Massive flowerhead of Angelica archangelica
Angelica archangelica
Blueberry (Vaccinium myrtillus) in autumn
A lowland marsh in Abisko in autumn
Installing the plots of our trail observations on top of mount Nuolja
Installing the plots of our trail observations on top of mount Nuolja
Tanacetum vulgare (Tansy), non-native for the high north
Autumn forest down in the valley
The valley of Nuolja to Björkliden
Summer on the Nuolja-side
A full rainbow behind mount Nuolja in Abisko
It’s raining in the west, clouds trapped behind the mountains
A strong wind blowing rain from behind the mountains to our side
A strong wind blowing rain from behind the mountains to our side
Betula nana, the dwarf birch, mini autumn forest
Betula nana, the dwarf birch, mini autumn forest
The valley of Björkliden in autumn
The valley of Björkliden in autumn
The valley of Björkliden in autumn
The valley of Björkliden in autumn
Sweden spring 2016
Overlooking the valley of Laktajakka
Silene acaulis
Ranunculus glacialis
Cornus suecica
Bartsia alpina
A rainy hike
Dryas octopetala
Although the alpine zone has been harder for invasives to access than most places, human structures like trails are often an easy gateway for the invaders to get up there. Picture from Abisko, Swedish Lapland.
Oxyria digyna
Trifolium pratense
The valley of the lakes
Western European species like the red clover (Trifolium pratense) here are often listed as non-native species in mountain regions.
Eriophorum vaginatum
Trifolium repens
Rubus arcticus
Ranunculus glacialis
Melting snowpatch on a lake
Silene suecica
Salix reticulata
Amiens
Nice architectural curve
View from my office window
Winter sun on the Place du Don
Gargoyle planning to eat the cathedral
Just outside of Amiens
Cathedral at night
The museum behind the beautiful gates
Enjoying silence and the morning sun
Cathedral at night
Sunny but cold, the Quai Bélu
Amiens is filled with cute little houses
Frozen mirror
House on the square before the cathedral
Sunny but cold, the Quai Bélu
Cathedral with a glimpse of spring
View from my office window
Sun rising above the water
Cold!
Frozen to the bone
Le Club d’Aviron in winter weather
The southern side
Cathedral seen from the frozen Parc Saint-Pierre
Almost cold enough for ice-skating
Cathedral at night
Colourful mirror
Maria without a shirt
Cathedral at night
Sweden autumn 2015
Lichen
Sweden summer 2015
View on the 1000 meter plots
Doing research on a cold Arctic morning
Plots flooded by the snowmelt
Flooded by the snowmelt
Meltwater river, racing down the mountain
After a hike, even the most basic house looks cosy. Little hut in the mountains, open for everybody
Snowbridge, maybe don’t cross…
Snowbridge
View from a cliff
Silene acaulis or cushion pink, cutest plant of the Arctic
Two seasons in one image
Steep slope
Hiking down
Narvik Kirche, church of the subarctic
Narvik Kirche
Reindeer on top of the mountain
Narvik Kirche
Summer at the church
Summer flowers
Massive waterfall
Young willow catkins
View from Narvik’s hospital, with lilac flowers
Building a bridge over the fjord will gain al drivers at least an hour
Norwegian fjord
Posing with the water, getting soaked
Minimalistic mountains
Insect investigating our reindeer antler
Catching mosquitoes with our license plate, harvest of the year!
Posing with the plot
Fieldwork on the most beautiful spot of the world
Fieldwork on the most beautiful spot of the world
Summer bridge – still next to the sadly impassable river
Rhinanthus flower in the mountains
Plateau in the valley, beautiful brown
Experimental view from my favourite plot
Salix catkins
Extremely old Betula tree
Waterfall from a cliff
Buttercup is the earliest in spring, here
Rocks!
Alpine views
Views!
Fieldwork
Jumping over rivers
Plot
Golden plover
Angry lemming
Green, the whole north is green!
Snow, so much snow left!
Minimalistic mountain moments
Fieldwork
The research center
Red clover – focal invader
Look at this tiny cute snail!
Massive floods of melting water
Bartsia alpina
Hooray, a toilet!
Dryas octopetala
Lowest elevation plots
Butterball!
That’s a lot of water
Midnight sun is the best
At the lakeside
Beautiful Bistorta vivipara
Don’t fall in the water
Midnight sun
Wild river
Art – made by ages of wild rivers
Baby firework for America’s independence day
Midnight sun at the lake
The Abisko canyon was wilder than ever
That’s a crazy amount of water!
The Abisko canyon was wilder than ever
The Abisko canyon was wilder than ever
Black and white
Stone-man overlooking Abisko
Nothing as soft as a willow catkin
Label and soil temperature sensor attached
I’d drive to the top every day
Reflections
Rocks and clouds
Brave little birch
Brewing our camping poison
Basic camping stuff
Camping in Norway
Home-made temperature houses
Roadside research at its best
Norway is crazy
Horsetail is so funny
Little creek in magical forest
Birches, birches everywhere
Beautiful rock, a gift from the river
Another roadside fellow
Lichen
Ready to rock the summer
Collecting mosses
That’s a crazy old lichen
Tiny tiny piny trees, but old, so old!
Ready to jump into the fjord?
Ready to jump into the fjord?
That’s a spiky stone!
Views on Norwegian fjords
Silene in the mountains
Cute little orchid
Skua
Attacking skua, mind your heads!
Watch out for the attack of the fierce skua!
Black snail
New plot!
Still a lot of snow to melt, but this spot was free for a new plot
Reindeer are better than people
Two seasons in one picture
Let’s see what is happening to the balance in mountains! Is this a starting avalanche, or will it last a bit longer?
Cute little hut
Climbing mountains by car
Softest moss in history
Drosera in the marsh
Hiking in no-man’s land
The clouds are coming
Abisko valley
‘Butterball’
Fieldwork in the tundra
Abisko valley
Little plot
Clouds and sun and mountains
Making soup on a campfire with a view
Little creek on high elevations
Skua on the look-out
Melting snow in a river
Rhodiola rosea and the Törnetrask lake
Beginning of spring
Flooded plots, melting snow, impassible wetness
Ferns and horsetails
Chile 2015
Trips to the field sites were sometimes a real adventure, especially right after snowmelt
Lunch made by our local colleague, with funny bread (tasty as well!)


")


")
")


")


")

")


")


")


