The holy trinity of global change ecology

33171015398_c1b808ff6b_o

A few weeks ago, the journal Annals of Botany asked me to write a commentary pieceon a new paper coming out on the effect of climate change on grass species on a subantarctic island. An intriguing paper, as they compared the response of native and non-native grasses to climate warming, a thread that we see rapidly unfolding in front of our eyes, especially in such cold environments.

Their findings? The species with the greatest rate of spread over the last decades – the non-native, warm-adapted newcomers – showed much higher adaptability to cimate change than their native counterparts.

What I found most interesting about this study – and what triggered me to write this Commentary piece – is that it elegantly highlights the new ways in which we will have to do ecology from now into the future, a new way that pivots around what I would like to call ‘the holy trinity of spatial climate change ecology’. This ‘holy trinity’ is the type of data that we need to tackle this rapidly accelerating problem, before it is too late: 1) high-resolution environmental data, 2) long-term biodiversity monitoring and 3) physiological experiments.

40081535343_57fda61861_o

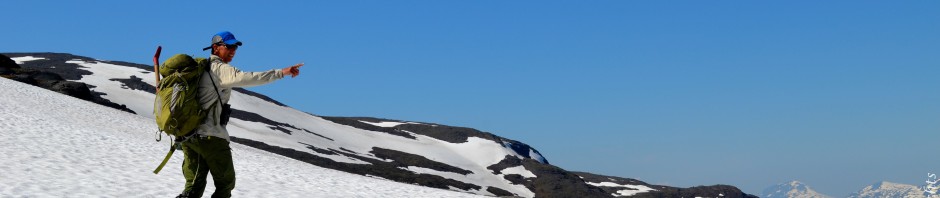
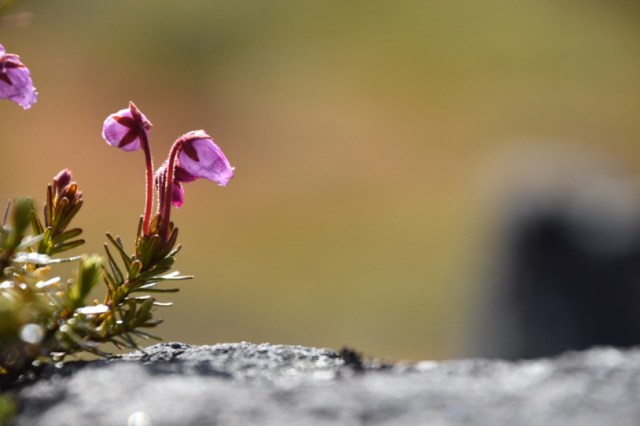
Vegetation monitoring in extreme environments – here in a volcanic landscape at high elevations in the Andes

In this commentary paper, I argue that, when collected in tandem, on large scales, at high resolutions and in interaction with each other, these three data types can provide the critical baseline data to answer questions on why species are moving and adapting, and predict their fate in a rapidly changing future. And while all three are advancing rapidly in these times, it is in their interaction that most merit can be found.

Figure AoB

The holy trinity of spatial climate change ecology: if we have 1) high-resolution climate data (both in space and over time), 2) long-term species distribution surveys and ideally 3) the actual performance of the organism as a function of the climate, we can model their distribution in past, present and future.

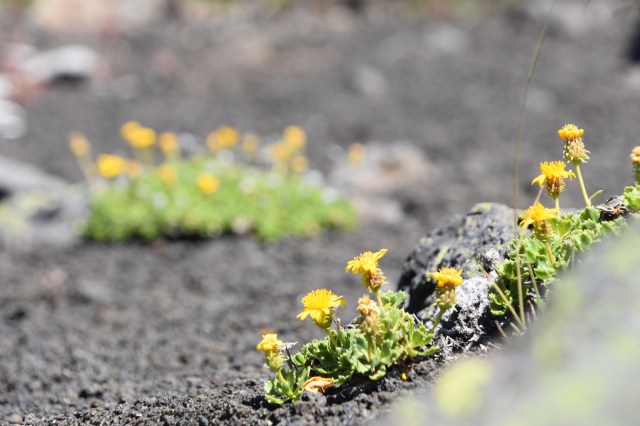
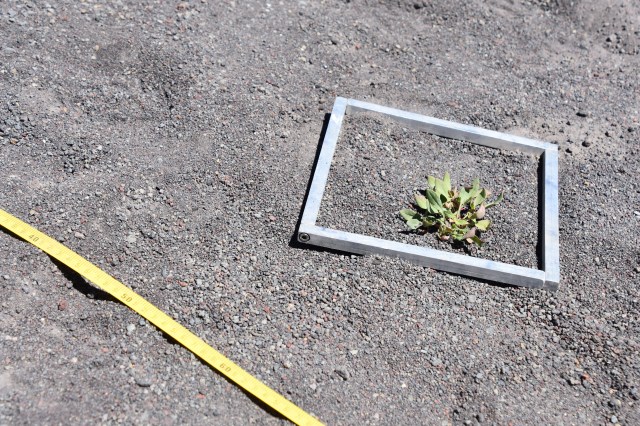
Indeed, as biodiversity starts to react more and more to these accelerating climate changes, we need long-term biodiversity data, linked with high-resolution climate data from there where it matters for the organisms. Strengthening them even further with physiological experiments on how these organisms actually react to said climate, allows stepping away from correlative models only and build those models on known mechanisms. The latter can give those future predictions the extra credibility they need.

It is thus the integration of these three data types that will allow climate change ecology to move forward. And that is exactly  what we should be aiming for, if we want to tackle the complex and multi-dimensional issues of biodiversity conversation under accelerating global change, as the rate of change demands rapid understanding of and action on species (re)distributions.

32118592847_be96b471f0_o

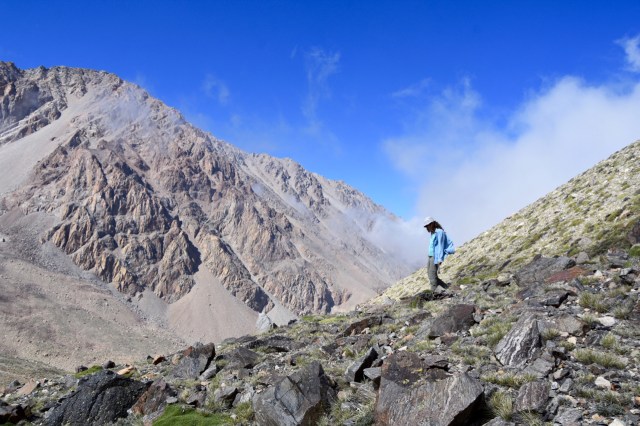
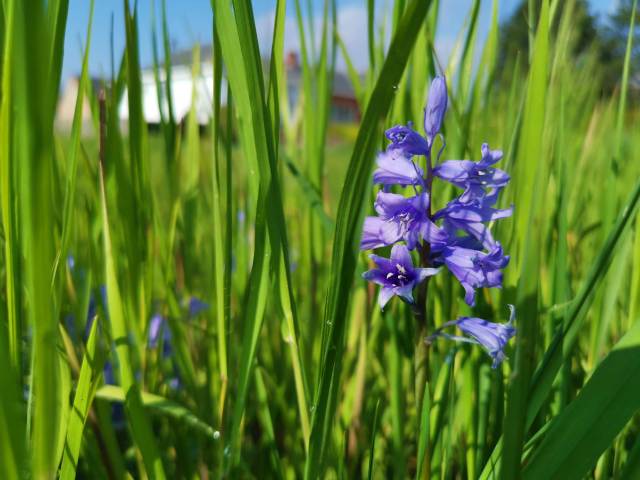
Ecological fieldwork in the dry Andes, Argentina

Further reading

Lembrechts JJ, The Holy Trinity of spatial climate change ecology: high-resolution climate data, long-term biodiversity monitoring and physiological experiments. A commentary on: ‘Invasive grasses of sub-Antarctic Marion Island respond to increasing temperatures at the expense of chilling tolerance’, Annals of Botany, Volume 125, Issue 5, 8 April 2020, Pages ix–x, https://doi.org/10.1093/aob/mcaa057

Posted in General, Science | Tagged , , , , , , , , | 2 Comments

Same data – different analysts

So here is an important question: if you give the same dataset to different scientists, will the outcomes be the same?

This question is not trivial. It’s actually one of the most important assumptions in the way we currently do science, and thus the base of so much of our knowledge: any decent analysis is going to uncover the truths hiding in a dataset, whoever looked at it first.

However, this critical assumption is rarely tested, so we pretty much don’t know if this assumption actually holds! Let’s solve that, shall we? So I stumbled upon this fantastic initiative from Hannah Fraser and others (here) aimed at filling that void in our knowledge. Their plan is as simple as it is brilliant: just give exactly the same dataset to ecologists from all over the world, let them all analyse it as they would do for their own papers, and carefully compare the outcomes.

See, this is the kind of science that gets me excited: building on global collaboration, challenging the foundations of our scientific understanding, and building towards a better science in the future. So obviously we are playing along.

Hallerbos - 11

Our experimental questions will deal with how grass cover influences Eucalyptus seedling recruitment (yes, I have no relevant pictures for that, I have never been to Australia, but that doesn’t mean we can’t analyze the data!)

What is even better about this initiative, is the fact that we can make this a team excercise! We can bring our Virtual Lab together and all work as a team on a shared research question. It is the perfect opportunity to organize that ‘practical statistics and paper writing course’ that students often crave for in their masters or early PhD: get a dataset, and work your way through the whole process of analyzing and writing up the results, without the extra pressure you get when it is your thesis work and you are the lea author. Learning from each other, taking along the new students and having the established one lead the way. This is what our Virtual Lab was waiting for!

So let’s see where this brings us. We are looking forward to do this teambuilding excercise, and in the meantime contribute important knowledge to the scientific community. We’ll keep you posted…

Posted in General, Science | Tagged , , , , , , , | Leave a comment

SoilTemp: a database of near-surface temperatures

Let me tell you something important – which won’t be a surprise to regular followers of this blog: weather station data doesn’t do the trick for ecologists. It is just too different from the climate as experienced by most organisms, and relates to it in non-linear ways.

Yet, and that is the most important part, we made a huge step forward to solve that mismatch! We published the concept of our SoilTemp-database just now in Global Change Biology, introducing our ambitious plan to the scientific community and calling on all who want to listen to submit their microclimate data to our growing database (yes, that’s you as well! Do you have microclimate measurements? Then get in touch! More on our website).

And growing it does!

Graphical abstract

Overview figure of the database at the moment of paper acceptance (as it keeps growing!): a) shows the geographical spread of the 7538 (!) loggers from 51 (!!) countries we already have processed, while b) gives the spread in the worlds’ climatic space (the blue smear in the background indicates all types of combinations of temperature and precipitation that exist in the world, and we are covering quite a bunch of them).

The paper also explains why it is that this microclimate is so different from the macroclimate as interpolated from weather stations. In short, there is two things that together constitute that offset between micro- and macroclimate:  horizontal and vertical features.

Figure 1

The difference between coarse-grained free-air temperature and fine-grained soil temperature is driven by horizontal andvertical features. 

The horizontal features relate to the spatial resolution of the climatic data. They include features at a specific site (like effects of slope and aspect on local radiation balances, with south-facing slopes much warmer than their north-facing counterparts), and those where temperatures are also affected by neighboring locations (like topographic shading, cold-air drainage and atmospheric temperature inversions, which are landscape context dependent).

Picture1

With horizontal features we capture the temperature differences between the left and right side of this picture, where local temperatures are driven by a difference in solar radiation input on a cold winter morning

The vertical features are what drives the difference between air and soil temperature and include the effects of vegetation characteristics (e.g. structure and cover), snow cover and soil characteristics (like moisture content, geological types, and soil texture). They cause an instantaneous temperature offset between air and soil temperatures, but also a buffering effect, i.e. the temporal variability in temperature changes is lower in the soil than in the air.

scandinavia-10

Vertical features involve those explaining why temperatures close to the soil are so different from those at the height of weather stations

It is the role of these two types of features that we hope to disentangle using our global database initiative. If we succeed, we will finally have the correct global climate data at hand to tackle the biodiversity and ecosystem crisis we are facing. And succeeding we will, just look at the fantastic list of co-authors on this first paper, showing the enthusiasm from all over the world for this question.

We’ll keep working frantically now, bringing together even more people from all over the world (our author list of the ‘real deal’ papers will hopefully be even longer!), and working towards tackling these questions. You bet you will hear more from us soon!


Further reading:

Lembrechts JJ et al. (2020). SoilTemp: a global database of near-surface temperatures. Global Change Biology. https://doi.org/10.1111/gcb.15123. 

Posted in General, Science | Tagged , , , , , , | Leave a comment

Bluebell beauty

This would normally be the season where we take the students to the beautiful Hallerbos, close to Brussels, to teach them all about forest types and keystone plant species. This trip would importantly also involve stunning purple fields of bluebells all the way to the horizons.

None of that this year, though.

IMG_20200418_163948

Bluebells popping up in an abandoned meadow close to my home

So this year, I’ll have to do with those few scattered bluebells popping up in the woods and fields close to my home, and the pictures and memories from last year’s course. The students – even worse – will have to do with a theoretical course on forest types.

bluebells-hallerbos-47

Acer pseudoplatanus, the sycamore maple

For those finding that notion of missed nature opportunities a tad sad, I’m happy to take you back on a trip down memory line with some pictures of this amazing forest.

Hallerbos - 12

For more pictures, check out all ‘bluebell’-related posts on here!

Hallerbos - 4

Hallerbos - 7

Allium ursinum, wild garlic

Hallerbos - 8

Fagus sylvatica, beech

Posted in Belgium, General | Tagged , , , , , , , , , | 2 Comments

The coronavirus microclimate

For us scientists, it is tempting to throw our expertise into the fight against COVID-19. For spatial ecologists, this often means: predicting the risk of spread of the virus based on species distribution models, trying to identify its climatic niche – and thus where it is likely to show up as the season develops. After all, we have heaps of papers proving the validity of our modelling approaches for a whole range of species (and many diseases do indeed have a biogeography). This has already resulted in a myriad of preprints linking the spread of COVID-19 to climate, as summarized here.

Unfortunately, our ecological modelling techniques might not be sufficient in this case, for a variety of reasons. Many of these reasons are neatly summarized in the fantastic work from Chipperfield et al. , including the facts that 1) the distribution data for the virus is uncertain at best and highly biased at worst, due to undertesting, and 2) that the virus is far from its (climatic) equilibrium. These models might thus not only be unhelpful, but also perhaps counter-productive (think about the hopes that warm spring weather will easily get rid of the virus).

There is one problem with these models that I would like to stress a bit more, based on my own experiences as a microclimate ecologists: the climate we have at hand to model the distribution of the virus is just plain wrong. The coronavirus does not have much of a link with longterm averages in free-air temperatures measured by weather stations, and will thus not behave accordingly. We have been hammering on this nail for years now for a variety of organisms, like tundra plants (Lembrechts et al. 2019) and soil microbes (Lembrechts et al. 2020).

The problems might be even more acute for a virus than for these organisms, and they boil down to this: the spatiotemporal scale at which the organism operates, is so different from the climate data we have at hand, that there are likely several degrees of mismatch between the climate we use to model, and the climate as experienced by the organism.

It will likely not help to switch from long-term averages to current weather data, although that does take away the error caused by the fact that spring might have been much warmer  this year than the average in many parts of the northern hemisphere. It will also not suffice to take into account urban heat island effects, even though the virus is spreading fastest in cities – which are indeed warmer than the average climate predicted by weather stations. The main issue lies in the fact that the coronavirus spends so little of its ‘lifetime’ in free-air: a lot of its time is spend either in human bodies, or indoors (where most of the transmissions take place) and on objects (gloves and mond masks, to name a few). None of these ‘habitats’ has temperatures only remotely near to what a weather station would give. Only for free-air transmission, this might be the case.

And this is an important note: humans are actively trying to make microclimates in their habitats – the indoor world – as comparable as possible across the whole world. We are warming our houses there where it’s cold, and cooling them where climate is warming. The effective result is a globally homogenised climate that is much more similar between human habitats across the globe than between these habitats and the weather stations closed to them.

So let that be a take-home message: modelling and predicting the climatic niche of any organism is tremenduously tricky, as long as we do not have the actual climate it experiences. This means that for so many organisms, we are far from ready to accurately predict their future distributions. And the coronavirus is just one example.

Posted in General, Science | Tagged , , , , | Leave a comment

KittenR

Remember my post from early 2019, where I put my R-skills to good use for society? The idea was to visualise the number of kittens in our local animal shelter throughout the season to get an idea of when the peaks could be expected.

92830425_251563646239544_4897329028970577920_n

This has turned out to be a crucial excercise for the animal shelters and the foster families taking care of the kittens: they used it to await patiently the peak to come in spring, to ensure they stocked enough kitten milk and other amenities for when the peak would be there, and prepared them for the second peak, right when after summer everything seems to cool down.

Number of kittens per day 2018-2019

Number of kittens throughout the season in 2018 (black line) and 2019 (red line)

Yet one year of data is only that much. If we truly want to predict accurately how kitten numbers will evolve throughout the season, we’ll need to build a long-term monitoring scheme. As you can see in the graph, indeed, there were some surprises in 2019s’ red line: the peak came quite a bit later, with the mass of the kittens being dropped at the shelter only mid July, instead of mid June as in 2018.

92669858_243175170398395_1180306495259017216_n

Please love me!

Moreover – and that caused special burden on the animal shelter – the second (and third!) peak in autumn far exceeded those of 2018, with both in October and November more than 120 kittens at the same time sheltered in foster families.

92939473_153504759380529_5155133538969845760_n

We will keep monitoring what comes in and goes out this year, to add a third time series to our graph. The ultimate goal would be to come up with a predictive model of those peaks in the season. I have high hopes, for example, that warm weather in springtime will be a decent predictor of the number of kittens coming in two to three months later.

Foster kitten

But we should all know the dangers of correlative predictive modelling by now, especially for topics where we lack the expertise. Finding patterns is easy, deciphering the mechanisms behind them often needs four years of dedicated study. So, for now I’ll stick to my descriptive curves, and some broad generalisations.

But that limited expertise can tell you one more thing: with the ongoing social distancing, the peak in kittens will be severily delayed this year (as very few people will either find or save abandoned kittens), yet will hit us twice as hard after summer (when all abandoned kittens of the spring time will profit from the warm autumn weather to make new nests themselves).

Mark my words!

92922556_536588640386959_7403211024758734848_n

Posted in Belgium, General | Tagged , , , , , | Leave a comment