3DLab-member Charly Géron’s second paper recently got featured on www.eoswetenschap.eu! Here is an English translation of the story they brought there:
—-
Plants from warmer regions feel perfectly at home in our cities. From there, they can colonize the countryside.
Exotic animal and plant species that settle outside their natural range cause biodiversity loss. They can displace indigenous species. To be able to do tackle that issue, it is important that researchers gain insight into how this colonization process takes place.
For 24 exotic plant species that occur in Western Europe, scientists investigated from which climate zones they originated. They also looked at the habitats they tended to colonize in our country. This excercise showed that exotic species that are more often found in urban areas generally come from warmer and drier regions.
In cities it is often several degrees warmer than in the surrounding countryside. This is a result of the so-called heat island effect, caused by the large amounts of stone and concrete in the city. It is also often drier in cities because the large percentage of impervious surfaces prevent water from seeping into the ground. ‘This connection between urbanity and climate of origin is therefore not surprising, but it had never been thoroughly investigated before,’ explains ecologist and author Charly Géron (UAntwerpen and ULiège).
‘Cities can serve as an outpost from which exotic species can colonize other areas when it gets hotter and drier there as well,’ says Géron. ‘In addition to the direct negative impact of urbanization on nature, this favouring of non-native species provides an additional negative effect of cities.’ Better monitoring of which species are popping up in cities could help nip the advance of exotics in the bud at an early stage, the scientists suggest.
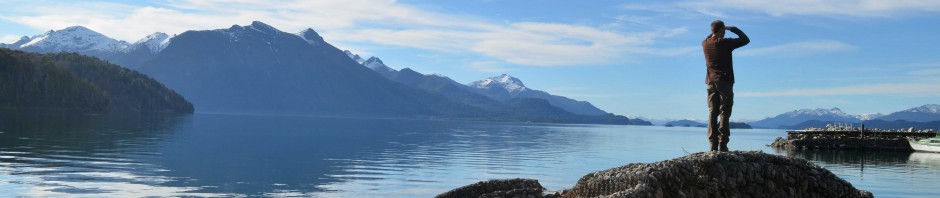
I just received the beautiful lake-view above and, oh boy, is that an important picture!
It means that we made it happen, despite the ongoing pandemic and the kilos of extra administrative chaos it brought with it: we sent a research team to Abisko, northern Sweden!
Today, the first two members of the team arrived, later this month four more will dare international travel. What can and cannot be achieved in the field will remain a mystery for a while (the main bottleneck will be crossing the border to Norway), but at least several of our ongoing and new research ideas will see fulfillment.
And the significance of that can simply not be overstated.
Hot summer day in the heathlands of Kalmthout, north of Antwerp, last week. With a team of two PhD students and four master students, we had a trial fieldwork day for this summer in northern Sweden.
Trying out vegetation surveys, preparing practicalities and looking at plants. 75% of species we saw in this Flemish heathland matched with those we find above the polar circle!
So ready to make this summer happen for the students, despite the tons of extra chaos due to Covid!
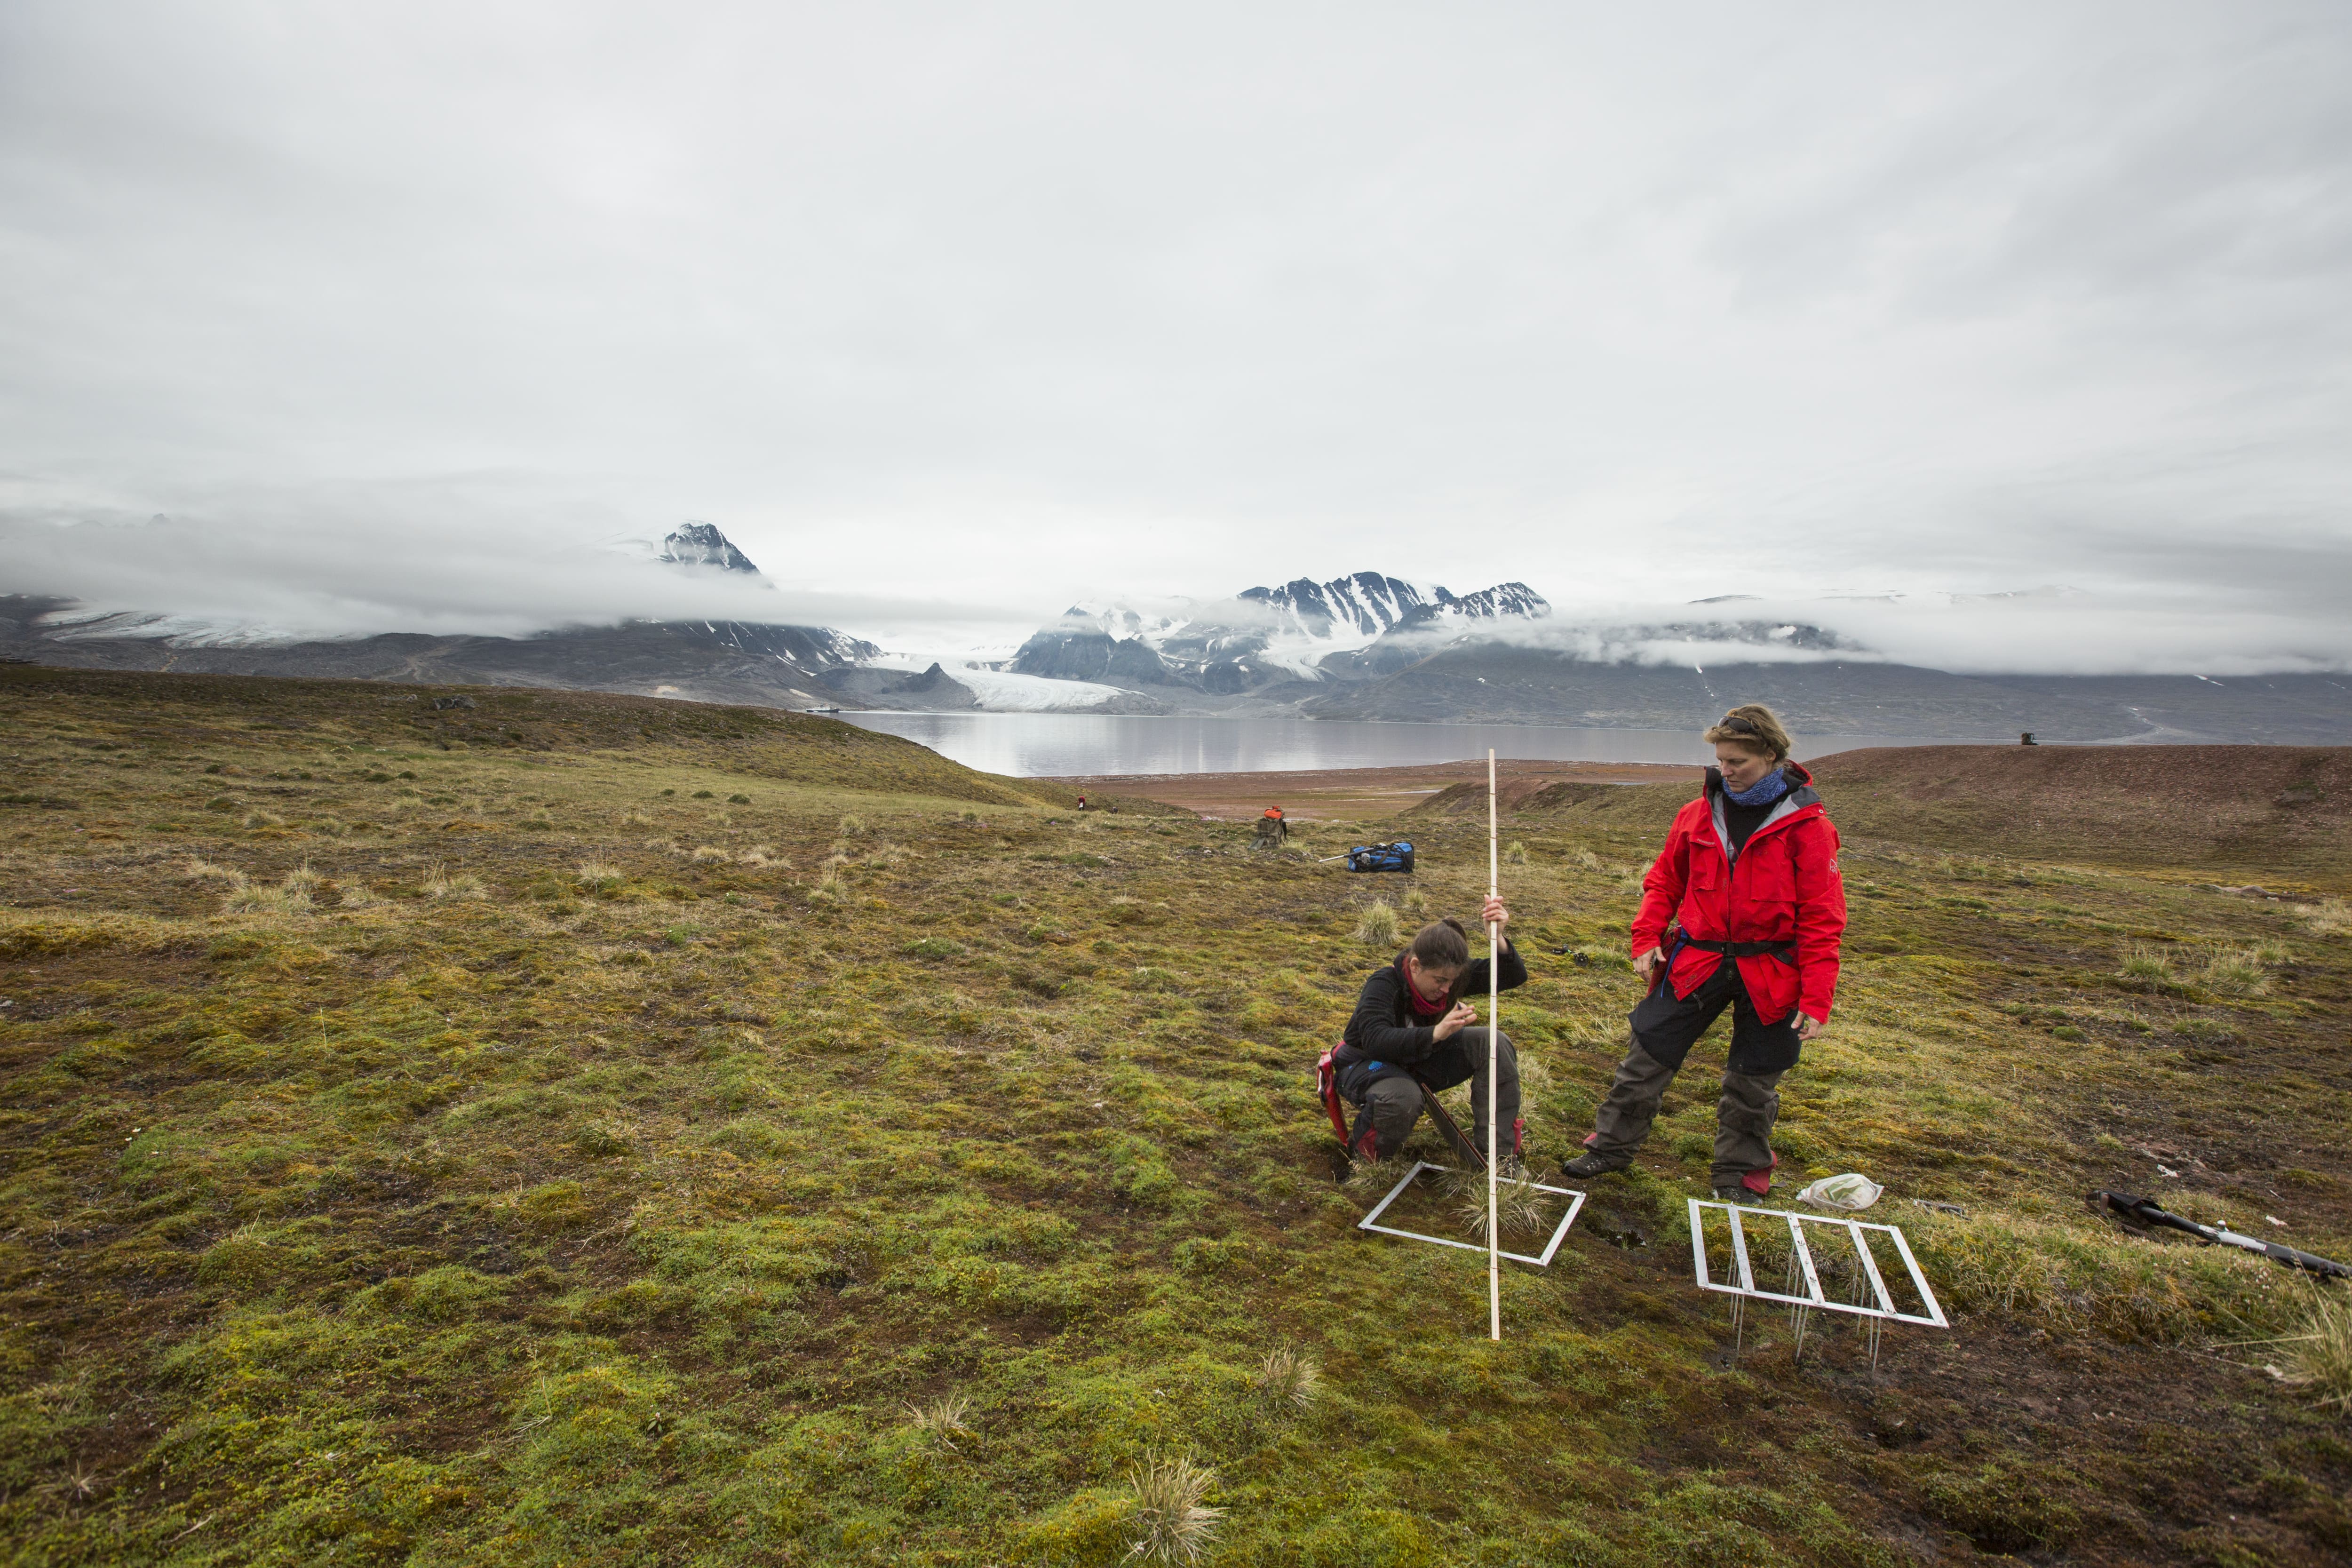
Whilst they do not hunt for extra-terrestrial aliens that may or may not be hidden under the ice (as some on the more unbridled sections of the internet would rather they did), hunting for terrestrial aliens is exactly what they do. Ronja Wedegärtner and Jesamine Bartlett recall their team’s expedition in the high-Arctic Svalbard to monitor alien flora and publish their latest research which presents the most complete survey of alien vascular species in the archipelago to date.
You can read their full story here. Special shout-out for this fantastic animated movie to explain the risks of bringing sneaky beasties to the Arctic!
According to the first results of our citizen science project ‘CurieuzeNeuzen in de Tuin’, lawns in urban gardens can also be quite cool. This came as a bit of a surprise.
[English summary based on today’s discussion of our results in De Standaard by Ine Renson]
Today, we are launching something amazing: the daily updated temperature maps of our 4400 temperature sensors in our citizen science network. These maps have been highly anticipated, as we all were wondering about the patterns that would show up on them. Most importantly, one thing we wanted to see: are garden soils in cities warmer than those in the countryside due to the heat island effect?
It turns out that they are not. The map of soil temperatures shows a fairly diffuse picture, where cities do not immediately stand out. This is perhaps different from what we expected to see, but it is precisely why it provides interesting insights.
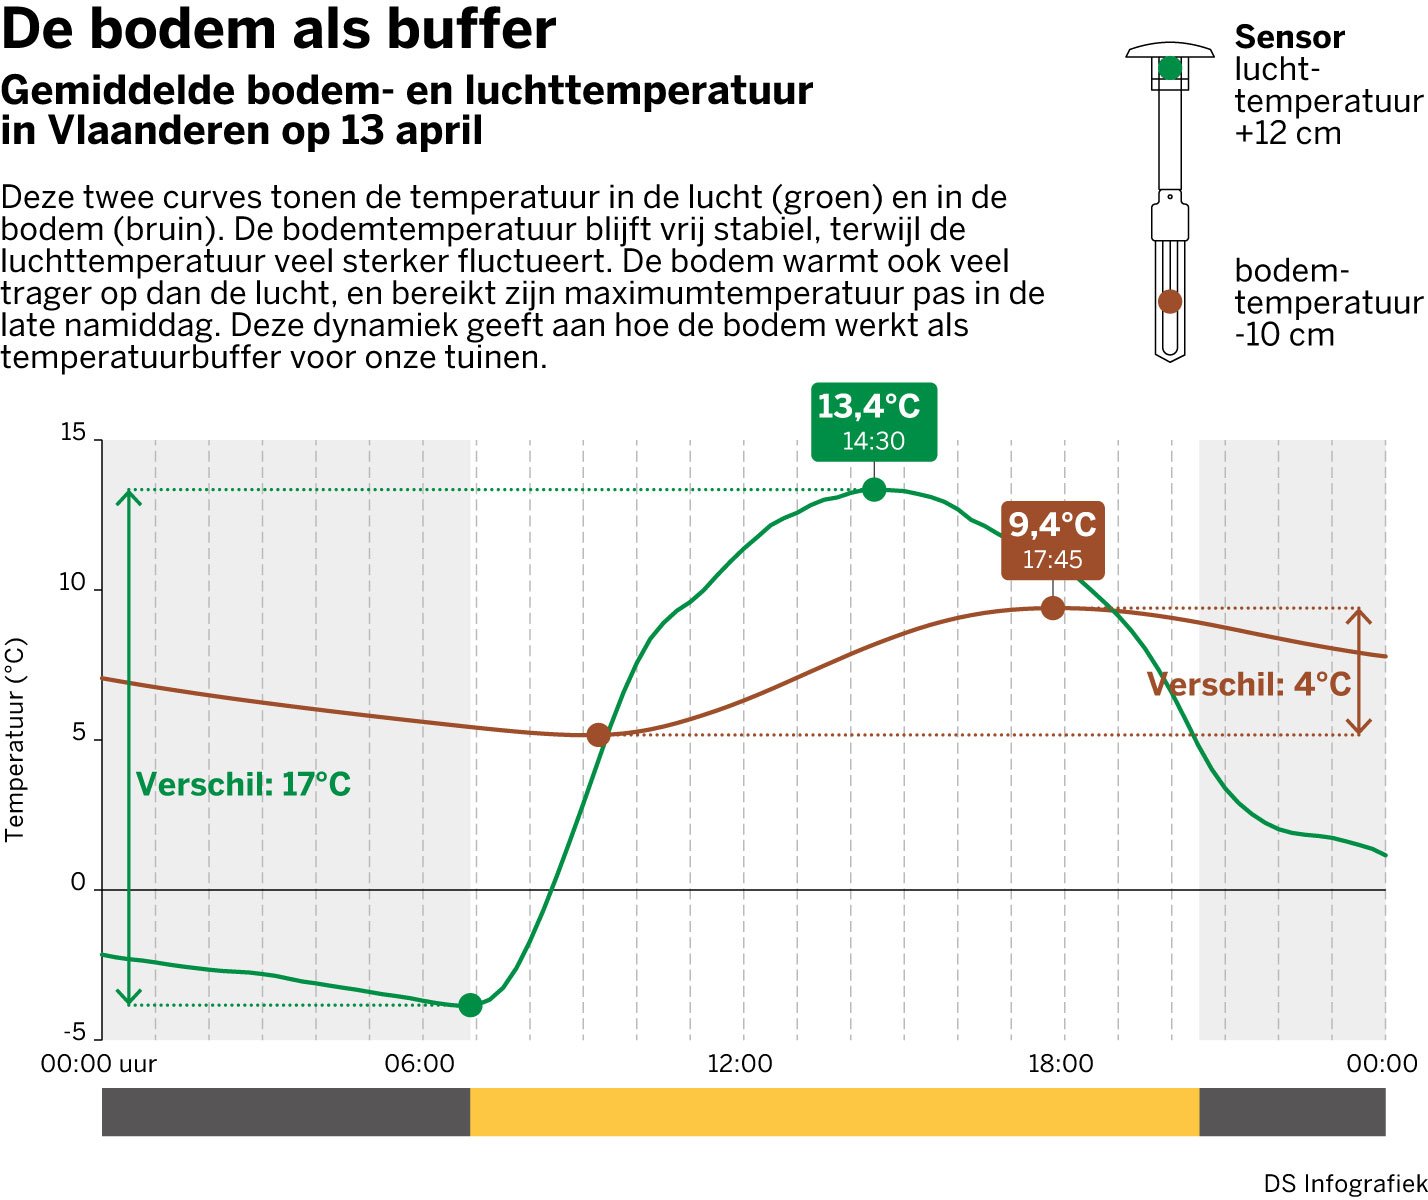
Our TOMST-built lawn daggers have three temperature sensors: one at a depth of 10 centimeters, one just at the ground surface and one at 12 centimeters above the ground. Those three curves show a different rhythm through the day. The air temperature at or just above the ground fluctuates strongly, while the soil temperature goes up and down in a gentle manner. So an earthworm feels a very different temperature than the one we experience ourselves in the garden.
Soil as a buffer: the average soil- and air temperature in Flemish lawns on April 13th. The two curves show the air temperature (green) and the soil temperature (brown). Soil Temperature remains rather stable, while air temperature fluctuates heavily. Soil warms much slower than the air, and reaches its maximum temperature late in the afternoon. Infographic as appeared in De Standaard newspaper.
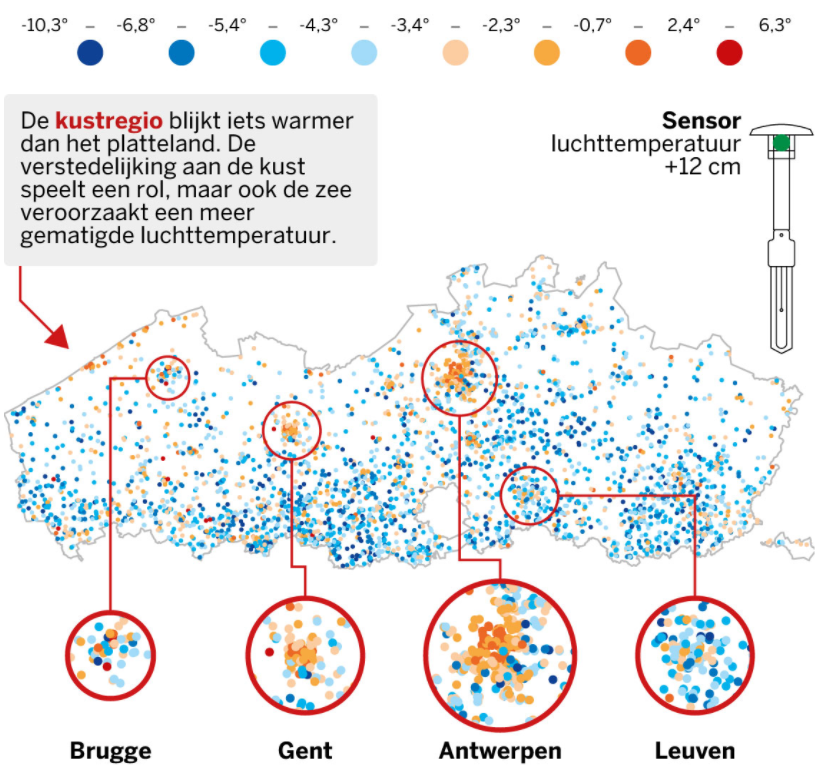
We see that the soil buffers the temperature fluctuations, and that this pattern occurs consistently in every garden in Flanders. Here, our gardens nicely follow the rules of the soil physics textbooks. But when we compare soil and air temperatures, we encounter a remarkable phenomenon. When we plot the nighttime minima of air temperature on a map, the cities clearly stand out (see map below). In the early morning, city gardens are clearly warmer than the surrounding countryside. On the map of maximum soil temperatures, the pattern is a lot more subtle. There you see a lot more local variation across the whole urban-rural gradient. Very interesting: you’ll find most of the warm gardens there in the city outskirts, so halfway the urban-rural gradient. From the soils’ point of view, urban gardens are not necessarily warmer than average.
Heat islands in the coldest nights. This map shows the minimum air temperature (12 cm height) on April 13th, and visualizes the ground frost in early morning. Cities immediately pop out as warmer, with differences across the region of up to 15°C (-10 to +5°C)! Infographic as appeared in De Standaard newspaper.
We believe this goes to the heart of how the heat island effect works. Structures like buildings and roads absorb a lot more heat, so the air temperature close to the ground heats up quickly. Wind and air currents cause that warm air to spread, even to places in the shade. So the city as a whole heats up. Much of that heat is re-emitted in the evening and retained between the buildings. That’s why the heat island effect in the city is so obvious at night.
In the soil, things are different. It absorbs heat by radiation from the sun, but that heat is not transmitted laterally as much as in the air. A soil that is covered with plants, and not asphalt or concrete, will heat up less. Also, a soil that is shaded by buildings or by trees and shrubs stays cooler The fact that cities don’t really stand out on the soil temperature map might thus be because city gardens are often smaller and therefore catch extra shade, highlighting the critical aspect of shade for cool garden microclimates, even in the heart of the city.
Ecologists nowadays are trying to get closer to measurements of the microclimate that organisms are actually experiencing. Weather stations are great, standardized sources of temperature data at 2 m in the air, yet organisms often relate more strongly to what happens much closer to the ground. This rapidly increasing interest in microclimate ecology is great and much needed, but sometimes it is important to take a step back and ask that one important question: how good are we actually now at measuring the temperatures that we care about?
Indeed, microclimate measurements are done with a wide range of temperature sensors and radiation shields, professionally-built or home-made creations, and we lacked a good insight in how different the results could be. The big question is: are the temperatures as these sensors measure them close to the temperature as a beetle would experience it at the same location? This is exactly what we set out to answer in a recently published paper in the journal Methods in Ecology and Evolution.
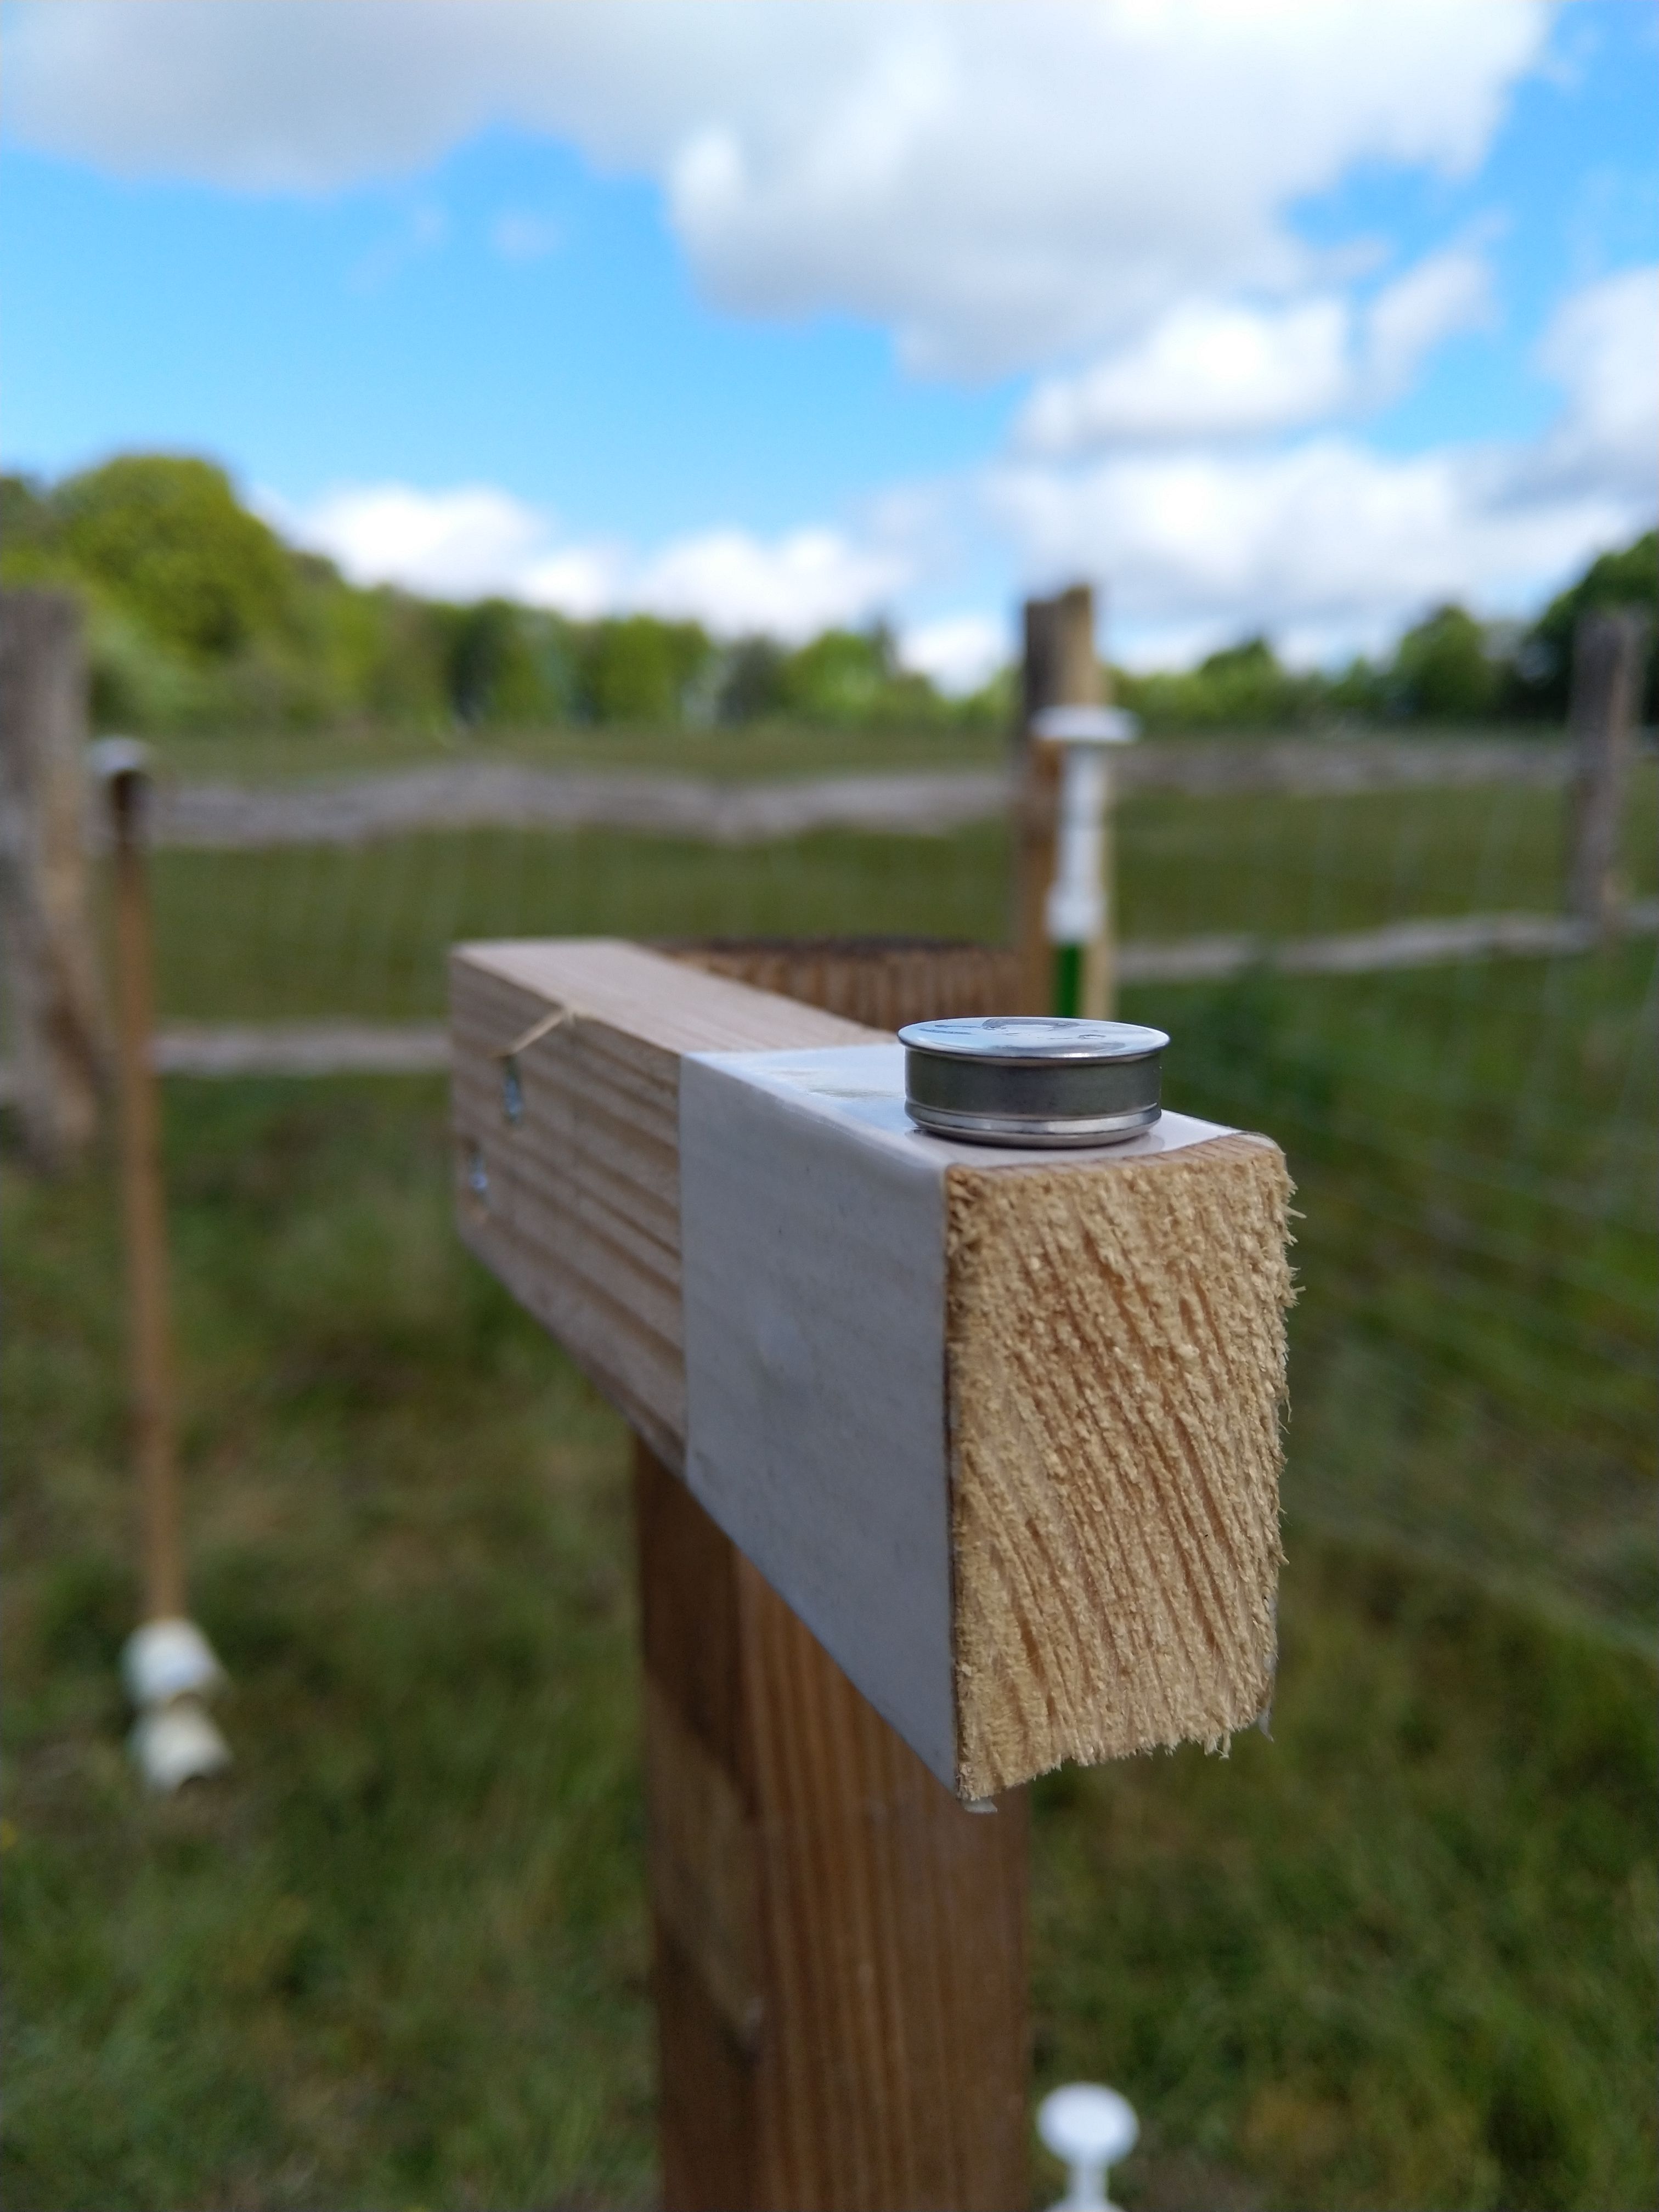
The experimental set-up, where we installed a series of microclimate sensors at different heights above the ground (on the right, you see an iButton and the dim profiles of TOMST TMS4-sensors).
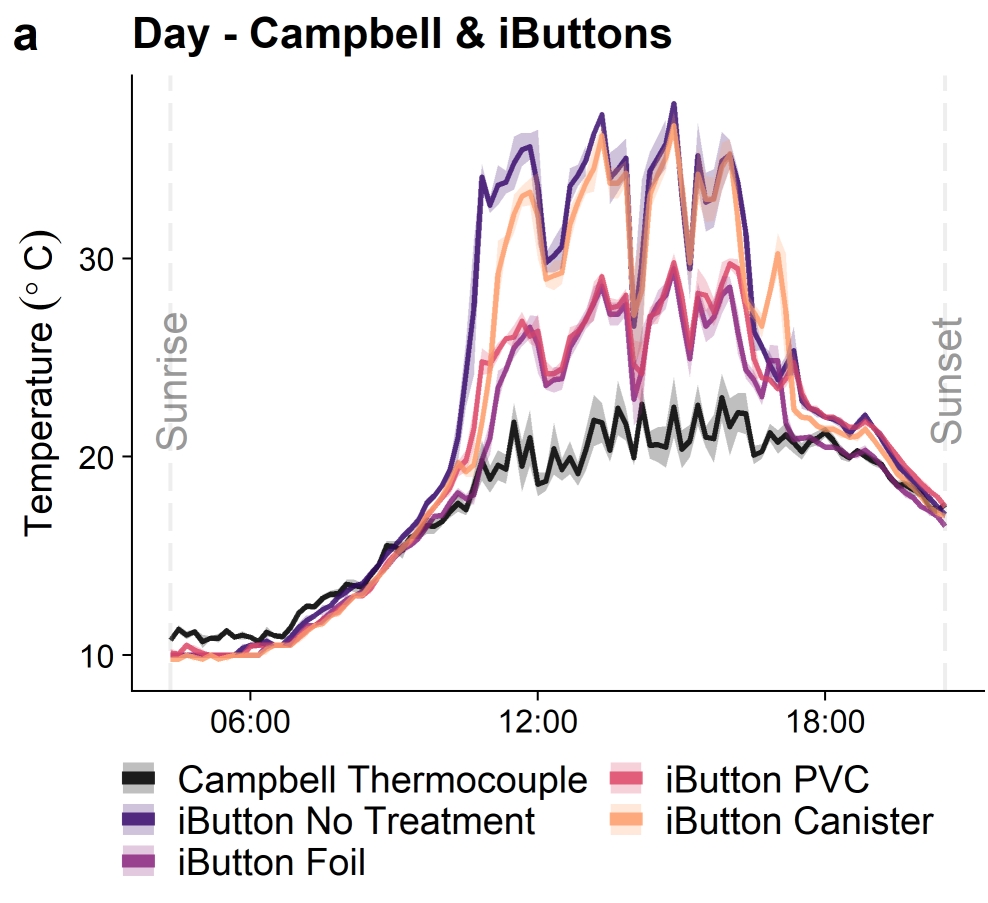
Let’s start with some good news: for measurements of soil temperatures, we don’t expect too many issues. What you measure should match fairly well with what’s actually happening. However, it is above-ground that the trouble starts. More precisely: when the sun is shining and especially when and where wind speeds are low. Indeed, most commonly used sensors yield large errors under direct sunlight, reaching up to a whopping 25°C.
Temperatures on a sunny day as measured with different iButton sensors are often up to 20°C different during the day from those given by a minuscule thermocouple.
Unfortunately this problem cannot be wholly overcome by shielding the thermometer from sunlight, as the shield itself will influence both the temperatures being measured and the accuracy of measurement. Importantly, however, when there is no direct sunlight, for example at night or in shaded environments like forests, errors turned out to be much smaller (see graph).
What’s the impact of shade on air temperature measurements? You see TMS4s with and without hats, and in the background a ‘shading table’. Differences are – as could be expected – substantial. Picture by Koenraad Van Meerbeek
So, what to do if one wants to measure air temperature close to the ground? In our paper, we provide two clear suggestions:
Whenever possible, use the smallest temperature sensors you can find, as these will be affected much less by heat absorption. Low‐cost and unshielded ultrafine‐wire thermocouples were clearly ‘best of the test’, as they will affect the surrounding temperatures the least due to their small size.
In shaded environments, there are more options available, and in some circumstances the use of other logger types, particularly TMS4 dataloggers, is appropriate. The latter are an especially good choice when trade-offs for costs and practical use have to be made. These might also be your go-to solution when the measured effect sizes (i.e., the difference between your location and weather station data) are large compared to the expected errors, such as may occur when regional or elevational variation in temperature is the primary concern, or in locations where weather stations are sparsely distributed.
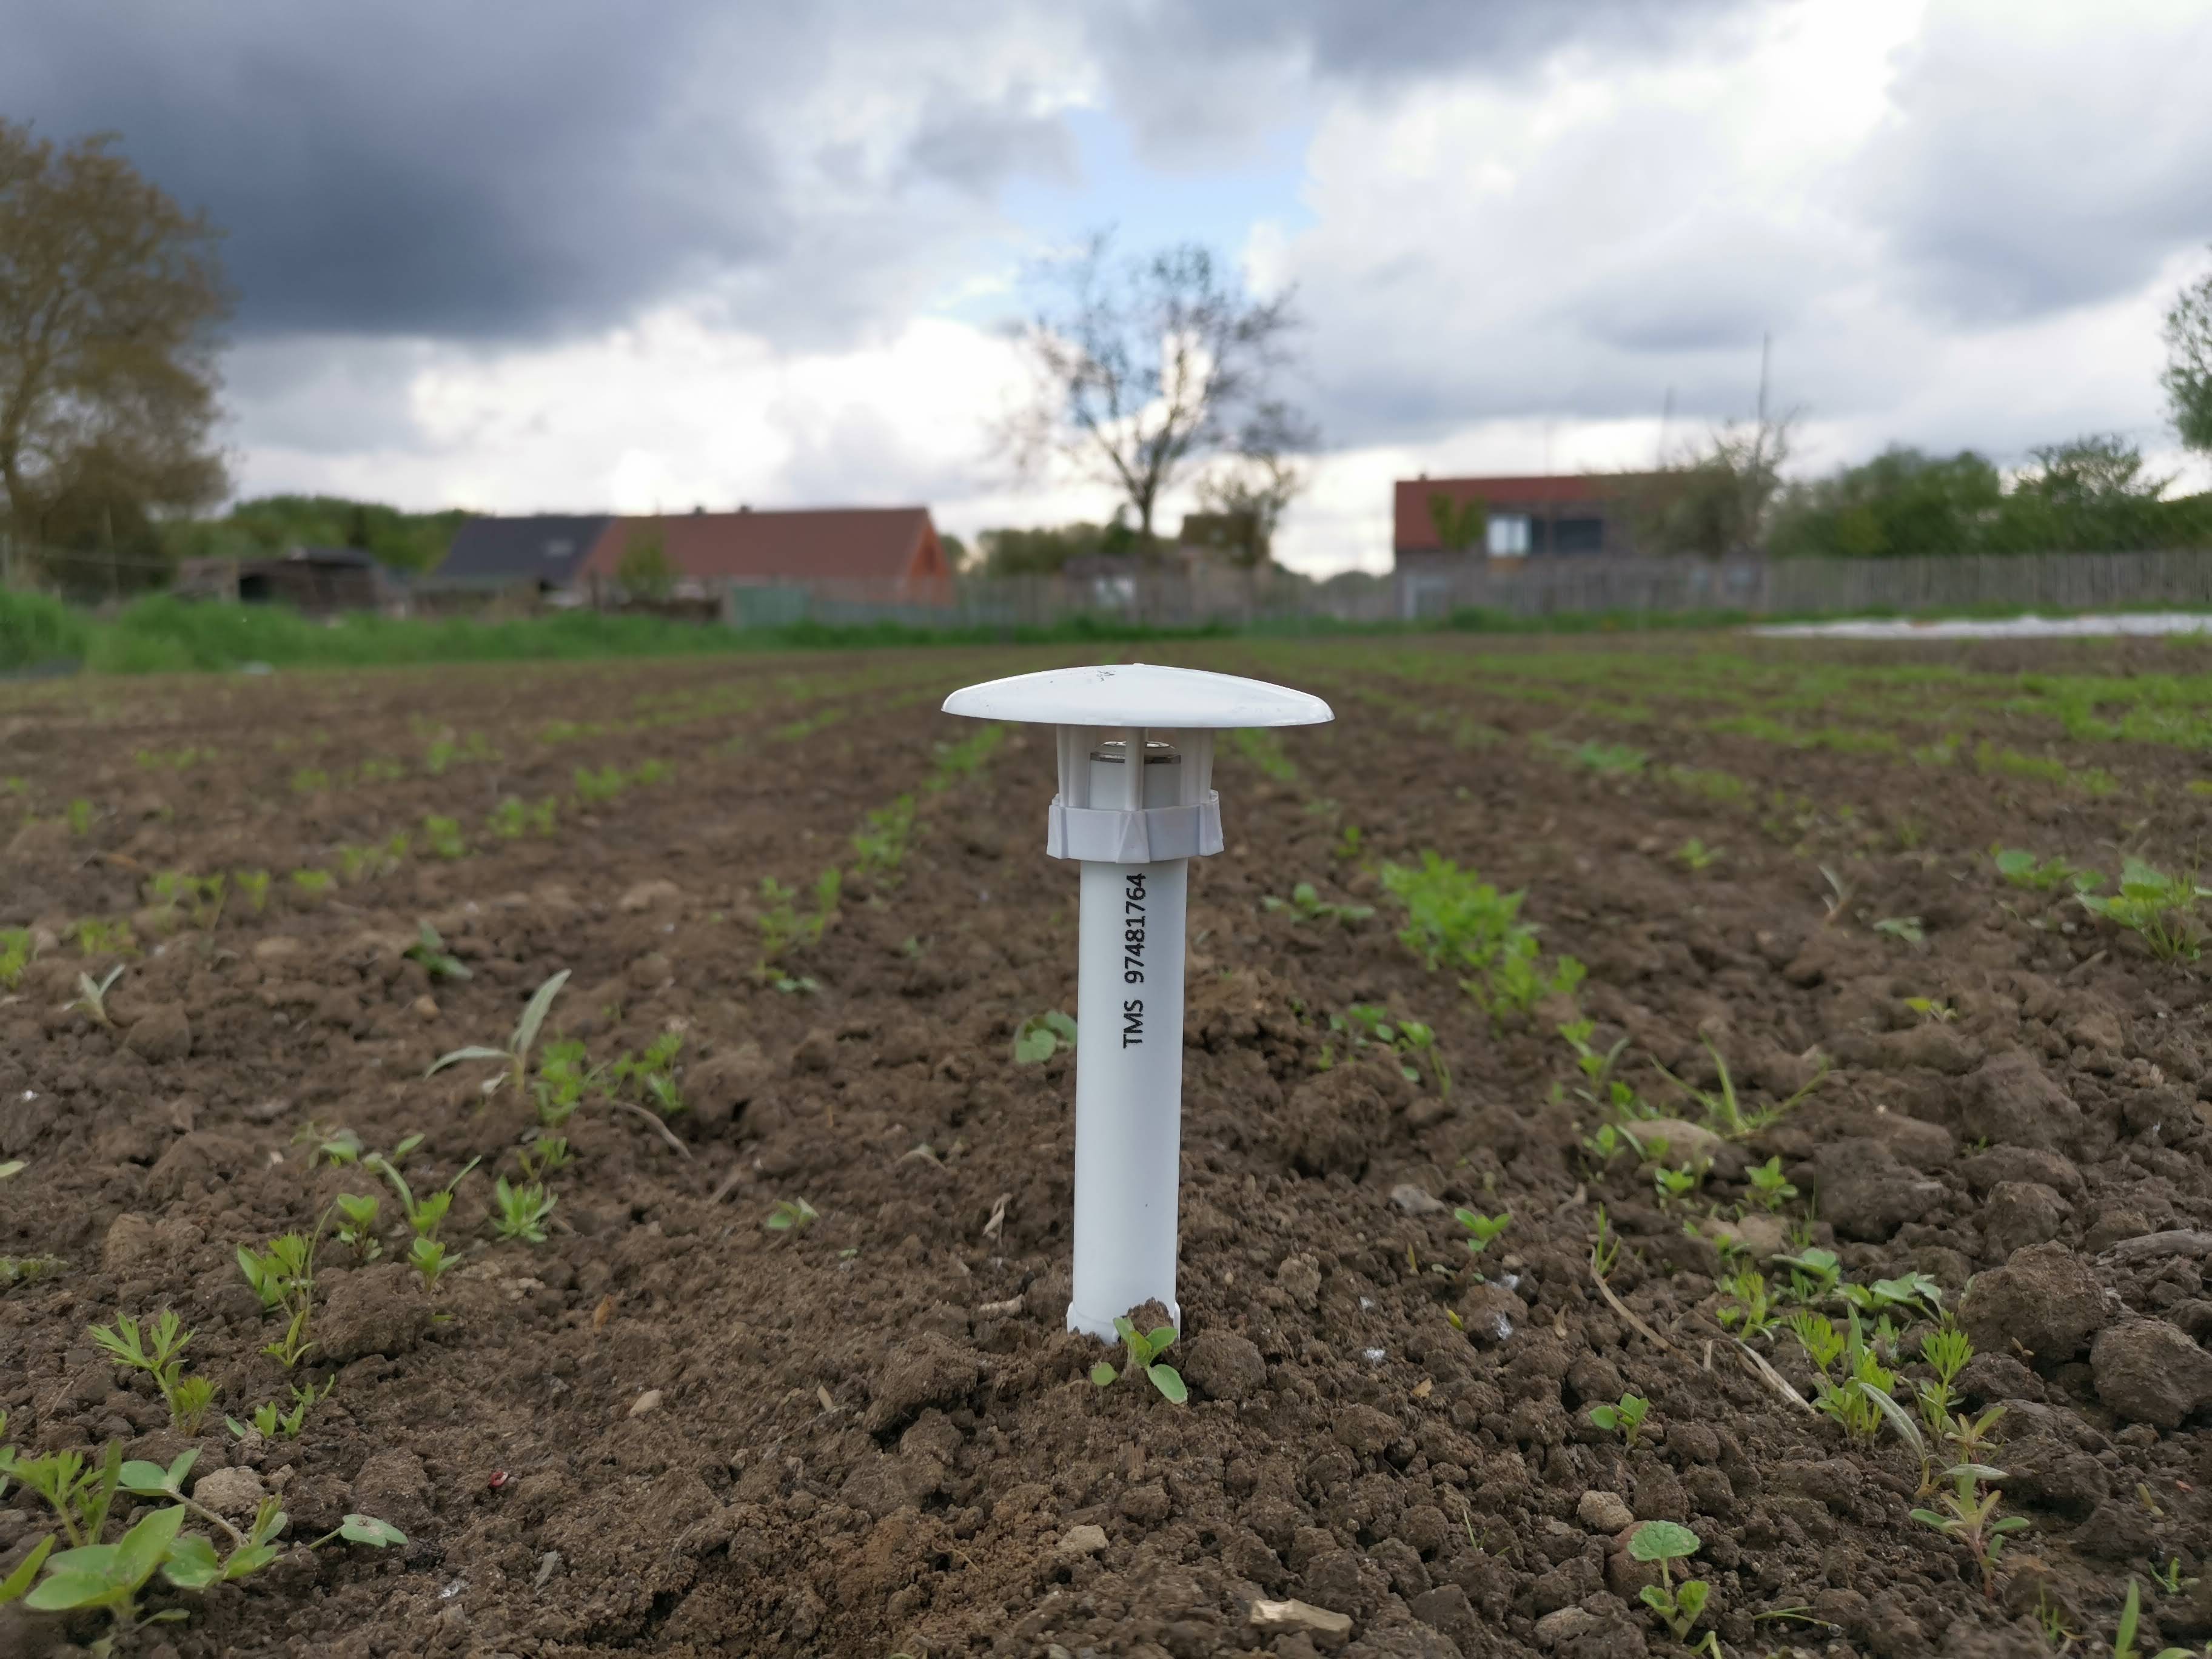
The best of the test of the ‘traditional’ microclimate sensors: the TOMST TMS4. However, on such an open area as this carrot field, air temperatures can still be several degrees different from the truth when sun is shining. In this set-up, soil and surface sensors are below the surface and thus spared from the issues.
In short: there is no perfect way to measure microclimate temperatures, but there are definitely better or worse ways to do it. When working with such data, one should thus be *very* careful that no conclusions are made that should not be made.
Young bluebell (Hyacinthoides non-scripta) surrounded by flowers of yellow archangel (Lamium galeobdolon)
The common bluebell (Hyacinthoides non-scripta), the signature flower of the Hallerbos
Single bluebell flower surviving on a wetter spot, as indicated by the field of wild garlic (Allium ursinum)
A really wet patch of forest, with giant horsetail (Equisetum telmateia) in a field of wild garlic (Allium ursinum)
Wild garlic (Allium ursinum) in the Hallerbos flowers a bit later than the bluebells, yet this one was already in full bloom
A bumblebee visiting yellow archangel (Lamium galeobdolon)
A bumblebee visiting yellow archangel (Lamium galeobdolon)
Wild garlic (Allium ursinum)
Wild garlic (Allium ursinum)
Weirdly beautiful, the inflorescence of pendulous sedge (Carex pendula), typical for the wettest spots in the forest
Weirdly beautiful, the inflorescence of pendulous sedge (Carex pendula), typical for the wettest spots in the forest
A little stream in the Hallerbos, surrounded by endless fields of wild garlic (Allium ursinum)
The herb-paris (Paris quadrifolia), less common in the forest
Wild garlic (Allium ursinum)
Bluebells (Hyacinthoides non-scripta)
Weirdly beautiful, the inflorescence of pendulous sedge (Carex pendula), typical for the wettest spots in the forest
Another one from the wet plots: large bitter-cress (Cardamine amara)
Another one from the wet plots: large bitter-cress (Cardamine amara)
Young beech leaves, as soon as they are fully grown, spring in the understory is over
A beech forest without understory, most likely too dry and too acid for any survivors
A young beech seedling (Fagus sylvatica), looking nothing like a beech, yet everything like a tiny dancer
Young beech seedling (Fagus sylvatica)
Bluebells (Hyacinthoides non-scripta)
Bluebells (Hyacinthoides non-scripta)
Bluebells (Hyacinthoides non-scripta)
Mountain melick (Melica nutans), a grass in the most amazing green
Bluebells (Hyacinthoides non-scripta) in a rare patch of mountain melick (Melica nutans), a grass in the most amazing green
Bluebells (Hyacinthoides non-scripta)
Bluebells (Hyacinthoides non-scripta)
Montpellier 2017
The entrance to the cathedral of Montpellier
The cathedral of Montpellier
The entrance to the cathedral of Montpellier
The cathedral of Montpellier
Narcissus poetics
The cathedral of Montpellier
The botanical garden of Montpellier
The botanical garden of Montpellier
The botanical garden of Montpellier
Brackish Camargue vegetation
Brackish Camargue vegetation
Brackish Camargue vegetation
A typical lagune
Brackish Camargue vegetation
Camargue horses
Camargue horses
Camargue horses
Brackish Camargue vegetation
Brackish Camargue vegetation
Brackish Camargue vegetation
Camargue horses
Brackish Camargue vegetation
Little egret in the evening sun
Flamingo’s in the evening sun
A typical lagune
Dandelion fuzz
Grass lily
Grass lily
Dandelion fuzz
Veronica in a sea of poplar fluff
Euphorbia in a sea of poplar fluff
Poplar
Gare du Midi, Brussels
Gare du Midi, Brussels
Gare du Midi, Brussels
Gare du Midi, Brussels
Sweden autumn 2016
Autumn in Abisko
Yellow leaves of mountain birch, with lake Torneträsk in the background.
Lapporten, the gate to Lapland, in Abisko
Rain blowing over the Abisko National Park
The colours of the north: red fireweed and yellow mountain birches, with lake Torneträsk on the background
Yellow leaves of mountain birch, with lake Torneträsk in the background.
Rain on the background, the ski lift in Abisko on the foreground
The steep slope of mount Nuolja on a dramatic looking morning
The beautiful colors of lake Torneträsk in Abisko
A little stream on top of the mountain, with a view on Lapporten, the gate to Lapland
Well, that is a beautiful table with a nice view on lake Torneträsk in Abisko
Our little experiment on top of the mountain in Abisko, with a view on Lapporten
Autumn in Abisko is extremely colorfull
The ski lift with a view on Abisko National Park and Lapporten
Hiking dowhill towards lake Torneträsk
This green is greener than the greenest green: moss on top of mount Nuolja
Well, that is a beautiful table with a nice view on lake Torneträsk in Abisko
The ski lift with a view on Abisko National Park and Lapporten
The ski lift with a view on Abisko National Park and Lapporten
The most beautiful hiking trail of the world: Nuolja in Abisko
Angelica archangelica, often the biggest plant of the Arctic
The most beautiful hiking trail of the world: Nuolja in Abisko
Cirsium helenioides, the melancholy thistle
Hiking down mount Nuolja
The steep slope of mount Nuolja on a dramatic looking morning
The colours of the north: red fireweed and yellow mountain birches, with lake Torneträsk on the background
The prettiest yellow and blue: autumn in Abisko
Fireweed, Epilobium angustifolium
Campanula or bellflower, I think ‘uniflora’
Vaccinium myrtillus
Cornus suecica, the prettiest red of the world
Hieracium alpinum, alpine hawkweed
Carex atrata, one of my favourite sedges
Alpine clubmoss, Diphasiastrum alpinum
Agrostis capillaris, bentgrass
Common yarrow (Achillea millefolium)
Anthoxanthum odoratum, sweet vernal grass, fully grown and mature
Snow scooter trail
Our plot in the mids of a field of horsetails (Equisetum pratense)
Equisetum pratense
Cliff overlooking the valley with the road to Norway
Seedling of Taraxacum officinale, the dandelion, after two years of growing in bad conditions
Poa alpina, the alpine meadow-grass, with its viviparous seeds
Massive flowerhead of Angelica archangelica
Angelica archangelica
Blueberry (Vaccinium myrtillus) in autumn
A lowland marsh in Abisko in autumn
Installing the plots of our trail observations on top of mount Nuolja
Installing the plots of our trail observations on top of mount Nuolja
Tanacetum vulgare (Tansy), non-native for the high north
Autumn forest down in the valley
The valley of Nuolja to Björkliden
Summer on the Nuolja-side
A full rainbow behind mount Nuolja in Abisko
It’s raining in the west, clouds trapped behind the mountains
A strong wind blowing rain from behind the mountains to our side
A strong wind blowing rain from behind the mountains to our side
Betula nana, the dwarf birch, mini autumn forest
Betula nana, the dwarf birch, mini autumn forest
The valley of Björkliden in autumn
The valley of Björkliden in autumn
The valley of Björkliden in autumn
The valley of Björkliden in autumn
Sweden spring 2016
Eriophorum vaginatum
Bartsia alpina
Silene suecica
Ranunculus glacialis
Rubus arcticus
Although the alpine zone has been harder for invasives to access than most places, human structures like trails are often an easy gateway for the invaders to get up there. Picture from Abisko, Swedish Lapland.
Overlooking the valley of Laktajakka
Silene acaulis
Cornus suecica
Dryas octopetala
Western European species like the red clover (Trifolium pratense) here are often listed as non-native species in mountain regions.
The valley of the lakes
A rainy hike
Melting snowpatch on a lake
Trifolium pratense
Salix reticulata
Oxyria digyna
Ranunculus glacialis
Trifolium repens
Amiens
The museum behind the beautiful gates
View from my office window
Cathedral at night
Winter sun on the Place du Don
Cold!
Cathedral at night
Sunny but cold, the Quai Bélu
The southern side
Cathedral with a glimpse of spring
Cathedral seen from the frozen Parc Saint-Pierre
House on the square before the cathedral
Sunny but cold, the Quai Bélu
Le Club d’Aviron in winter weather
View from my office window
Colourful mirror
Frozen to the bone
Nice architectural curve
Just outside of Amiens
Sun rising above the water
Enjoying silence and the morning sun
Frozen mirror
Cathedral at night
Almost cold enough for ice-skating
Cathedral at night
Gargoyle planning to eat the cathedral
Maria without a shirt
Amiens is filled with cute little houses
Sweden autumn 2015
Lichen
Sweden summer 2015
View on the 1000 meter plots
Doing research on a cold Arctic morning
Plots flooded by the snowmelt
Flooded by the snowmelt
Meltwater river, racing down the mountain
After a hike, even the most basic house looks cosy. Little hut in the mountains, open for everybody
Snowbridge, maybe don’t cross…
Snowbridge
View from a cliff
Silene acaulis or cushion pink, cutest plant of the Arctic
Two seasons in one image
Steep slope
Hiking down
Narvik Kirche, church of the subarctic
Narvik Kirche
Reindeer on top of the mountain
Narvik Kirche
Summer at the church
Summer flowers
Massive waterfall
Young willow catkins
View from Narvik’s hospital, with lilac flowers
Building a bridge over the fjord will gain al drivers at least an hour
Norwegian fjord
Posing with the water, getting soaked
Minimalistic mountains
Insect investigating our reindeer antler
Catching mosquitoes with our license plate, harvest of the year!
Posing with the plot
Fieldwork on the most beautiful spot of the world
Fieldwork on the most beautiful spot of the world
Summer bridge – still next to the sadly impassable river
Rhinanthus flower in the mountains
Plateau in the valley, beautiful brown
Experimental view from my favourite plot
Salix catkins
Extremely old Betula tree
Waterfall from a cliff
Buttercup is the earliest in spring, here
Rocks!
Alpine views
Views!
Fieldwork
Jumping over rivers
Plot
Golden plover
Angry lemming
Green, the whole north is green!
Snow, so much snow left!
Minimalistic mountain moments
Fieldwork
The research center
Red clover – focal invader
Look at this tiny cute snail!
Massive floods of melting water
Bartsia alpina
Hooray, a toilet!
Dryas octopetala
Lowest elevation plots
Butterball!
That’s a lot of water
Midnight sun is the best
At the lakeside
Beautiful Bistorta vivipara
Don’t fall in the water
Midnight sun
Wild river
Art – made by ages of wild rivers
Baby firework for America’s independence day
Midnight sun at the lake
The Abisko canyon was wilder than ever
That’s a crazy amount of water!
The Abisko canyon was wilder than ever
The Abisko canyon was wilder than ever
Black and white
Stone-man overlooking Abisko
Nothing as soft as a willow catkin
Label and soil temperature sensor attached
I’d drive to the top every day
Reflections
Rocks and clouds
Brave little birch
Brewing our camping poison
Basic camping stuff
Camping in Norway
Home-made temperature houses
Roadside research at its best
Norway is crazy
Horsetail is so funny
Little creek in magical forest
Birches, birches everywhere
Beautiful rock, a gift from the river
Another roadside fellow
Lichen
Ready to rock the summer
Collecting mosses
That’s a crazy old lichen
Tiny tiny piny trees, but old, so old!
Ready to jump into the fjord?
Ready to jump into the fjord?
That’s a spiky stone!
Views on Norwegian fjords
Silene in the mountains
Cute little orchid
Skua
Attacking skua, mind your heads!
Watch out for the attack of the fierce skua!
Black snail
New plot!
Still a lot of snow to melt, but this spot was free for a new plot
Reindeer are better than people
Two seasons in one picture
Let’s see what is happening to the balance in mountains! Is this a starting avalanche, or will it last a bit longer?
Cute little hut
Climbing mountains by car
Softest moss in history
Drosera in the marsh
Hiking in no-man’s land
The clouds are coming
Abisko valley
‘Butterball’
Fieldwork in the tundra
Abisko valley
Little plot
Clouds and sun and mountains
Making soup on a campfire with a view
Little creek on high elevations
Skua on the look-out
Melting snow in a river
Rhodiola rosea and the Törnetrask lake
Beginning of spring
Flooded plots, melting snow, impassible wetness
Ferns and horsetails
Chile 2015
Trips to the field sites were sometimes a real adventure, especially right after snowmelt
Lunch made by our local colleague, with funny bread (tasty as well!)


")


")
")


")


")


")


")


")


