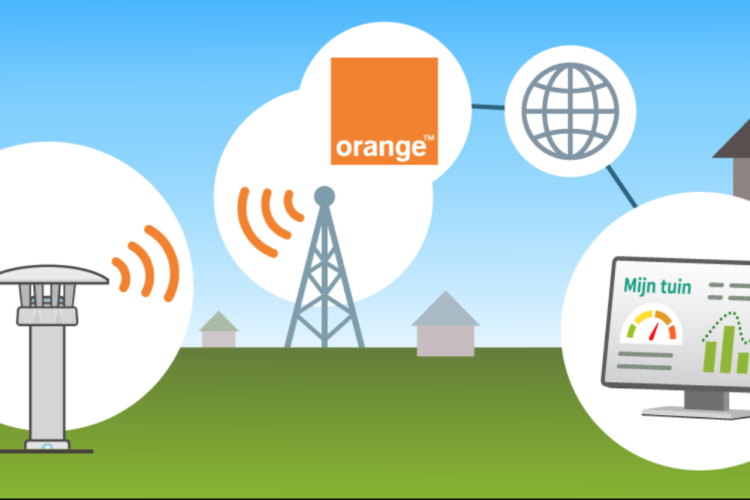
The data from the lawn network of our citizen science project (CNidT) is transmitted via the Internet of Things. With its 5,000 connected sensors, CNidT is also the largest Internet of Things network in Belgium. Pioneering work, therefore, and that gives as many interesting surprises as challenges.
The name, Internet of Things, or IoT, refers to a set of devices that are connected to the Internet. In this way, the devices can send data to the cloud, communicate with databases or exchange data among themselves.
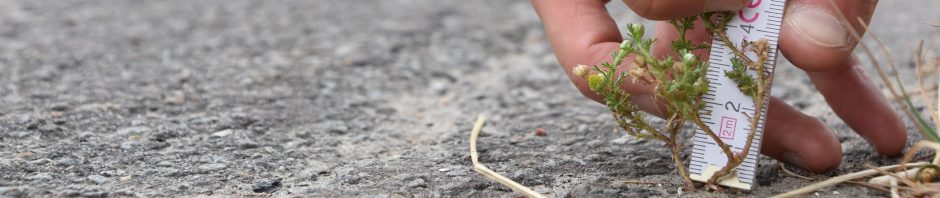
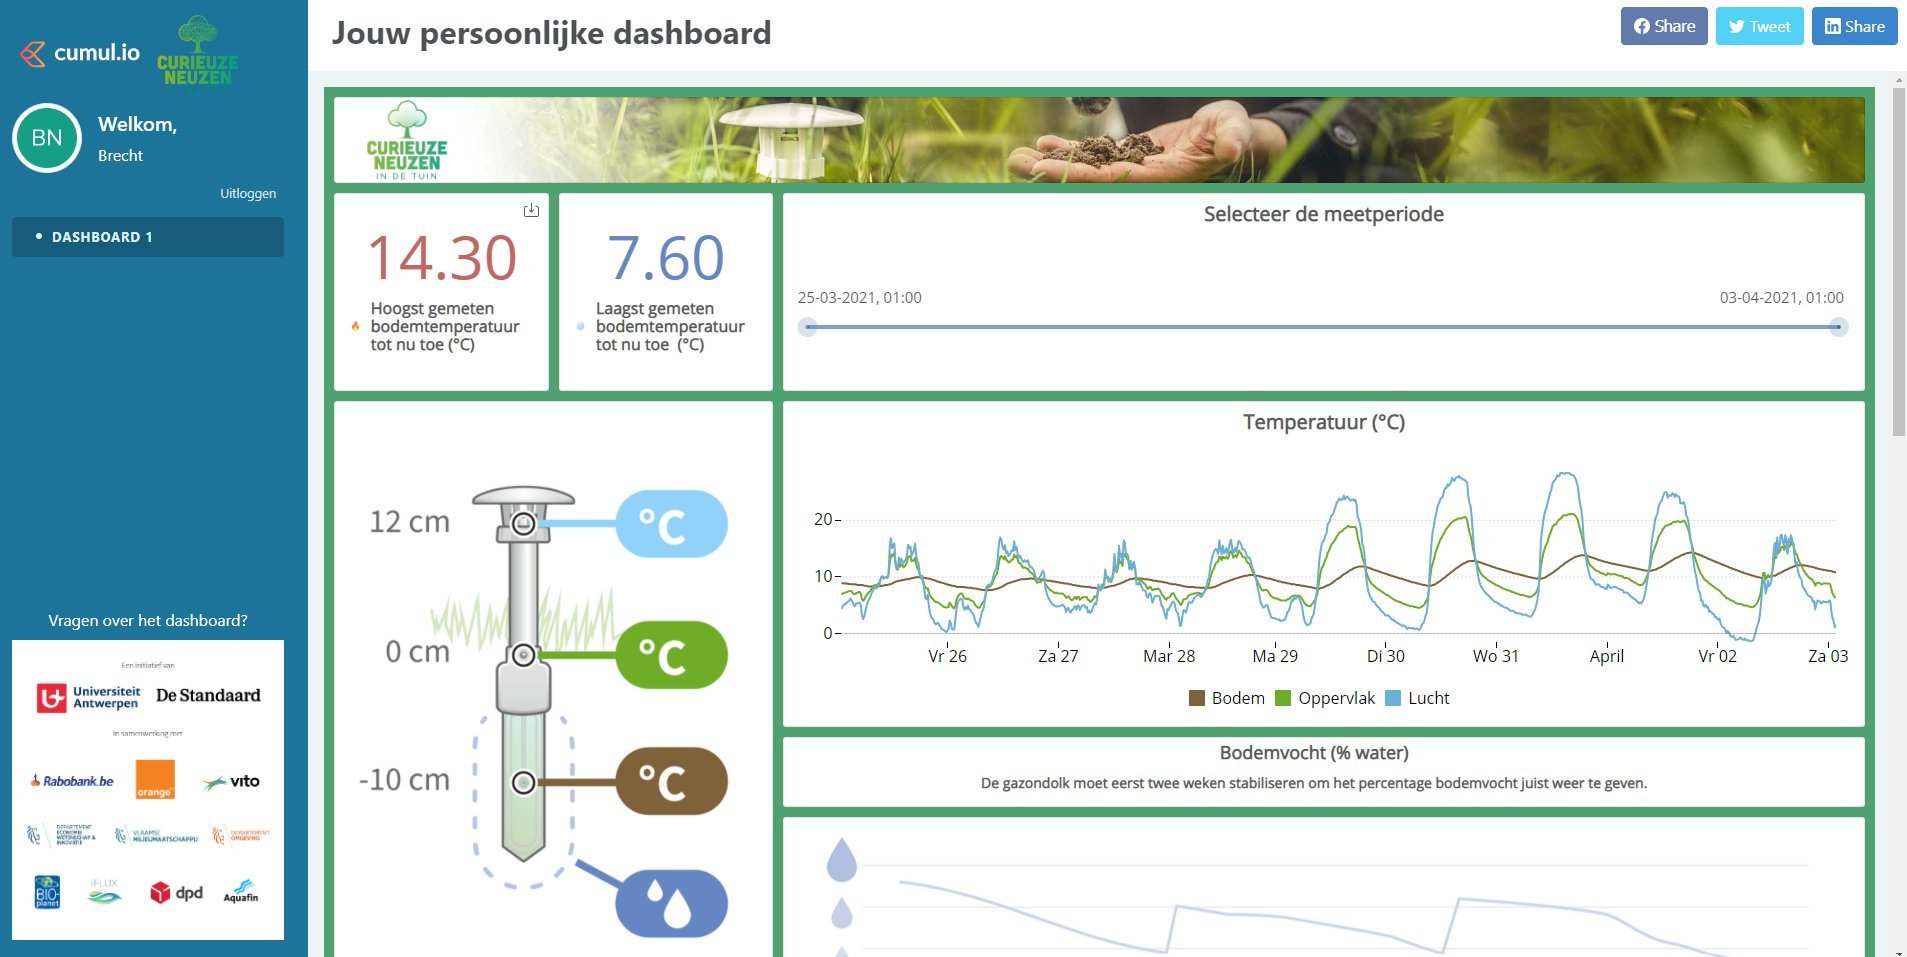
Many devices on the IoT are equipped with a sensor to collect data. In the case of CNidT, the soil sensor has several sensors that measure air temperature, soil temperature or soil moisture every 15 minutes. Via a SIM card, the sensors are connected to Orange’s IoT network and once a day the collected data is transmitted to our database and the participants’ dashboards (you can check out the dashboard of the sensor at the University of Antwerp here!).
After over a month of data collection, we now have a great view of how faithfully the lawn daggers transmit their data to the CuriousNoses database at UAntwerpen. What is surprising is that part of the network reacts like a “good family man”, while another part acts more like a “sulking teenager”.
About 50% of all sensors send their data every 24 hours (these are the good family men). The other 50% still like to hold the data for one or more days, only to send it all in one burst at a later time (these are the stubborn teenagers).
Is your garden dagger by any chance a sulking teenager? No need to panick yet. You won’t indeed see new data appearing on your dashboard every 24 hours. But this data is not lost: the data is stored in the internal memory of the soil sensor and transmitted when there is connection again. Either way, this data gets ultimately included in our analyses.
From an Internet of Things perspective, these good and bad lawn daggers are highly fascinating: why is the network reacting the way it is? Is there reduced coverage in certain locations? Are there large trees or buildings nearby? Or does the weather play a role in connection reliability? And what can we learn from this for the future rollout of large IoT networks? We are currently investigating these interesting questions with partner Orange, sensor builder TOMST and the Internet of Things wizards at ID lab at UAntwerpen.
Text by Sanne de Rooij, translated by Jonas Lembrechts
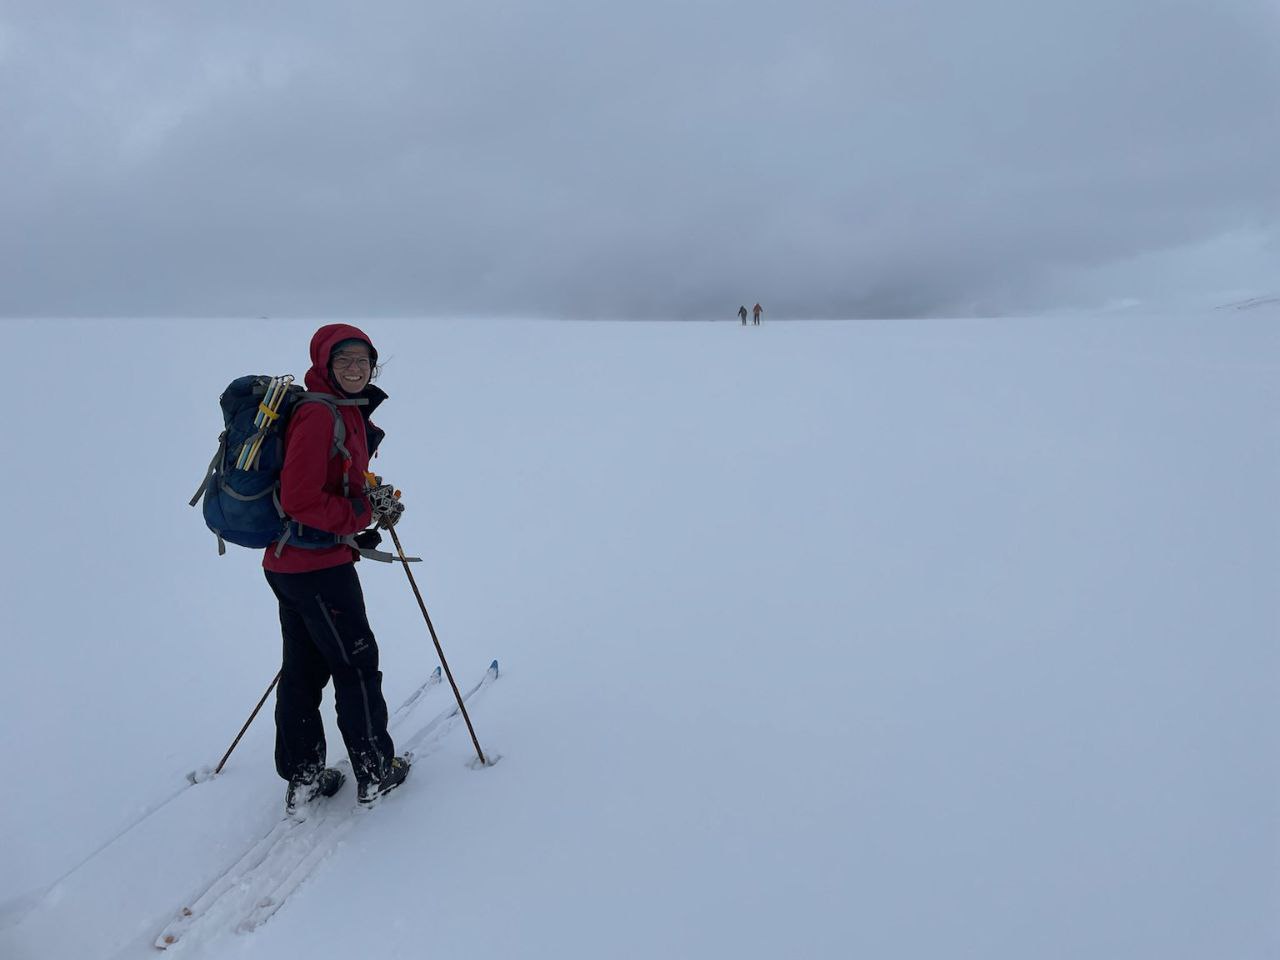
I received some pictures from the snowy colds of the Norwegian mountains this week, where The3DLab-member Ronja went on a cross-country ski tour to her seed addition experiment to measure snow depth.
Snow is a crucial component of microclimate as it serves as a blanket: a thick snow pack can keep soil- and near-surface temperatures close to 0°C all winter.
Ronja in a black-and-white world, on the road to her fieldwork plots. Picture by Eivind Bering
In Ronja’s experiment, we are especially interested in local variation in these snow covers, as we are comparing exposed with sheltered locations. In the exposed location, wind prevents the accumulation of a thick snow pack, with potentially much more intense freezing around our seedlings, yet also an earlier onset of spring. In the sheltered locations, snow can accumulate, providing this important blanket against heavy freezing, yet also delaying the start of spring for the plants underneath the blanket.
Locating your fieldwork plots under a blanket of snow needs good GPS-coordinates. Picture by Eivind Bering A sheltered location, where no plots can be seen. Picture by Ronja
Often these winter measurements of the snow depth are lacking – few are brave enough for winter fieldwork. But Ronja fears no cold (and has equally brave friends to provide fun fieldwork company) and got us the precious data we need.
Very much looking forward to see how the seedlings look when snow is gone!
An exposed plot, with very little snow cover. Picture by Eivind Bering The precious winter data! Picture by Ronja
The3DLab member Ronja got interviewed for a podcast at her university in Trondheim! A very nice summary of her research. You can find the podcast here, or on Spotify!
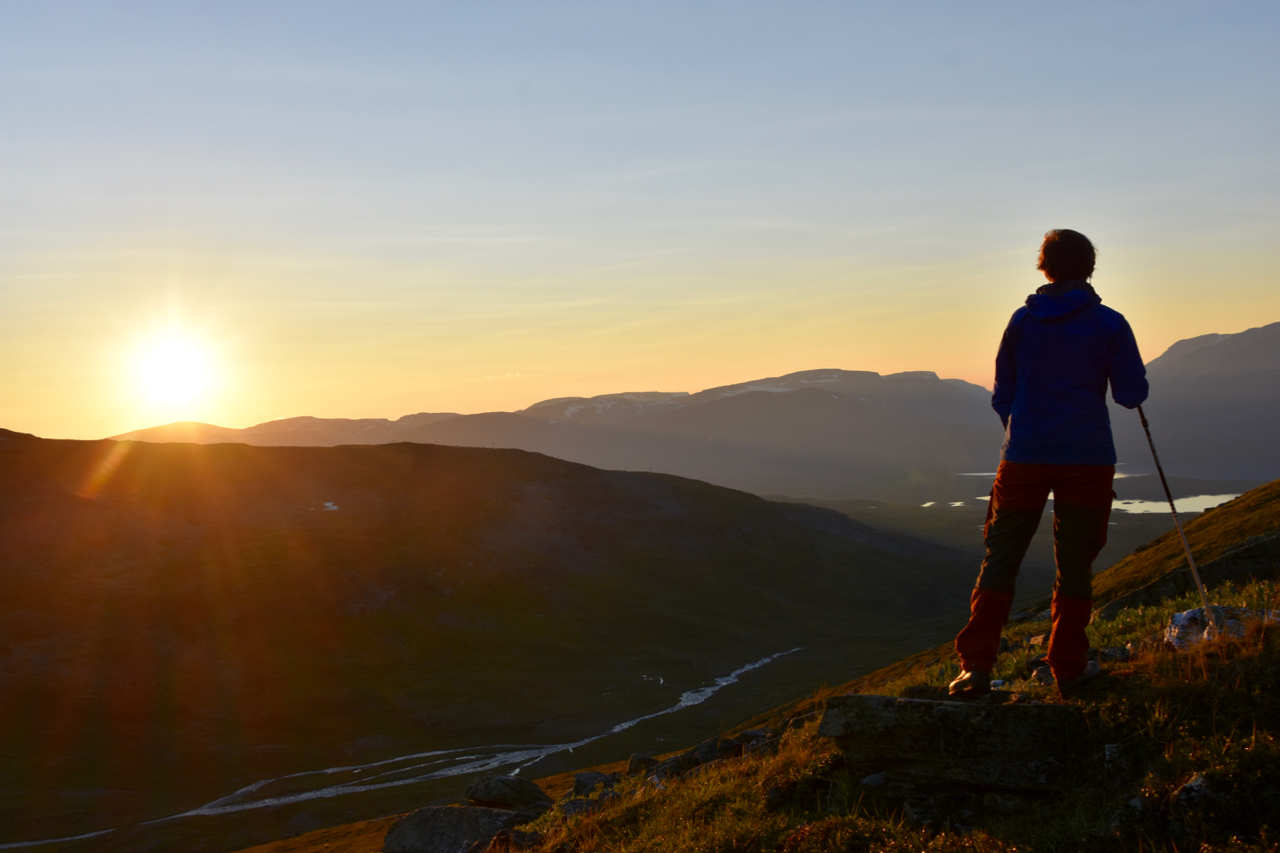
The podcast investigates the environmental impacts of hiking trails in the Trondheim area. Norwegians are active practitioners of “friluftsliv” and hiking is one of the most popular activities. Ronja Wedegärtner, Ph.D. candidate at NTNU, discusses the influences of hiking trails on vegetation shifts in mountains in the Northern Scandes, giving away some cool insights about her PhD-research!
Ronja in the Swedish mountains in search for impacts of trails on vegetation
Want the scoop of some of the most fascinating results from her work, then this podcast is a must-listen!
Saving the world isn’t rocket science
The rapid growth and challenges related to agriculture, urbanization, tourism and human-wildlife conflicts require knowledge to take action. Listening to this podcast, you will be updated on state-of-the-art science related to issues in Trondheim. “Saving the World isn’t Rocket Science” shares knowledge from the science community by interviewing local researchers about sustainability problems in Trondheim and possible solutions.
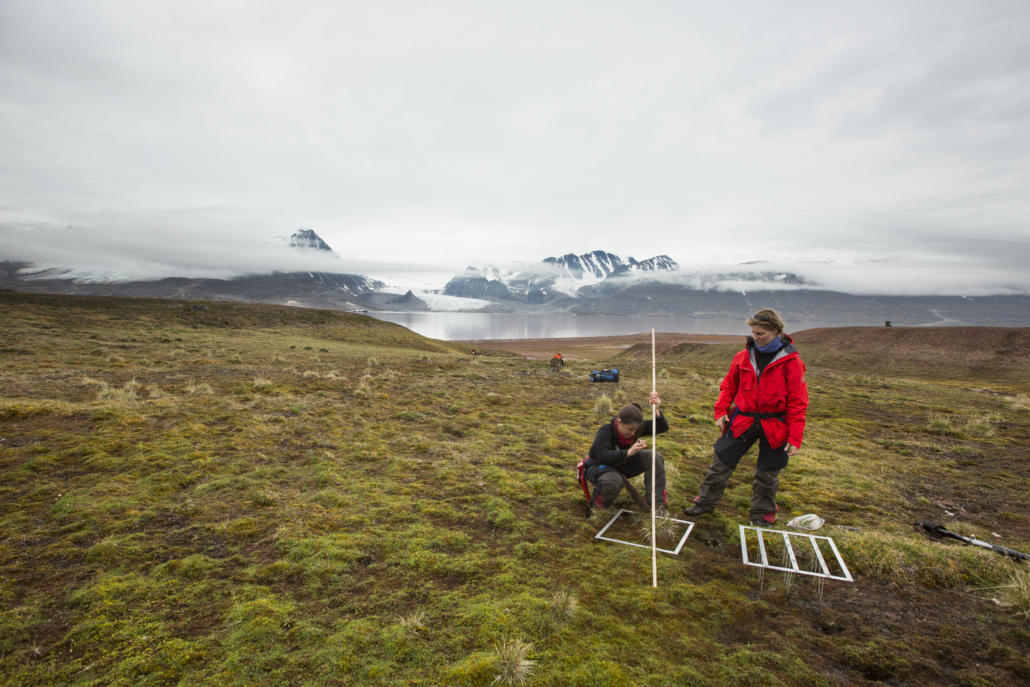
In a recent study co-authored by The3DLab-member Ronja Wedegärtner, a team of researchers have mapped invasive plants on Svalbard, and the results leave no doubt; alien plants grow where humans have been.
Two of the researchers on fieldwork in Svalbard. Photo: Lawrence Hislop / Norwegian Polar Institute
The research team found 36 alien plant species, which grew exclusively in areas with human activity. Both around tourist attractions in settlements, and where there has previously been farming.
All of this might sound minor – finding 36 alien plant species should not be that much work, right? – yet the remoteness and challenging working conditions on Svalbard make organized alien species inventories far from straightforward. With this new study, the researchers finally provided a benchmark for continuous monitoring, that will greatly facilitate keeping track of changing biodiversity in the Arctic in the future.
More details on the study can be found in this nice blogpost.
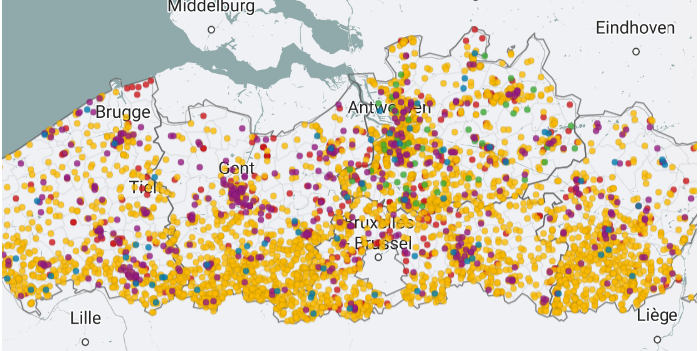
Distribution of sensor locations across Flanders. Yellow dots represent private gardens, purple are schools, red is for participating municipalities. The green ones in Antwerp represent a separate project in nature reserves.
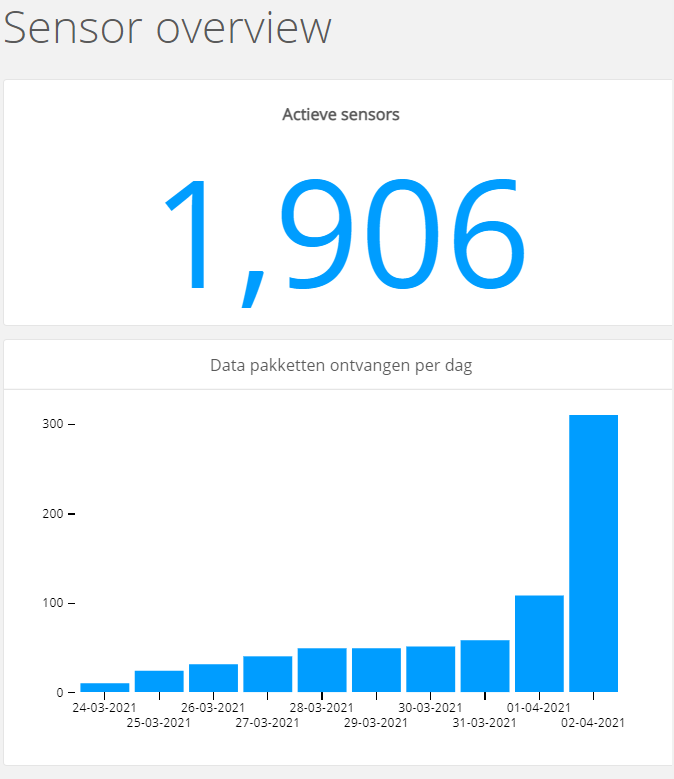
There we go, today marks the official launch of CurieuzeNeuzen in de Tuin, the day on which 4500 microclimate sensors pop up across Flanders!
1906 sensors connected at noon on ‘D-day’. These will only start sending data on Sunday night, so only 300 are currently actively transmitting data (bottom)
You can take a look at their distribution on this map here.
These are scary and exciting moments, where we can follow in real-time if the connection of the sensors to the Orange Internet of Things-network are successful. As you can see on the right here, things are starting to look good, with already almost half of the sensors successfully installed.
Don’t underestimate that achievement: this is by far the largest IoT-sensor network that the country has ever seen, and we are thus truly technological pioneers.
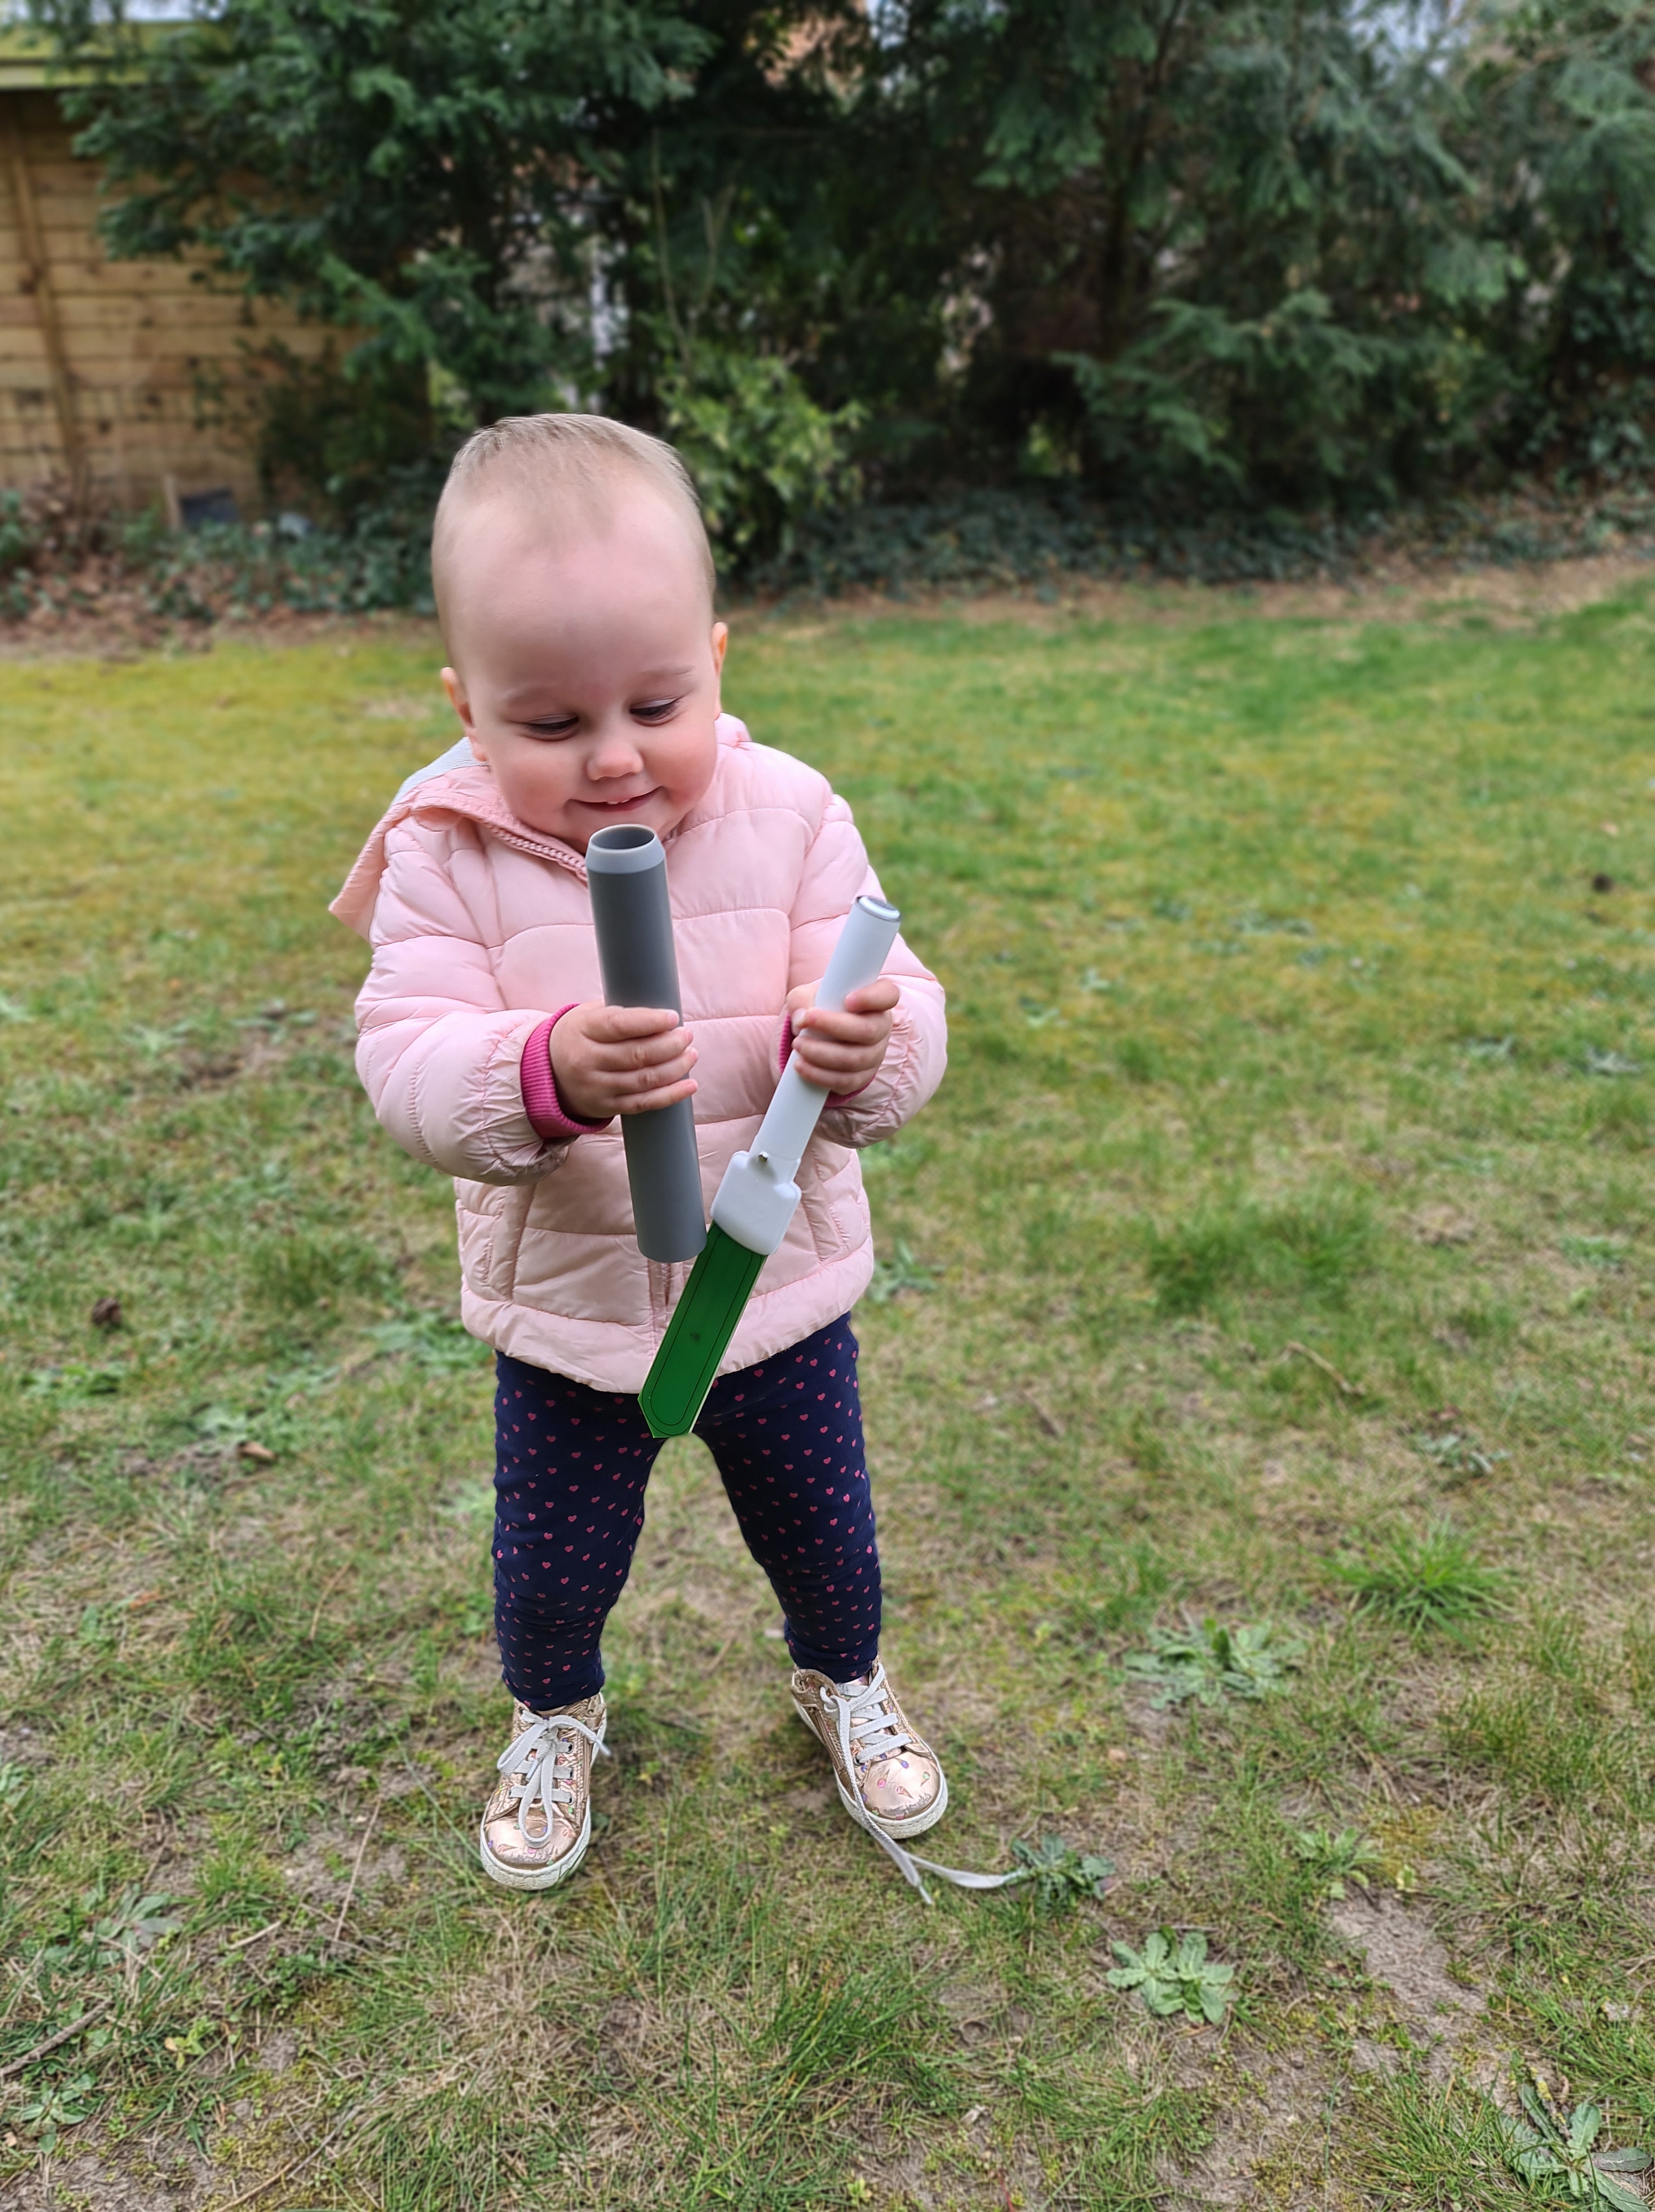
But all is working relatively smoothly, while microclimate sensors are popping up in gardens across the whole region. Here at home, there was a little scientist helping out in any case (one that especially loves the little blinking lights that comes when sensors fail to connect to the network and, believe me, we have seen plenty of those during development!)
Location selection was done using our recently published selection algorithm that maximizes environmental heterogeneity. Hence the higher density of points in the more complex southern half of the region, and in urban centers.
Finally, below a sneak peek of the dashboard where participants will be able to follow the patterns in their own data, and how those compare with the rest of the region (available for participants from April 6th).
We need a different kind of weather station networks to answer most ecological questions. We argue that what we need is countrywide ‘microclimate networks’, that measure weather conditions there where they matter for ecology and nature around us.
Where weather stations are insufficient
To measure global weather and climate, the world is increasingly covered by a network of weather or meteorological stations. On land, these stations are designed in such a way that it ensures all stations, whether in Belgium or Brazil, are recording climate in the same standardized manner: in open landscapes, above short grass, and well away from trees, buildings or mountains. While macro-meteorologists, those who design these networks, did their best to remove these local sources of “noise” in the data, these sources of “noise” are meaningful to many organisms. For example, although trees may cause chaos for meteorologists, because forest cover interrupts and changes local temperatures, these differences in forest cover between for example a beech forest in Flanders and a dense tropical forest in the Amazon rainforest of South America have huge meaning and importance for the animals and plants that live there. As a result, our current weather station network is ill-equipped to provide meaningful data to scientists wanting to know how climate impacts biodiversity.
To do: build countrywide microclimate networks
A call to action has been made in a recently published study, which calls for a globally coordinated effort to create a new kind of weather station network – one that can tell us what a small lizard is ‘feeling’ in the remotest of habitats. We strongly believe that the world needs microclimate networks in parallel to the existing countrywide weather station network as established by national meteorological institutes, such as the RMI in Belgium. We also believe that we need to be quick about it. In their recent publication, the ecologists stress their case. Actually, we need two things: mini weather stations that measure conditions close to and in the soil, and a network of these sensors that measures in the most relevant environments. From cities to the countryside, from forests to mountain slopes, all those locations traditionally avoided by weather stations should be preferentially sampled by these new microclimate networks. By implementing this kind of network, we will be better equipped to understand climate change impacts on species, ecosystems and our agricultural systems.
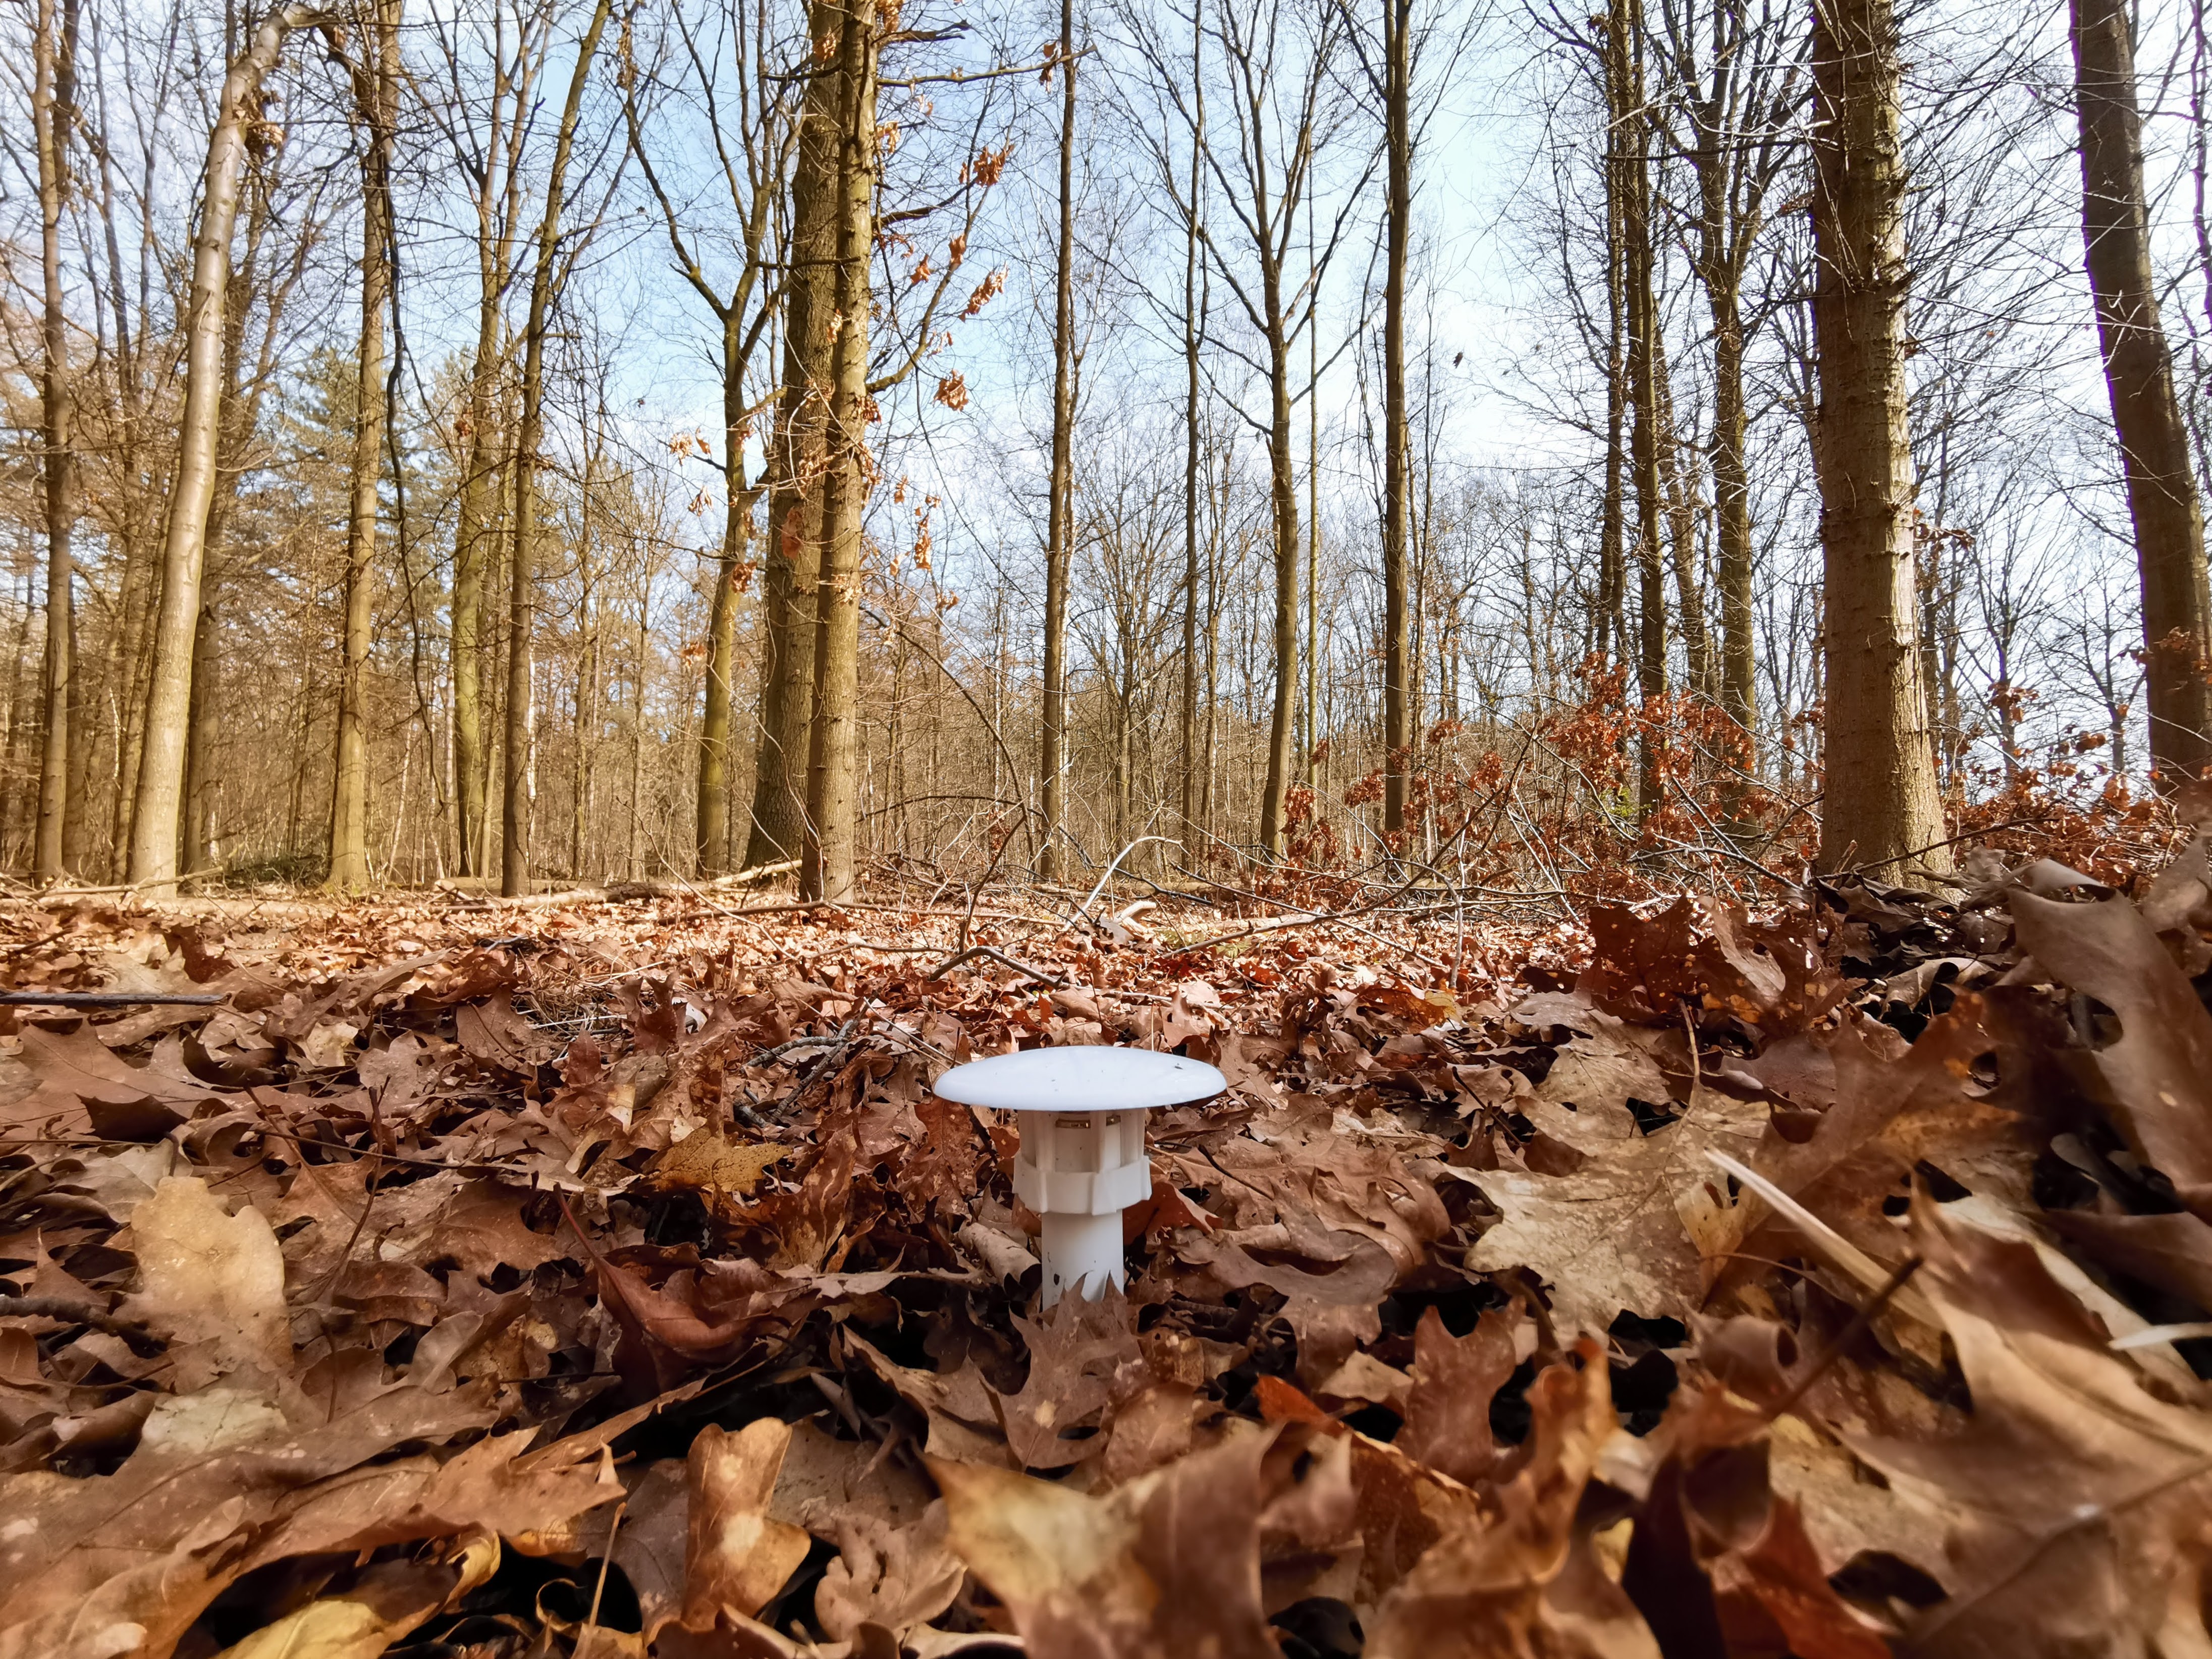
A ‘mini weather station’ in action, measuring temperature and soil moisture in a Flemish broadleaf forest.
Selection algorithm
To achieve these countrywide microclimate networks, we provide a handy algorithm to decide where exactly these new networks should come. It selects measurement locations based on the expected microclimate variability of a region, by selecting locations in as broad a range of landscape types as possible. For this, we use a multivariate analysis of the environmental space, based on characteristics from which we know that they matter for microclimate: topography, vegetation cover, urbanity, macroclimate. The algorithm quantifies the distribution of these habitats across the country or region and proposes a set of locations that maximally covers this variability with as few measurement locations as possible.
Next up? Implementation! We hope that governments, scientists or anybody else pay heat to our plea for microclimate networks and use our proposed selection tool to implement them in their own region. As such, we reach out to anybody else to start thinking on this parallel network of microclimate sensors to complement the global weather station network.
Our selection algorithm exemplified for France, with 453 suggested measurement locations on the left, and distribution of these locations (red dots) in the environmental space of France on the right, exemplified for elevation, the Topographic Roughness Index (the complexity of the terrain), and FAPAR (the amount of light absorbed by plants, a proxy of how green the area is).
SoilTemp
With the global SoilTemp-network, we made a great start in that regard, bringing together microclimate data from over 13.000 sensors from over 60 countries. The algorithm proposed here can however help us to switch gears even more, and design these networks specifically with microclimate measuring and global and regional coverage of microhabitats in mind.
We also already have a first example to showcase their approach: the new citizen science project ‘Nosy parkers in the garden’ ( www.curieuzeneuzen.be/home-en) has used it to select gardens for their project on heat and drought impacts on lawns. In this large citizen science project, 4400 citizens were asked to install a mini weather station (‘the garden dagger’) in their garden to measure the impact of heat and drought on urban environments.
A microclimate sensor (little white dot in the grass) taking the heat of a forest clearing
Young bluebell (Hyacinthoides non-scripta) surrounded by flowers of yellow archangel (Lamium galeobdolon)
The common bluebell (Hyacinthoides non-scripta), the signature flower of the Hallerbos
Single bluebell flower surviving on a wetter spot, as indicated by the field of wild garlic (Allium ursinum)
A really wet patch of forest, with giant horsetail (Equisetum telmateia) in a field of wild garlic (Allium ursinum)
Wild garlic (Allium ursinum) in the Hallerbos flowers a bit later than the bluebells, yet this one was already in full bloom
A bumblebee visiting yellow archangel (Lamium galeobdolon)
A bumblebee visiting yellow archangel (Lamium galeobdolon)
Wild garlic (Allium ursinum)
Wild garlic (Allium ursinum)
Weirdly beautiful, the inflorescence of pendulous sedge (Carex pendula), typical for the wettest spots in the forest
Weirdly beautiful, the inflorescence of pendulous sedge (Carex pendula), typical for the wettest spots in the forest
A little stream in the Hallerbos, surrounded by endless fields of wild garlic (Allium ursinum)
The herb-paris (Paris quadrifolia), less common in the forest
Wild garlic (Allium ursinum)
Bluebells (Hyacinthoides non-scripta)
Weirdly beautiful, the inflorescence of pendulous sedge (Carex pendula), typical for the wettest spots in the forest
Another one from the wet plots: large bitter-cress (Cardamine amara)
Another one from the wet plots: large bitter-cress (Cardamine amara)
Young beech leaves, as soon as they are fully grown, spring in the understory is over
A beech forest without understory, most likely too dry and too acid for any survivors
A young beech seedling (Fagus sylvatica), looking nothing like a beech, yet everything like a tiny dancer
Young beech seedling (Fagus sylvatica)
Bluebells (Hyacinthoides non-scripta)
Bluebells (Hyacinthoides non-scripta)
Bluebells (Hyacinthoides non-scripta)
Mountain melick (Melica nutans), a grass in the most amazing green
Bluebells (Hyacinthoides non-scripta) in a rare patch of mountain melick (Melica nutans), a grass in the most amazing green
Bluebells (Hyacinthoides non-scripta)
Bluebells (Hyacinthoides non-scripta)
Montpellier 2017
The entrance to the cathedral of Montpellier
The cathedral of Montpellier
The entrance to the cathedral of Montpellier
The cathedral of Montpellier
Narcissus poetics
The cathedral of Montpellier
The botanical garden of Montpellier
The botanical garden of Montpellier
The botanical garden of Montpellier
Brackish Camargue vegetation
Brackish Camargue vegetation
Brackish Camargue vegetation
A typical lagune
Brackish Camargue vegetation
Camargue horses
Camargue horses
Camargue horses
Brackish Camargue vegetation
Brackish Camargue vegetation
Brackish Camargue vegetation
Camargue horses
Brackish Camargue vegetation
Little egret in the evening sun
Flamingo’s in the evening sun
A typical lagune
Dandelion fuzz
Grass lily
Grass lily
Dandelion fuzz
Veronica in a sea of poplar fluff
Euphorbia in a sea of poplar fluff
Poplar
Gare du Midi, Brussels
Gare du Midi, Brussels
Gare du Midi, Brussels
Gare du Midi, Brussels
Sweden autumn 2016
Autumn in Abisko
Yellow leaves of mountain birch, with lake Torneträsk in the background.
Lapporten, the gate to Lapland, in Abisko
Rain blowing over the Abisko National Park
The colours of the north: red fireweed and yellow mountain birches, with lake Torneträsk on the background
Yellow leaves of mountain birch, with lake Torneträsk in the background.
Rain on the background, the ski lift in Abisko on the foreground
The steep slope of mount Nuolja on a dramatic looking morning
The beautiful colors of lake Torneträsk in Abisko
A little stream on top of the mountain, with a view on Lapporten, the gate to Lapland
Well, that is a beautiful table with a nice view on lake Torneträsk in Abisko
Our little experiment on top of the mountain in Abisko, with a view on Lapporten
Autumn in Abisko is extremely colorfull
The ski lift with a view on Abisko National Park and Lapporten
Hiking dowhill towards lake Torneträsk
This green is greener than the greenest green: moss on top of mount Nuolja
Well, that is a beautiful table with a nice view on lake Torneträsk in Abisko
The ski lift with a view on Abisko National Park and Lapporten
The ski lift with a view on Abisko National Park and Lapporten
The most beautiful hiking trail of the world: Nuolja in Abisko
Angelica archangelica, often the biggest plant of the Arctic
The most beautiful hiking trail of the world: Nuolja in Abisko
Cirsium helenioides, the melancholy thistle
Hiking down mount Nuolja
The steep slope of mount Nuolja on a dramatic looking morning
The colours of the north: red fireweed and yellow mountain birches, with lake Torneträsk on the background
The prettiest yellow and blue: autumn in Abisko
Fireweed, Epilobium angustifolium
Campanula or bellflower, I think ‘uniflora’
Vaccinium myrtillus
Cornus suecica, the prettiest red of the world
Hieracium alpinum, alpine hawkweed
Carex atrata, one of my favourite sedges
Alpine clubmoss, Diphasiastrum alpinum
Agrostis capillaris, bentgrass
Common yarrow (Achillea millefolium)
Anthoxanthum odoratum, sweet vernal grass, fully grown and mature
Snow scooter trail
Our plot in the mids of a field of horsetails (Equisetum pratense)
Equisetum pratense
Cliff overlooking the valley with the road to Norway
Seedling of Taraxacum officinale, the dandelion, after two years of growing in bad conditions
Poa alpina, the alpine meadow-grass, with its viviparous seeds
Massive flowerhead of Angelica archangelica
Angelica archangelica
Blueberry (Vaccinium myrtillus) in autumn
A lowland marsh in Abisko in autumn
Installing the plots of our trail observations on top of mount Nuolja
Installing the plots of our trail observations on top of mount Nuolja
Tanacetum vulgare (Tansy), non-native for the high north
Autumn forest down in the valley
The valley of Nuolja to Björkliden
Summer on the Nuolja-side
A full rainbow behind mount Nuolja in Abisko
It’s raining in the west, clouds trapped behind the mountains
A strong wind blowing rain from behind the mountains to our side
A strong wind blowing rain from behind the mountains to our side
Betula nana, the dwarf birch, mini autumn forest
Betula nana, the dwarf birch, mini autumn forest
The valley of Björkliden in autumn
The valley of Björkliden in autumn
The valley of Björkliden in autumn
The valley of Björkliden in autumn
Sweden spring 2016
Silene acaulis
Oxyria digyna
Melting snowpatch on a lake
Although the alpine zone has been harder for invasives to access than most places, human structures like trails are often an easy gateway for the invaders to get up there. Picture from Abisko, Swedish Lapland.
Eriophorum vaginatum
Bartsia alpina
Ranunculus glacialis
Ranunculus glacialis
Rubus arcticus
The valley of the lakes
Dryas octopetala
Cornus suecica
Overlooking the valley of Laktajakka
Silene suecica
Salix reticulata
Trifolium pratense
Western European species like the red clover (Trifolium pratense) here are often listed as non-native species in mountain regions.
A rainy hike
Trifolium repens
Amiens
View from my office window
Enjoying silence and the morning sun
Maria without a shirt
House on the square before the cathedral
Colourful mirror
Sunny but cold, the Quai Bélu
Gargoyle planning to eat the cathedral
Frozen mirror
Cathedral at night
Cathedral at night
Frozen to the bone
Almost cold enough for ice-skating
Just outside of Amiens
Cathedral at night
Le Club d’Aviron in winter weather
Nice architectural curve
Amiens is filled with cute little houses
Cathedral with a glimpse of spring
Cold!
The museum behind the beautiful gates
Cathedral seen from the frozen Parc Saint-Pierre
View from my office window
Cathedral at night
Sun rising above the water
Winter sun on the Place du Don
Sunny but cold, the Quai Bélu
The southern side
Sweden autumn 2015
Lichen
Sweden summer 2015
View on the 1000 meter plots
Doing research on a cold Arctic morning
Plots flooded by the snowmelt
Flooded by the snowmelt
Meltwater river, racing down the mountain
After a hike, even the most basic house looks cosy. Little hut in the mountains, open for everybody
Snowbridge, maybe don’t cross…
Snowbridge
View from a cliff
Silene acaulis or cushion pink, cutest plant of the Arctic
Two seasons in one image
Steep slope
Hiking down
Narvik Kirche, church of the subarctic
Narvik Kirche
Reindeer on top of the mountain
Narvik Kirche
Summer at the church
Summer flowers
Massive waterfall
Young willow catkins
View from Narvik’s hospital, with lilac flowers
Building a bridge over the fjord will gain al drivers at least an hour
Norwegian fjord
Posing with the water, getting soaked
Minimalistic mountains
Insect investigating our reindeer antler
Catching mosquitoes with our license plate, harvest of the year!
Posing with the plot
Fieldwork on the most beautiful spot of the world
Fieldwork on the most beautiful spot of the world
Summer bridge – still next to the sadly impassable river
Rhinanthus flower in the mountains
Plateau in the valley, beautiful brown
Experimental view from my favourite plot
Salix catkins
Extremely old Betula tree
Waterfall from a cliff
Buttercup is the earliest in spring, here
Rocks!
Alpine views
Views!
Fieldwork
Jumping over rivers
Plot
Golden plover
Angry lemming
Green, the whole north is green!
Snow, so much snow left!
Minimalistic mountain moments
Fieldwork
The research center
Red clover – focal invader
Look at this tiny cute snail!
Massive floods of melting water
Bartsia alpina
Hooray, a toilet!
Dryas octopetala
Lowest elevation plots
Butterball!
That’s a lot of water
Midnight sun is the best
At the lakeside
Beautiful Bistorta vivipara
Don’t fall in the water
Midnight sun
Wild river
Art – made by ages of wild rivers
Baby firework for America’s independence day
Midnight sun at the lake
The Abisko canyon was wilder than ever
That’s a crazy amount of water!
The Abisko canyon was wilder than ever
The Abisko canyon was wilder than ever
Black and white
Stone-man overlooking Abisko
Nothing as soft as a willow catkin
Label and soil temperature sensor attached
I’d drive to the top every day
Reflections
Rocks and clouds
Brave little birch
Brewing our camping poison
Basic camping stuff
Camping in Norway
Home-made temperature houses
Roadside research at its best
Norway is crazy
Horsetail is so funny
Little creek in magical forest
Birches, birches everywhere
Beautiful rock, a gift from the river
Another roadside fellow
Lichen
Ready to rock the summer
Collecting mosses
That’s a crazy old lichen
Tiny tiny piny trees, but old, so old!
Ready to jump into the fjord?
Ready to jump into the fjord?
That’s a spiky stone!
Views on Norwegian fjords
Silene in the mountains
Cute little orchid
Skua
Attacking skua, mind your heads!
Watch out for the attack of the fierce skua!
Black snail
New plot!
Still a lot of snow to melt, but this spot was free for a new plot
Reindeer are better than people
Two seasons in one picture
Let’s see what is happening to the balance in mountains! Is this a starting avalanche, or will it last a bit longer?
Cute little hut
Climbing mountains by car
Softest moss in history
Drosera in the marsh
Hiking in no-man’s land
The clouds are coming
Abisko valley
‘Butterball’
Fieldwork in the tundra
Abisko valley
Little plot
Clouds and sun and mountains
Making soup on a campfire with a view
Little creek on high elevations
Skua on the look-out
Melting snow in a river
Rhodiola rosea and the Törnetrask lake
Beginning of spring
Flooded plots, melting snow, impassible wetness
Ferns and horsetails
Chile 2015
Trips to the field sites were sometimes a real adventure, especially right after snowmelt
Lunch made by our local colleague, with funny bread (tasty as well!)


")


")
")


")


")


")


")


")


