This week, we are kicking off season two of our citizen science campaign! 3000 die-hard participants (from the 4400 we had last year), will again install a garden dagger in their garden to monitor extreme weather events across summer.
So how is the weather looking at the start of this second season? For this, we can take a look at the sensor in the garden of CuriousNoses scientist Jonas Lembrechts, who keeps track of temperature and soil moisture in his backyard all year round (originally posted in Dutch on the website of the project).
‘This particular sensor works offline, which means that it has no connection to the Internet of Things but I have to go and read it periodically with a special device to retrieve the measurement data,’ Jonas said. ‘This kind of offline TMS-4 sensor is also used in the international SoilTemp network I am involved in. They collect climate data in the most remote places, from Congo to Antarctica. But also in my garden!
So during the past winter months, the sensor has been faithfully monitoring the temperature and soil moisture in his garden in Zemst. If we look back at the first three months of this year, we see that they were quite similar in terms of temperatures to what we got at the beginning of last year. Remarkable is the very warm New Year’s period at the beginning of 2022, where the soil temperature rose to as much as 9°C.
Temperature patterns in the soil in one garden in Zemst, comparing 2021 (black) with 2022 (orange)
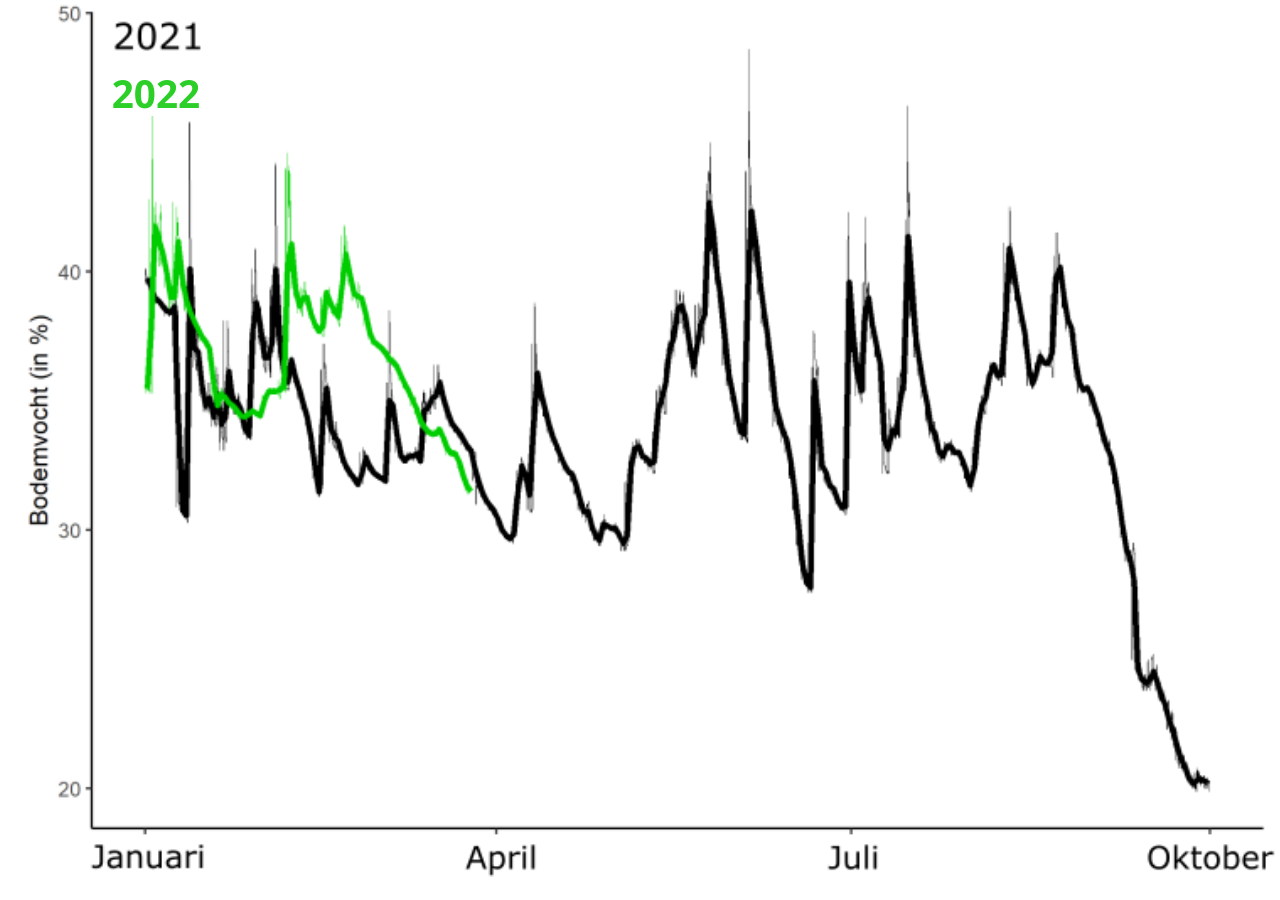
Despite the dry and sunny weather of recent weeks, soil moisture also still seems to be at a reasonable level for the season. This is largely due to the fact that our lawns do not yet consume much water in early spring, thus tapping much fewer of the resource. Nevertheless, the stubbornly declining green line does stand out in the figure: the soil has not received a solid rainfall for a few weeks now. No surprise: March was record-breakingly sunny in Belgium!
Soil moisture patterns in the soil in one garden in Zemst, comparing 2021 (black) with 2022 (green). Note the steady decline throughout March 2022, a record-breakingly sunny month
“We are thus starting this measuring season in my lawn with a healthy soil moisture,” Jonas explains. “But since we are measuring the moisture in the upper part of the soil here, these values can change very quickly in a hot, dry summer.” For the soil moisture in their own garden, participants will have to wait a little longer: the soil sensor always needs to settle for a few weeks to get good contact with the soil.
Heaps of soil in the sun, that is our view this week!
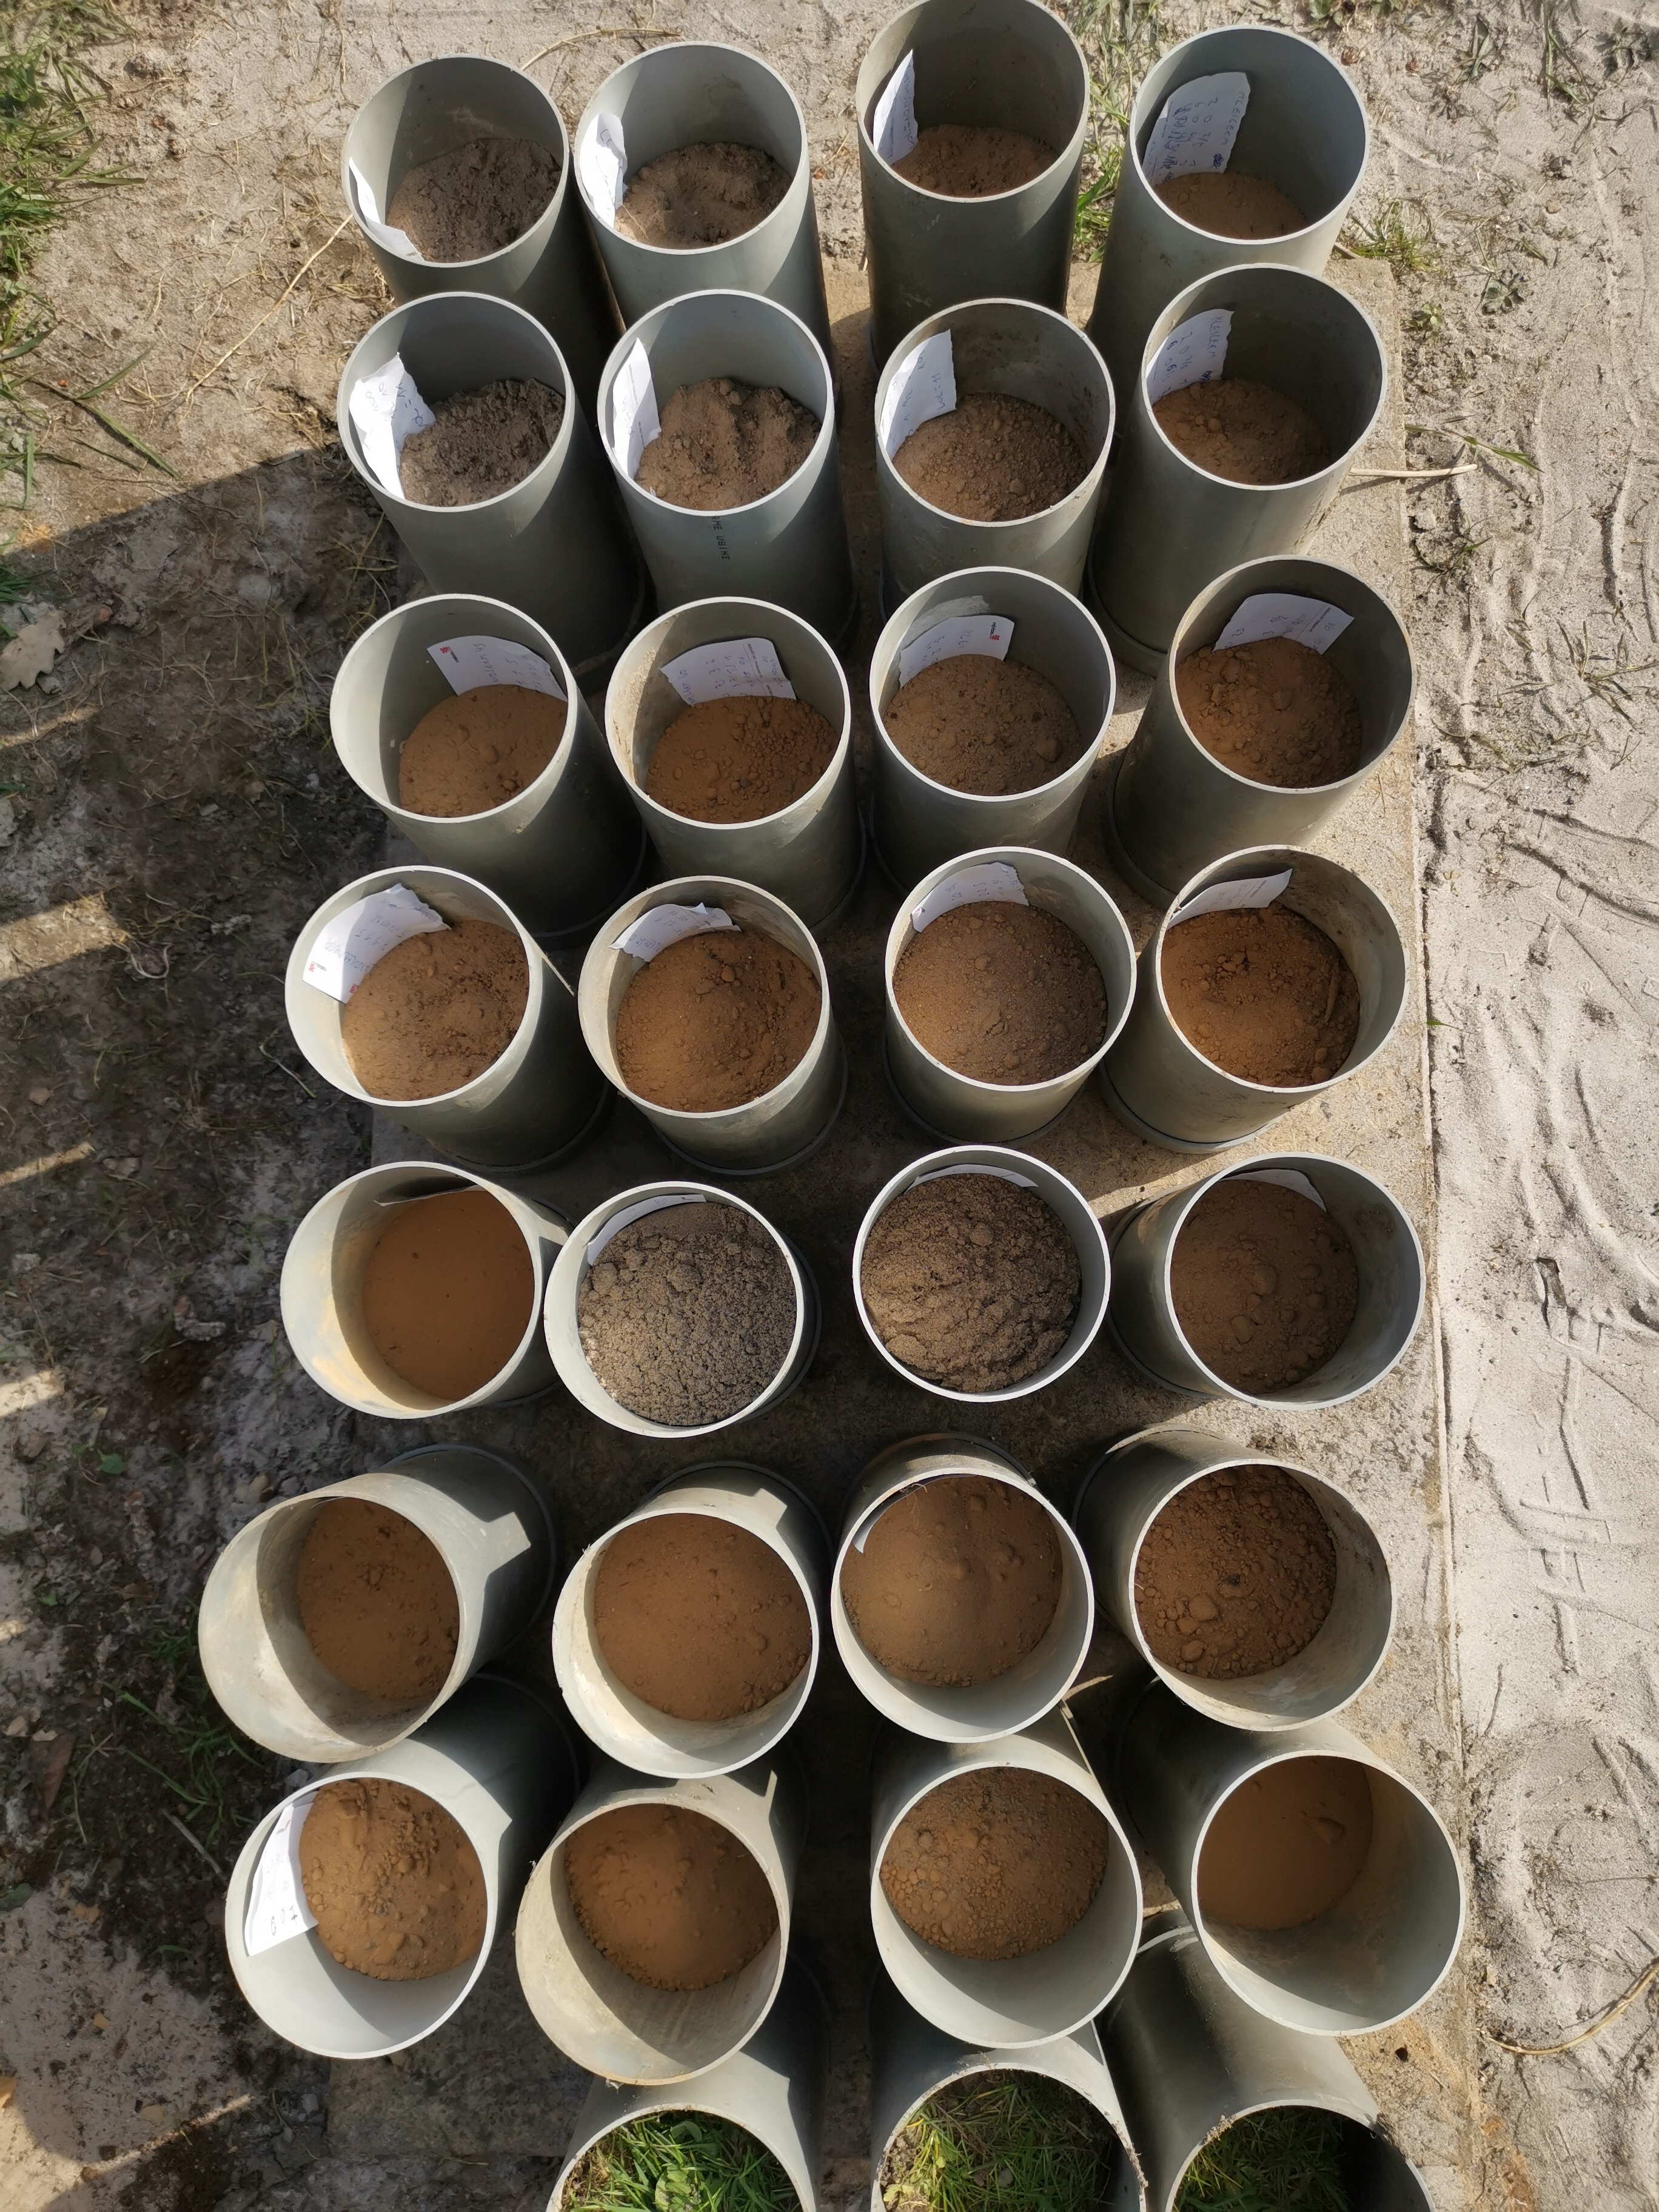
A pile of highly sandy soil, which will be mixed with various amounts of pure silt and clay to create a range of soils.
We are starting a little sensor calibration experiment, where we create a variety of soils as we find in our garden experiment across Flanders to test the soil moisture sensor of our garden dagger in.
Transporting the experimental pots to our drying chambers, where they will be wetted and left to dry, while we track their soil moisture
The idea is to test how the raw measurements from the sensor (counting electromagnetic fluxes through the soil) can be converted into actual soil moisture measurements in different soil types.
Such conversions exist and are provided by the developers of the sensor, but we were eager to test this for ourselves, to get a better understanding of how the sensor work, to get a calibration specifically for the range of conditions in our project, and to potentially contribute to that global classification.
Master student Jens will spend the coming weeks installing sensors in these pots, monitoring them and analyzing the soils.
Getting pure (and world-famous) ‘Boomse clay’ at the quarry of the local rooftile company
Case in point that community science has so much more dimensions than we’re used to: we now have our ‘garden dagger’ microclimate sensor turned into chocolate! A tasty treat to all participants of the citizen science project who join us for the second season of monitoring.
Are we playing it dirty to pump up the love for science? Maybe! Will the participants be extra enthusiastic to take good care of their sensor over the coming summer? Definitely!
But this fits in perfectly with our philosophy that science needs to be close to the community, especially when the scientific topic of interest is so close to the community itself, as here: private gardens.
Sensor consumption ongoing
In any case, stay tuned for how our new measurement season enfolds!
We’re going to have to talk about snow. Snow is fabulous, it is unique, it is beautiful. But it also turns ecological processes and principles on their head: snow accumulation determines ground temperature, light conditions and moisture availability during winter. It also affects the start and the end of the growing season, and plant access to moisture and nutrients. And that critical role, which can give ecologists a bit of a headache, as snow is also highly elusive, and very tricky to measure (and not only because it is SO COLD to go out to measure in the Arctic tundra in winter).
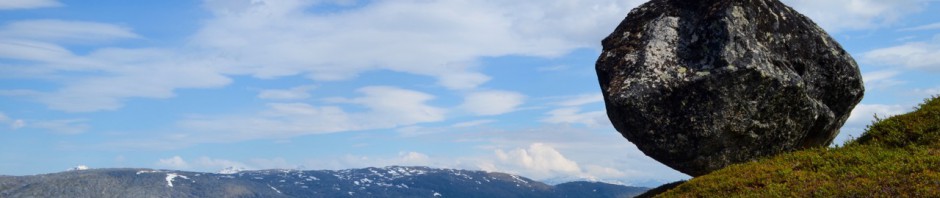
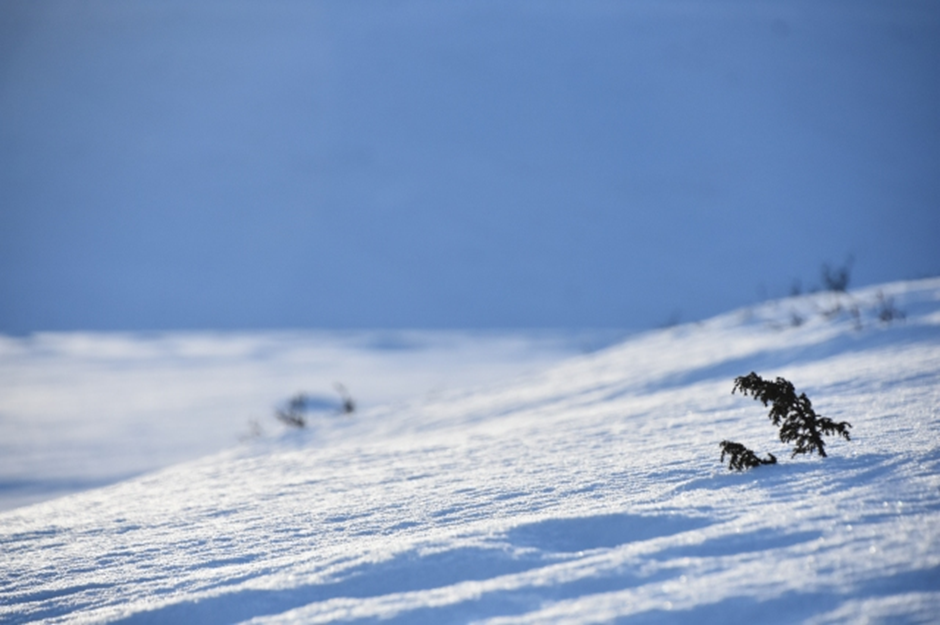
While a blanket of snow often looks like it softens all the edges, this smoothing is far from true from an ecological perspective, especially not at the beginning and the end of the snowy season. Pictured: a sunny spring day in Iceland, just before the snowmelt takes off.
The number of studies on snow has increased considerably in recent years, yet we still lack a good overview of how altered snow conditions will affect ecosystems. In a recent review, spearheaded by Christian Rixen from the WSL Institute for Snow and Avalanche Research SLF in Davos, Switzerland – as the name suggests quite the experts on the matter – we tried for the first time to create such a comprehensive summary.
We provided a ‘state-of-the-art’ of what we currently know about the snow cover’s role for vegetation, plant-animal interactions, permafrost conditions, microbial processes and biogeochemical cycling. With topics ranging from snow effects on temperature (buffering frost, but shortening the growing season), over light (increasing reflection of light away from the earth, and darkening the vegetation underneath it) to moisture (meltwater can provide vital but also short-lived water sources), we paint a picture of how snow is often the defining factor in cold-region ecology.
Measuring temperatures above and under a rare winter snow cover in Belgium using a TOMST TMS4.
We also dive into the depths and complexities of what is happening (and will happen) with our tundra ecosystems as climate changes. Changes in snowfall and snow cover across the cold environments will be (and is) substantial, with both increases and decreases in amounts of snow. Effects of these changes are also not intuitive: less snow in winter may for example lead to colder soils as climate changes, as soils lose their insulating blanket. More snow in winter, on the other hand, generally has the opposite effect and causes warmer winter soils.
For a plant, it matters quite significantly if it spends the winter above or below the protective yet light-absorbing snow blanket.
Finally, we took a good look at the ways in which scientists are currently experimenting with snow effects. Interestingly, we found that experimental research aiming to manipulate snowmelt timing worked with much smaller changes in snowmelt than those observed over spatial gradients (e.g. across a mountain slope). Indeed, experiments managed to change snowmelt on average 7.9 days (when aiming for faster melt-out) or 5.5 days (when aiming for delays). On the other hand, spatial variation in snowmelt easily reached up to 56 days, ten times higher! Similarly, snowmelt timing in the same location over time on average differed 32 days. Additionally, great differences could be found depending on WHEN in the season snow was manipulated. Here again, the main conclusion is: snow is complicated, even to manipulate!
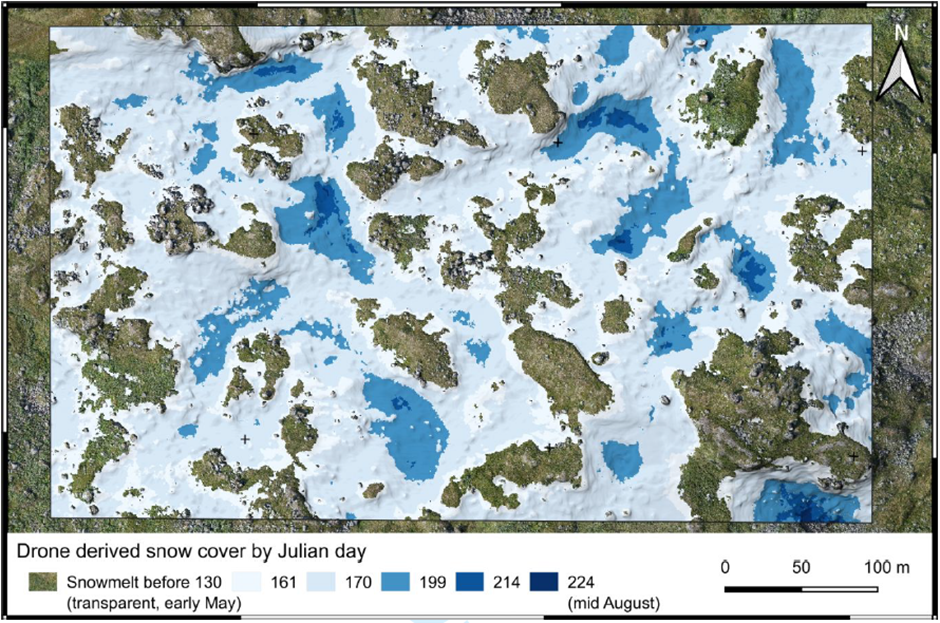
Spatial variability in snowmelt in a tundra landscape, showing the extreme variation in snowmelt dates (and thus the resulting differences in growing season length).
If we want to get a better hold of snow and its mysteries, we will have to ensure a better comparability between studies. In this review, we have taken the first steps in that regard, by providing an improved baseline for future studies of the influence of snow. Differences between snow study approaches need to be accounted for when one wants to generalize conclusions and, especially, when projecting snow dynamics and their impact into the future.
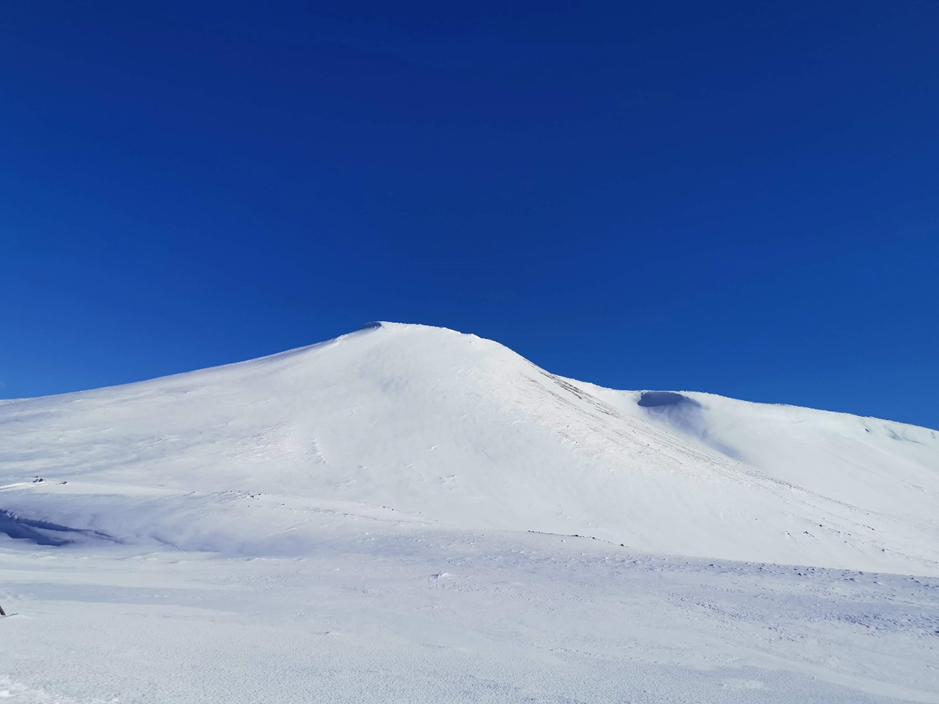
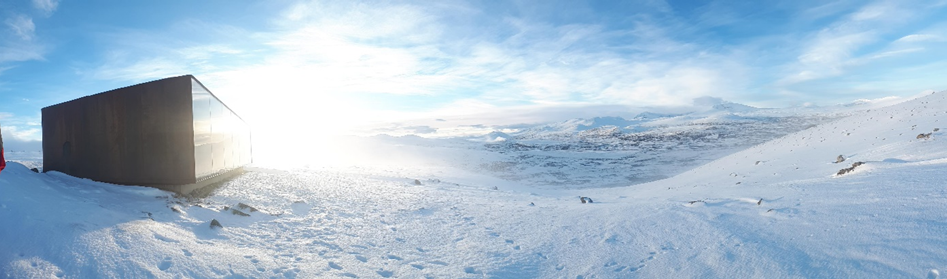
Snowy vista in Hjerkinn, Norway
Reference
Rixen et al. (2022) Winters are changing: snow effects on Arctic and alpine tundra ecosystems. Arctic Science. https://doi.org/10.1139/AS-2020-0058
It was the year 2005. A group of mountain ecologists gathered in Vienna, Austria, for what would turn out to be an appointment with history. Their topic? Plant invasions in mountains! A consensus was soon reached that there was an important research gap to fill. While the overall view was, up till then, that mountains had been spared from invasion by non-native plant species, global change and increasing land-use pressures in mountains across the globe were rapidly changing that reality. However, there was very little global information on these patterns, with only a fairly recent regionally scattered literature emerging. Time was ripe, so they decided on a globally coordinated protocol. The Mountain Invasion Research Network (MIREN) was born.
The next year, the team gathered again in Oregon, and it is there that the MIREN road survey protocol saw the light of day. The idea was to monitor non-native plant species along mountain roads, with a standardized survey design in the form of a T, and repeat that survey every five years – till eternity, so one might hope – to get the critical baseline information on how quickly non-native species are spreading along mountain roads.
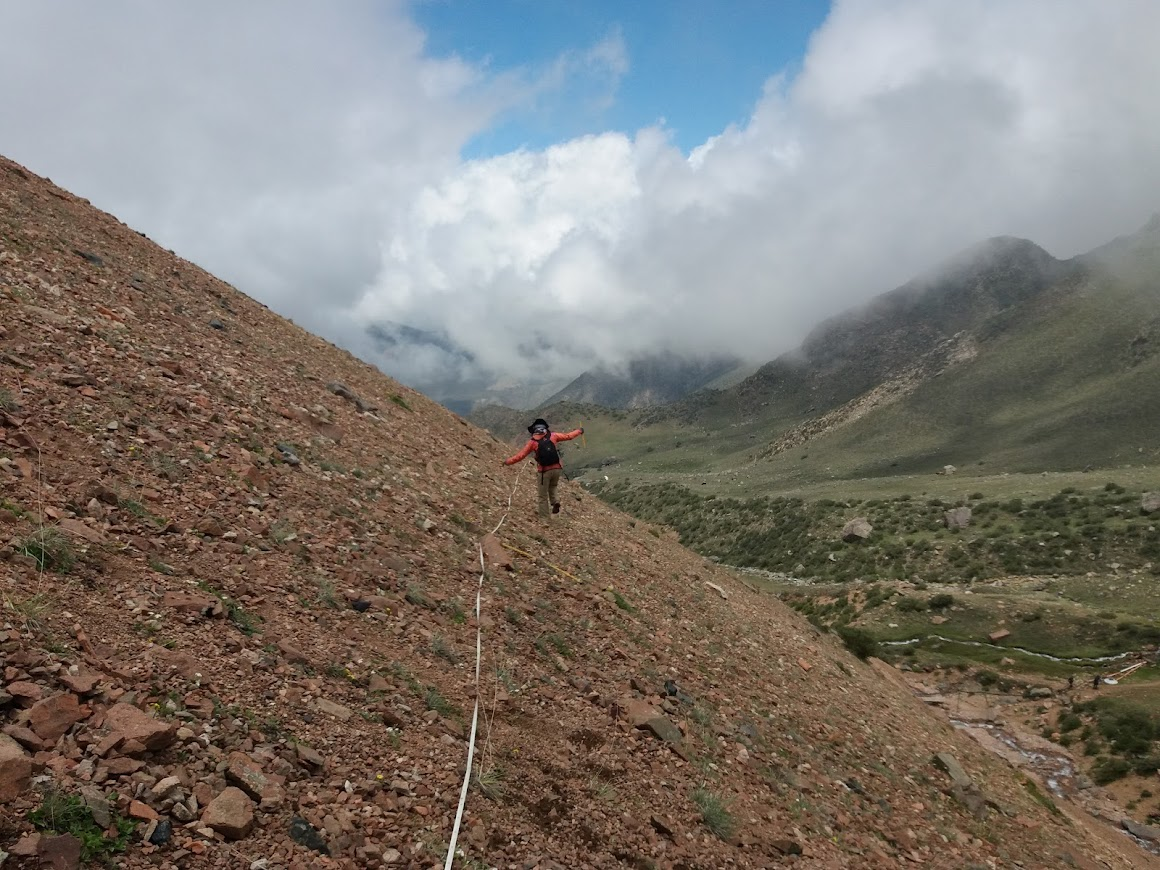
MIREN road survey in action on a steep slope in the Argentinean Andes near Mendoza. Picture by Maika Bilbao
Soon after, the protocol got expanded, and now it includes native species as well, allowing the study of range shifts of all plant species along elevational gradients, and the impacts of climate and roads on these, over time. In a recent paper, published in the open access journal Ecology & Evolution, we finally present the survey methodology and the summary of achievements to the world, hoping that it can become a standard monitoring tool in mountain regions across the globe.
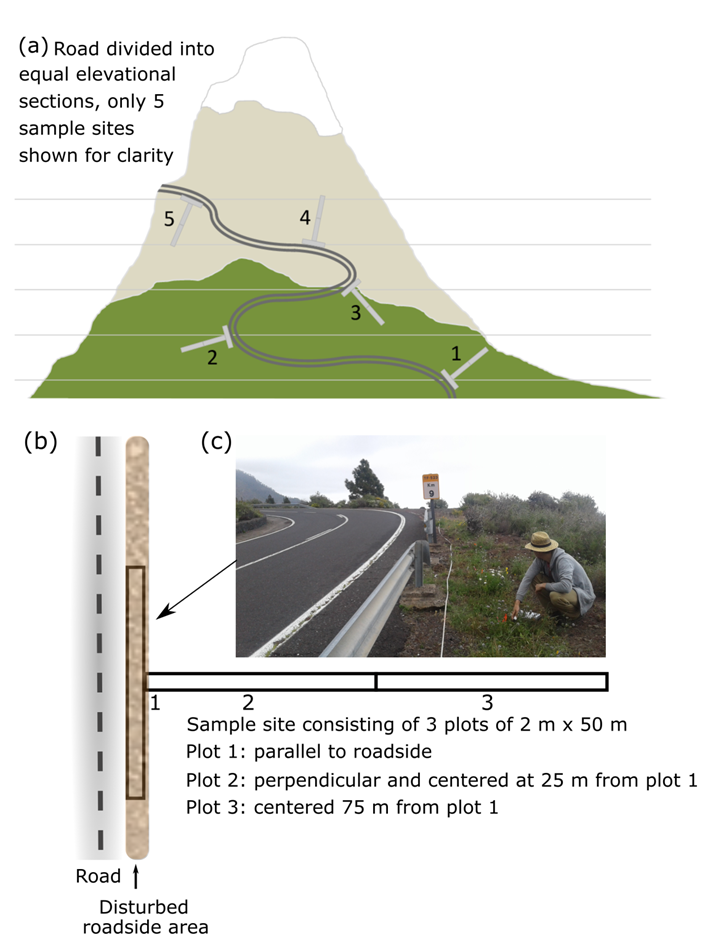
What we present is a conceptually intuitive and standardized protocol developed by the Mountain Invasion Research Network (MIREN), designed to 1) systematically quantify global patterns of native and non-native species distributions along elevation gradients and 2) shifts in these distributions arising from interactive effects of climate change and human disturbance. Usually repeated every five years, surveys consist of 20 sample sites located at equal elevation increments along three replicate roads per sampling region. At each site, three plots extend from the side of a mountain road into surrounding natural vegetation, in the characteristic T-shaped design. In each of these plots, presence, cover and abundance of all vascular plant species are noted down.
Layout of the MIREN survey design. (a) Equal elevational distribution of 20 sample sites along a mountain road, of which three are selected in each region; (b) Each sample site consists of 3 plots of 2 m x 50 m, plot 1 – parallel to the roadside (starting at the first occurrence of roadside vegetation), plot 2 – centred 25 m from the roadside plot, plot 3 – centred 75 m from the roadside plot; (c) exemplary photograph of monitoring a mountain roadside in Tenerife, Canary Islands, Spain, depicting a survey of plot 1.
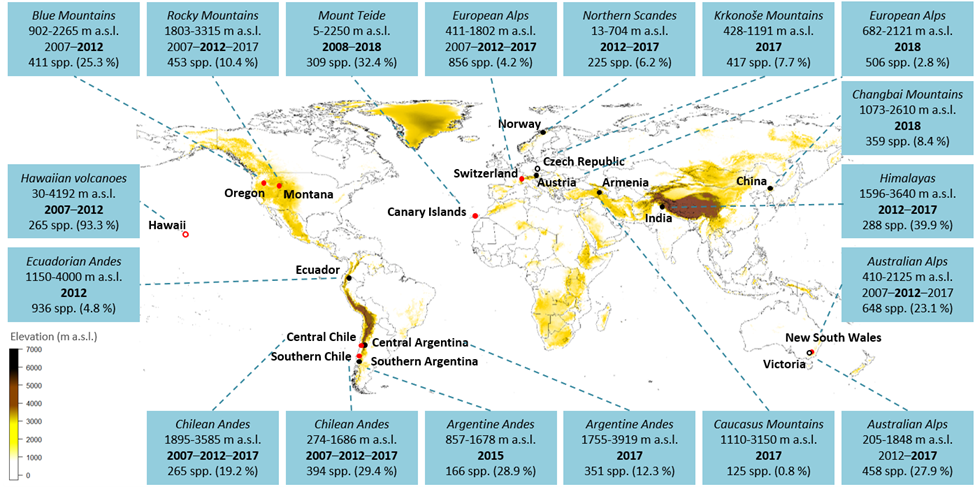
The protocol has been successfully used in 18 regions worldwide from 2007 to the present. So far, analyses of the data already generated salient results, both in regional studies and global assessments. For example, we found region-specific elevational patterns of native plant species richness, but a globally consistent elevational decline in non-native species richness. Non-native plants were also more abundant directly adjacent to road edges, suggesting that disturbed roadsides serve as a vector for invasions into mountains. From the upcoming analyses of time series – in some regions we now have three timesteps, over a 10 year period, and the 4th one will be collected this year – even more exciting results can be expected. Indeed, as the covered time frame gets longer, our assessment of species range changes will further improve.
Regions worldwide participating in the MIREN vegetation survey along mountain roads. Red symbols indicate the founding regions from the first survey in 2007. In regions with unfilled symbols, only roadside plots, but not intermediate and interior plots in natural vegetation were sampled. For each region, the name of the mountain range, the sampled elevation gradient and the year(s) of sampling are given. Years in bold indicate that both native and non-native species were recorded, while in years with normal font only non-native species were recorded. Note that some regions did not follow the 5-year sampling frequency. In the last row, the total number of species and, in parentheses, the proportion of non-native species are summarized.
Think all of this sounds fun and important? Perhaps you can join us!
Implementing the protocol in more mountain regions globally would help to generate a more complete picture of how global change alters species distributions. By publishing our protocol for all to read, we hope to enthuse the global ecological community to join forces with us and apply the protocol in your own region. With the MIREN protocol, you would have a unique tool in hand to monitor the impact of climate, climate change and anthropogenic disturbance on the vegetation in your mountain, with interesting patterns bound to emerge from the first sampling onwards. Feeding your data into our increasingly large database can then generate interesting comparisons about how your region compares to plant species diversity patterns in mountain regions across the world. This information can – and already does – inform conservation policy in mountain ecosystems worldwide, where some conservation policies remain poorly implemented.
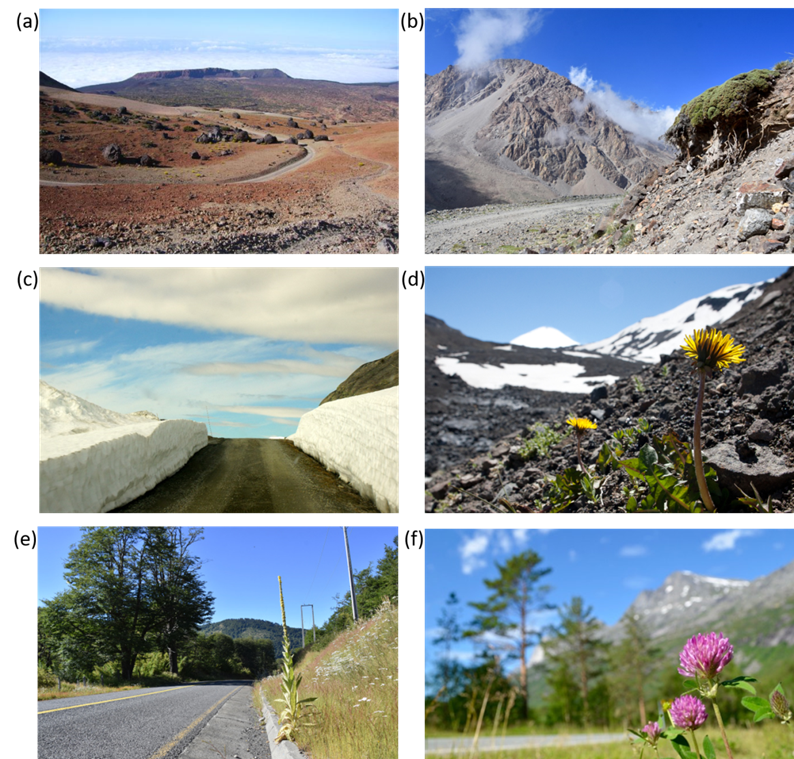
Examples of roads in the landscape (a-c) and key non-native species (d-f) across a range of MIREN regions. (a) Harsh mountain climates (here the Cañadas del Teide on Tenerife (Canary Islands, Spain) have traditionally been seen as an adequate barrier against non-native plant invasion; (b) the direct local impact of roadside disturbance on mountain plants is visible on native Azorella cushion plants along a road in the dry Andes near Mendoza, Argentina; (c) interactive effects of climate and land use, exemplified by dramatic differences in snow cover on versus beside a mountain road in northern Norway; (d) Taraxacum officinale, one of the most widespread non-native plant species along MIREN mountain roads, in a sample plot on a volcanic gravel slope in the Argentine Andes; (e) non-native Verbascum thapsus on a roadside in the highly invaded lowlands of the Andes in central Chile; (f) Trifolium pratense in northern Norway, where the species is rapidly moving uphill along mountain roadsides.
If I had some ideas about the emerging challenges for vegetation science, they asked. I sure did! If I wanted to join a virtual workshop with 21 other early-career vegetation scientists to discuss those challenges? You bet!
It was a very ‘2020’ kind of thing the Young Scientists of the International Association of Vegetation Scientists (IAVS) proposed. As Covid had effectively brought social gatherings to a standstill, opportunities for scientific brainstorming as often happen over coffee-and-cake at conferences had taken a big hit. A blow for new scientific ideas and research avenues, for sure. The IAVS Young Scientists figured that this issue had hit the next generation of scientists the hardest: even in the best of times, it was hard for a young scientists to get their good ideas heard. Nevertheless, it is the young ones from now who would be answering the scientific questions of the future.
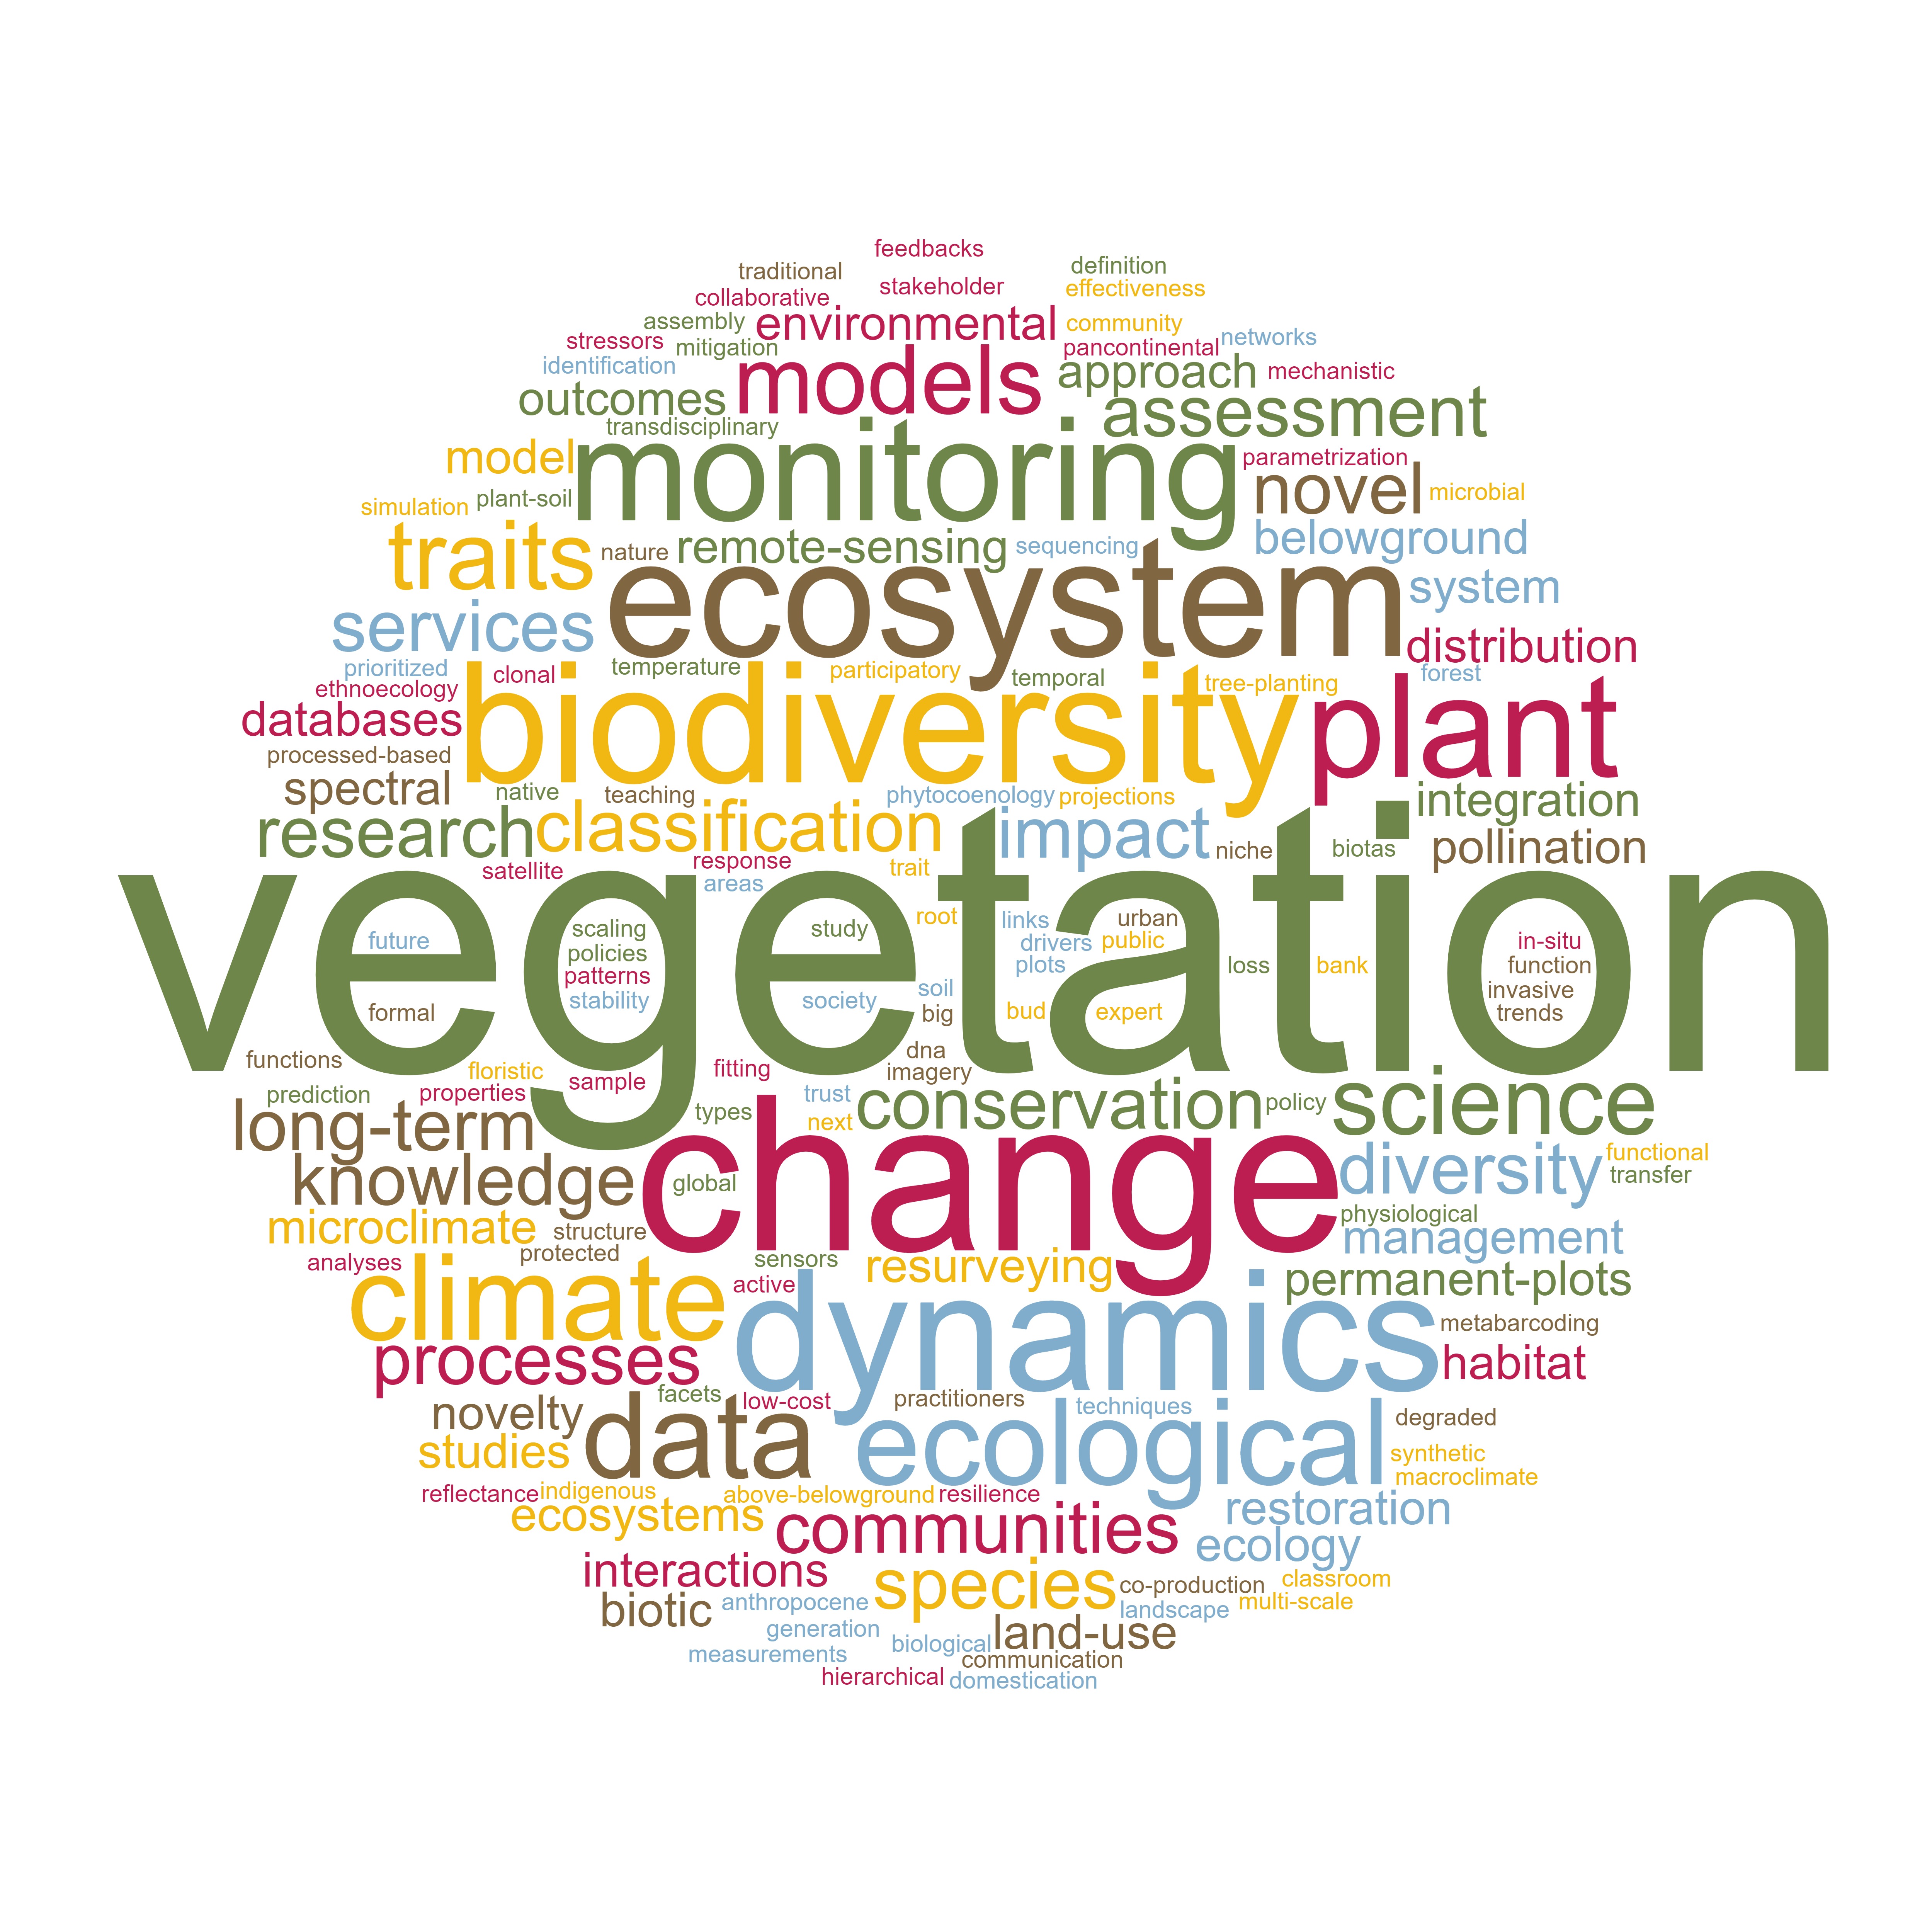
Now, we would let our voices and ideas be heard, pandemic or not! We gathered – on Zoom, of course – with 22 young and enthusiastic vegetation scientists from a wide range of backgrounds to perform our Horizon scan. Each of us submitted their own idea of what they thought was the next big research avenue for vegetation science, the sub-field of biology that studies the ecology of plant communities.
Word cloud of the recurring topics coming out of our horizon scan for vegetation science. ‘Vegetation’ is there, of course, but you can see terms like the ‘monitoring’ of ‘change’, the ‘dynamics’ and ‘climate’ pop out big, highlighting how vegetation science will increasingly have to move from what vegetation is and how it can be conserved, to what vegetation can be and can become in a rapidly changing world.
Our horizon scan took place in the form of a two-day online workshop held in October 2020. Of the 24 topics originally proposed and discussed by participants, 15 topics were ranked as the most emergent and impactful for vegetation science.
This week, the outcome of this fun two-day workshop got published in the Journal of Vegetation Science (where else would you want it, right?). In this contribution, we present the selection of 15 topics that were ranked by our workshop participants as the most emergent and impactful for vegetation science.
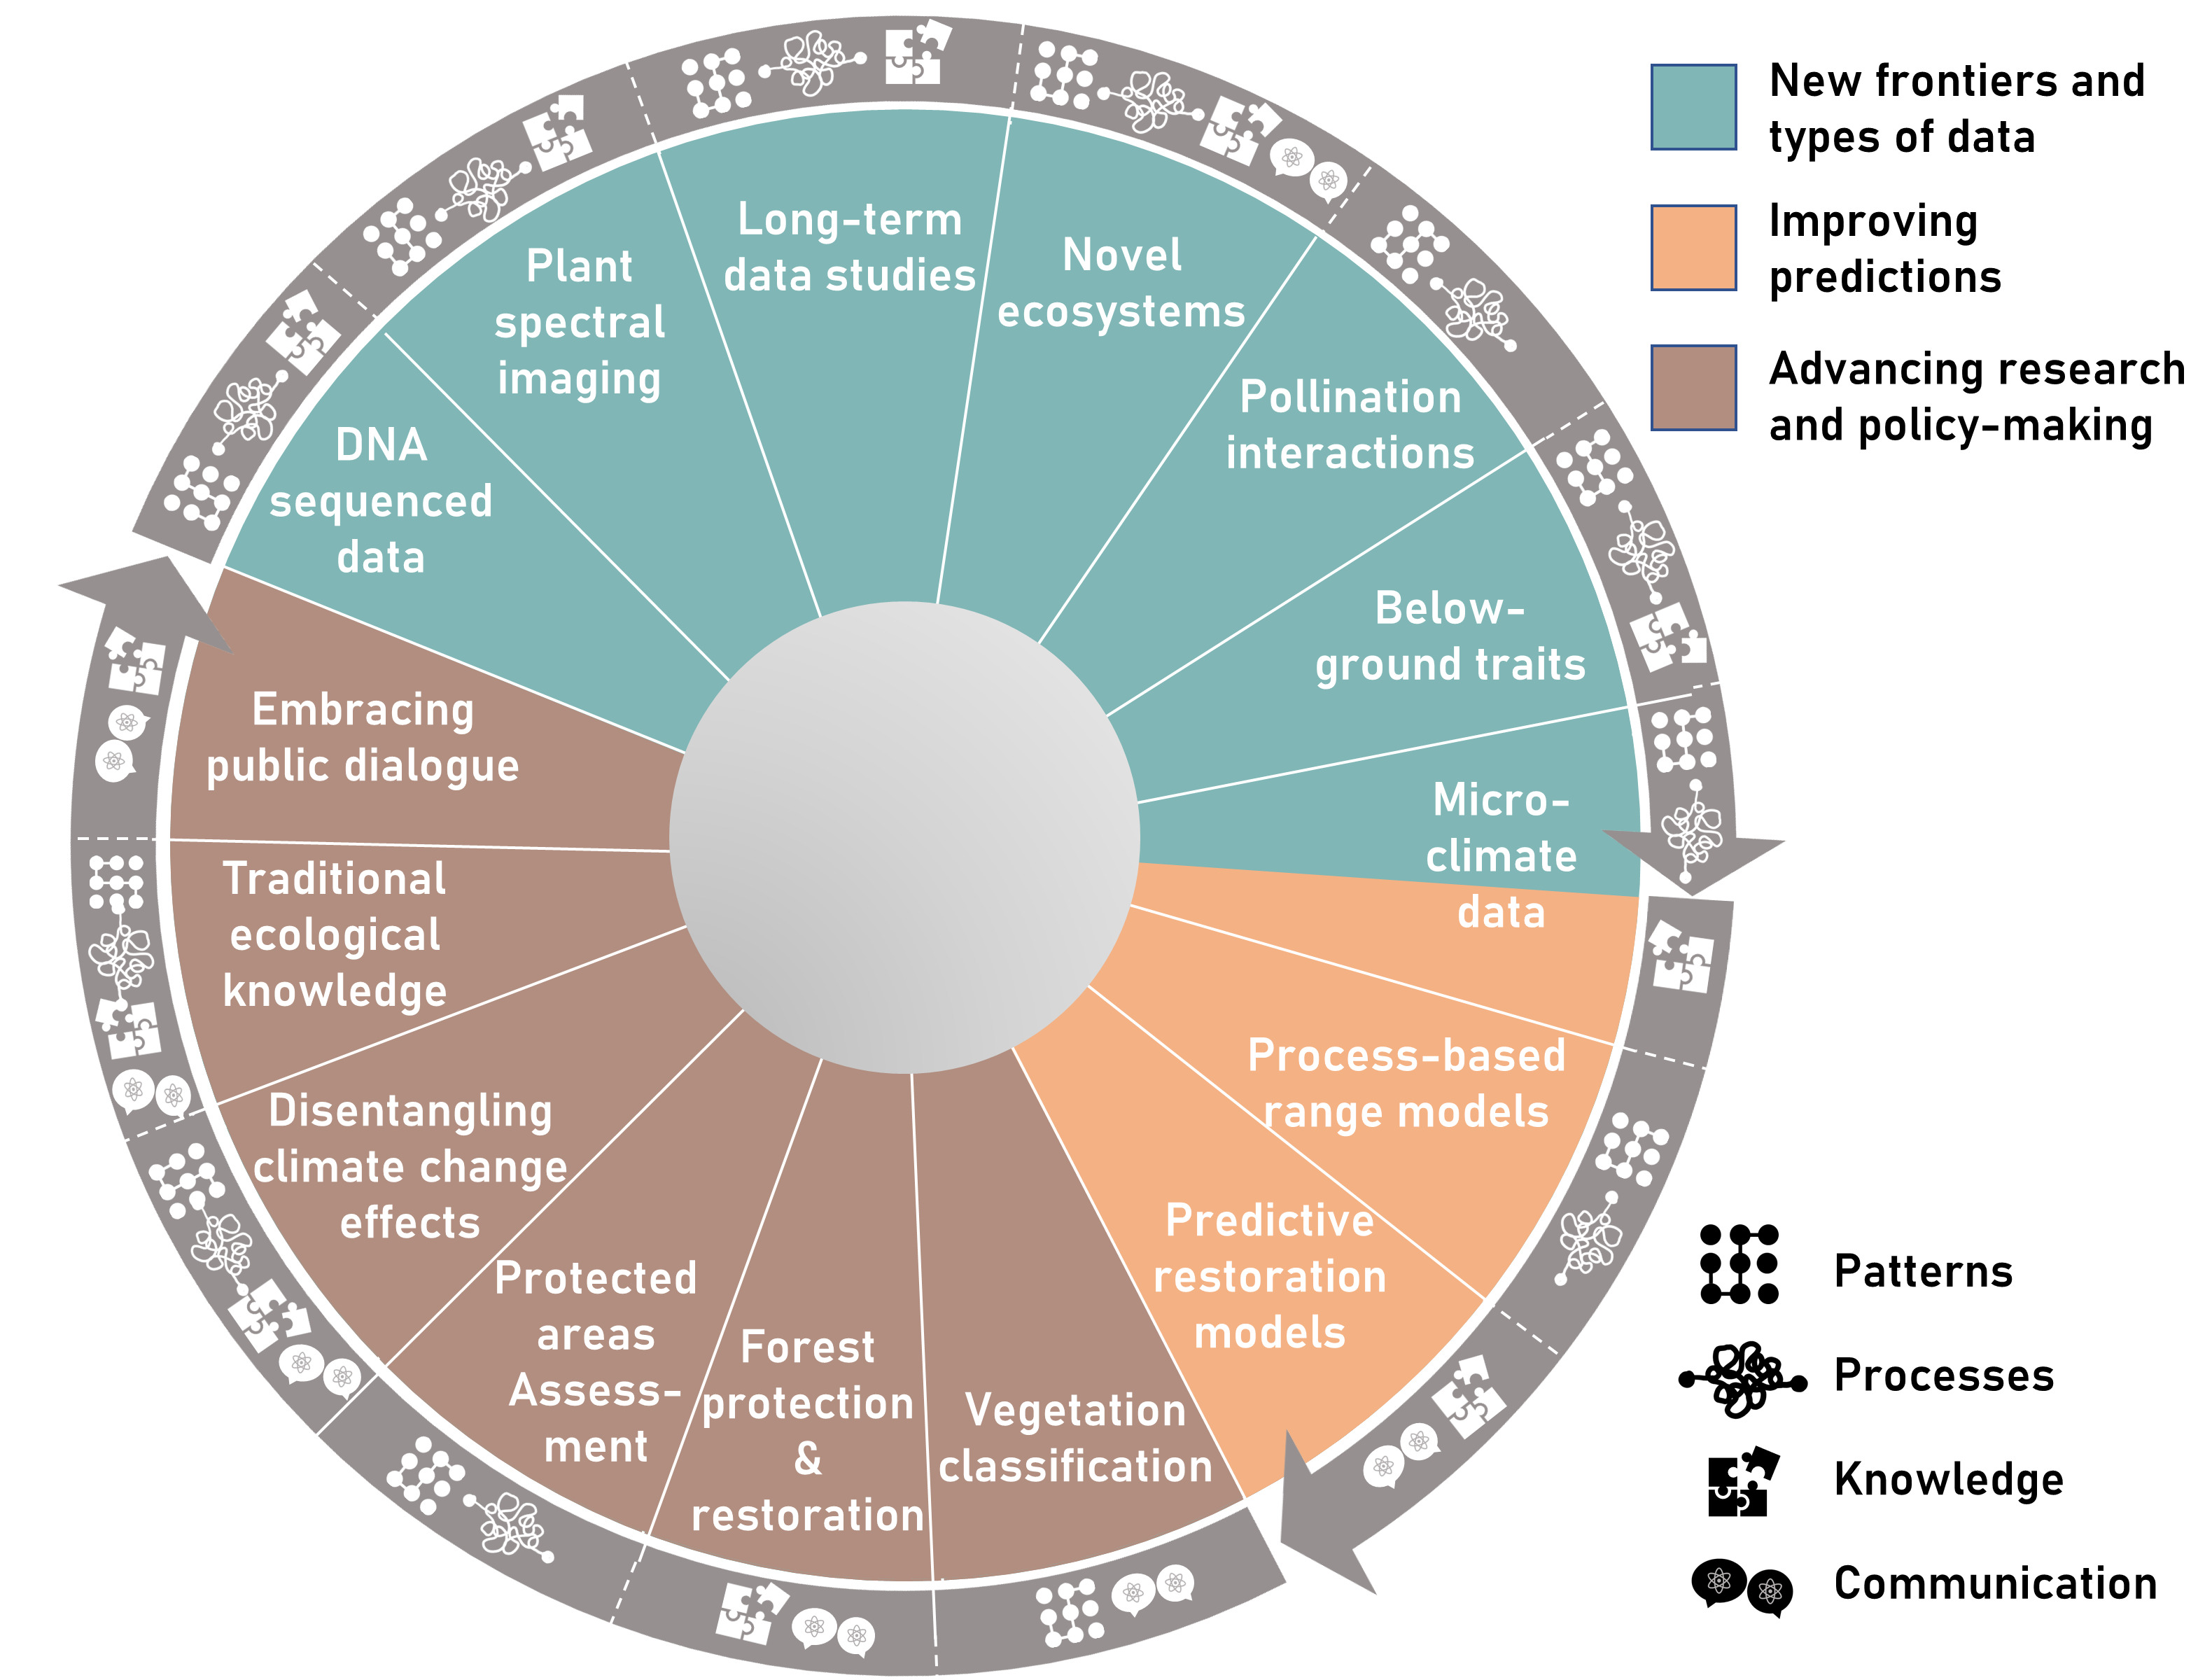
Fifteen topics considered to be emergent and most impactful by the horizon scan for vegetation science. Each topic was identified to contribute to at least two of the goals we recognized for the field (i.e.: to understand processes, describe patterns, integrate different knowledge systems and communicate science); the goals are represented as symbols (see legend in the lower right corner), so that the outer part of the graph shows, for each topic, its contribution in terms of specific goals. Different colours indicate the different ways that each topic can develop in the field (i.e., developing new frontiers and data types, improving predictions, or advancing research and policy-making).
The topics contain methodological tools such as next-generation sequencing, plant spectral imaging, process-based range models and resurveying studies, and permanent plots, which we expect will need to be integrated into vegetation science to lead it into the future.
Overarching, there is the looming impact of global changes, for which we stress the need to integrate long-term monitoring, the study of novel ecosystems, below-ground traits, and pollination interactions, and the creation of global networks of near-surface microclimate data.
Finally, we also emphasize the need to integrate traditional forms of knowledge and a diversity of stakeholders into research, teaching, management, and policy-making to advance the field of vegetation science, a research field that will more and more be intertwined with society as a whole as natural areas remain under pressure.
Much work to do, we believe, as nature is increasingly under pressure by climate and other global changes. We hope that our horizon scan can help identify the ways forward to tackle the issues that are and will come. But most of all, we hope it can become an inspiration, and energize ecologists and vegetation scientists, especially the young ones, with the knowledge that their work is of uttermost importance to save our planet.
The fern ‘Asplenium scolopendrium’ growing at the bottom of a large cave in France, a symbol of the complexity and resilience of vegetation
Reference: Yanelli et al. (2022) Fifteen emerging challenges and opportunities for vegetation science – A horizon scan by early career researchers. https://doi.org/10.1111/jvs.13119
Angelica archangelica along mountain road in the northern Scandes, Norway
Oenanthe oenanthe
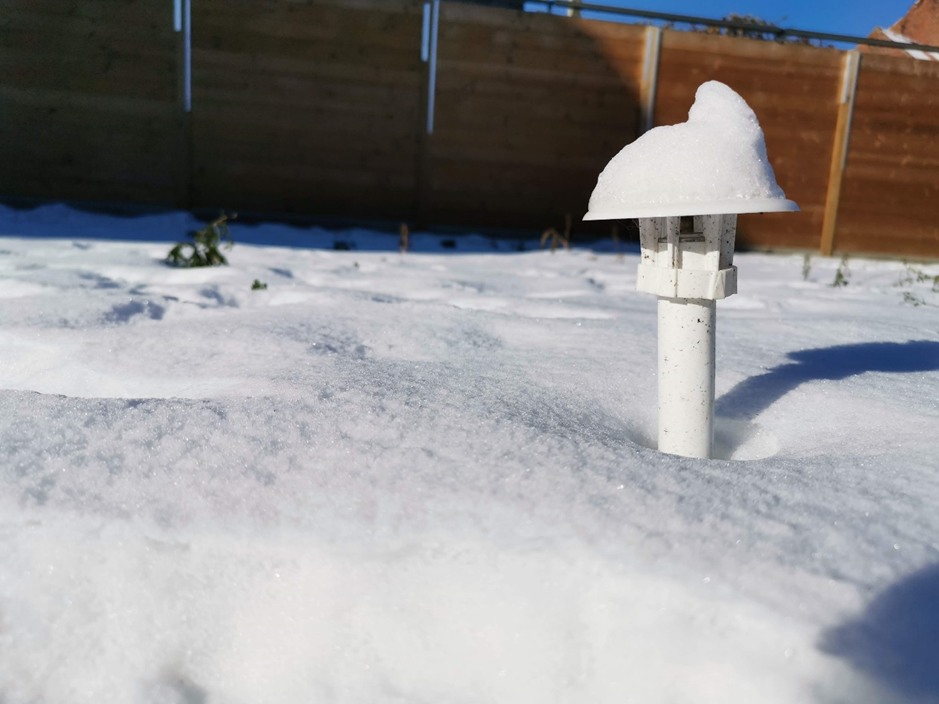
Little red-and-white lighthouse
Pinus sylvestris, Narvik, Norway
Narvik, Norway
Narvik, Northern Scandes, Norway
Lake Torneträsk, Abisko, Sweden
Luscinia svecica, Abisko, Sweden
Skjomen valley, northern Norway
Narvik, Norway
Trifolium repens
Eriophorum vaginatum
Lake Torneträsk, Abisko, Sweden
Norway, Narvik
Lake Törnetrask, Abisko Research Station, Abisko, Sweden
Summer in the Skjomen valley, northern Norway
Laktatjakka valley
Skjomen valley, northern Norway
Narvik, Norway
Lake Törnetrask, Abisko Research Station, Abisko, Sweden
Narvik, Norway
Common heather
Epilobium angustifolium
Phyllodoce caerulea
Luscinia svecica
Hallerbos 2017
Young bluebell (Hyacinthoides non-scripta) surrounded by flowers of yellow archangel (Lamium galeobdolon)
The common bluebell (Hyacinthoides non-scripta), the signature flower of the Hallerbos
Single bluebell flower surviving on a wetter spot, as indicated by the field of wild garlic (Allium ursinum)
A really wet patch of forest, with giant horsetail (Equisetum telmateia) in a field of wild garlic (Allium ursinum)
Wild garlic (Allium ursinum) in the Hallerbos flowers a bit later than the bluebells, yet this one was already in full bloom
A bumblebee visiting yellow archangel (Lamium galeobdolon)
A bumblebee visiting yellow archangel (Lamium galeobdolon)
Wild garlic (Allium ursinum)
Wild garlic (Allium ursinum)
Weirdly beautiful, the inflorescence of pendulous sedge (Carex pendula), typical for the wettest spots in the forest
Weirdly beautiful, the inflorescence of pendulous sedge (Carex pendula), typical for the wettest spots in the forest
A little stream in the Hallerbos, surrounded by endless fields of wild garlic (Allium ursinum)
The herb-paris (Paris quadrifolia), less common in the forest
Wild garlic (Allium ursinum)
Bluebells (Hyacinthoides non-scripta)
Weirdly beautiful, the inflorescence of pendulous sedge (Carex pendula), typical for the wettest spots in the forest
Another one from the wet plots: large bitter-cress (Cardamine amara)
Another one from the wet plots: large bitter-cress (Cardamine amara)
Young beech leaves, as soon as they are fully grown, spring in the understory is over
A beech forest without understory, most likely too dry and too acid for any survivors
A young beech seedling (Fagus sylvatica), looking nothing like a beech, yet everything like a tiny dancer
Young beech seedling (Fagus sylvatica)
Bluebells (Hyacinthoides non-scripta)
Bluebells (Hyacinthoides non-scripta)
Bluebells (Hyacinthoides non-scripta)
Mountain melick (Melica nutans), a grass in the most amazing green
Bluebells (Hyacinthoides non-scripta) in a rare patch of mountain melick (Melica nutans), a grass in the most amazing green
Bluebells (Hyacinthoides non-scripta)
Bluebells (Hyacinthoides non-scripta)
Montpellier 2017
The entrance to the cathedral of Montpellier
The cathedral of Montpellier
The entrance to the cathedral of Montpellier
The cathedral of Montpellier
Narcissus poetics
The cathedral of Montpellier
The botanical garden of Montpellier
The botanical garden of Montpellier
The botanical garden of Montpellier
Brackish Camargue vegetation
Brackish Camargue vegetation
Brackish Camargue vegetation
A typical lagune
Brackish Camargue vegetation
Camargue horses
Camargue horses
Camargue horses
Brackish Camargue vegetation
Brackish Camargue vegetation
Brackish Camargue vegetation
Camargue horses
Brackish Camargue vegetation
Little egret in the evening sun
Flamingo’s in the evening sun
A typical lagune
Dandelion fuzz
Grass lily
Grass lily
Dandelion fuzz
Veronica in a sea of poplar fluff
Euphorbia in a sea of poplar fluff
Poplar
Gare du Midi, Brussels
Gare du Midi, Brussels
Gare du Midi, Brussels
Gare du Midi, Brussels
Sweden autumn 2016
Autumn in Abisko
Yellow leaves of mountain birch, with lake Torneträsk in the background.
Lapporten, the gate to Lapland, in Abisko
Rain blowing over the Abisko National Park
The colours of the north: red fireweed and yellow mountain birches, with lake Torneträsk on the background
Yellow leaves of mountain birch, with lake Torneträsk in the background.
Rain on the background, the ski lift in Abisko on the foreground
The steep slope of mount Nuolja on a dramatic looking morning
The beautiful colors of lake Torneträsk in Abisko
A little stream on top of the mountain, with a view on Lapporten, the gate to Lapland
Well, that is a beautiful table with a nice view on lake Torneträsk in Abisko
Our little experiment on top of the mountain in Abisko, with a view on Lapporten
Autumn in Abisko is extremely colorfull
The ski lift with a view on Abisko National Park and Lapporten
Hiking dowhill towards lake Torneträsk
This green is greener than the greenest green: moss on top of mount Nuolja
Well, that is a beautiful table with a nice view on lake Torneträsk in Abisko
The ski lift with a view on Abisko National Park and Lapporten
The ski lift with a view on Abisko National Park and Lapporten
The most beautiful hiking trail of the world: Nuolja in Abisko
Angelica archangelica, often the biggest plant of the Arctic
The most beautiful hiking trail of the world: Nuolja in Abisko
Cirsium helenioides, the melancholy thistle
Hiking down mount Nuolja
The steep slope of mount Nuolja on a dramatic looking morning
The colours of the north: red fireweed and yellow mountain birches, with lake Torneträsk on the background
The prettiest yellow and blue: autumn in Abisko
Fireweed, Epilobium angustifolium
Campanula or bellflower, I think ‘uniflora’
Vaccinium myrtillus
Cornus suecica, the prettiest red of the world
Hieracium alpinum, alpine hawkweed
Carex atrata, one of my favourite sedges
Alpine clubmoss, Diphasiastrum alpinum
Agrostis capillaris, bentgrass
Common yarrow (Achillea millefolium)
Anthoxanthum odoratum, sweet vernal grass, fully grown and mature
Snow scooter trail
Our plot in the mids of a field of horsetails (Equisetum pratense)
Equisetum pratense
Cliff overlooking the valley with the road to Norway
Seedling of Taraxacum officinale, the dandelion, after two years of growing in bad conditions
Poa alpina, the alpine meadow-grass, with its viviparous seeds
Massive flowerhead of Angelica archangelica
Angelica archangelica
Blueberry (Vaccinium myrtillus) in autumn
A lowland marsh in Abisko in autumn
Installing the plots of our trail observations on top of mount Nuolja
Installing the plots of our trail observations on top of mount Nuolja
Tanacetum vulgare (Tansy), non-native for the high north
Autumn forest down in the valley
The valley of Nuolja to Björkliden
Summer on the Nuolja-side
A full rainbow behind mount Nuolja in Abisko
It’s raining in the west, clouds trapped behind the mountains
A strong wind blowing rain from behind the mountains to our side
A strong wind blowing rain from behind the mountains to our side
Betula nana, the dwarf birch, mini autumn forest
Betula nana, the dwarf birch, mini autumn forest
The valley of Björkliden in autumn
The valley of Björkliden in autumn
The valley of Björkliden in autumn
The valley of Björkliden in autumn
Sweden spring 2016
Oxyria digyna
Cornus suecica
A rainy hike
Dryas octopetala
Western European species like the red clover (Trifolium pratense) here are often listed as non-native species in mountain regions.
The valley of the lakes
Silene suecica
Eriophorum vaginatum
Salix reticulata
Although the alpine zone has been harder for invasives to access than most places, human structures like trails are often an easy gateway for the invaders to get up there. Picture from Abisko, Swedish Lapland.
Ranunculus glacialis
Ranunculus glacialis
Trifolium pratense
Melting snowpatch on a lake
Rubus arcticus
Trifolium repens
Overlooking the valley of Laktajakka
Bartsia alpina
Silene acaulis
Amiens
The museum behind the beautiful gates
Cathedral at night
Maria without a shirt
Sun rising above the water
View from my office window
Cold!
Frozen to the bone
Sunny but cold, the Quai Bélu
Enjoying silence and the morning sun
Cathedral at night
The southern side
Gargoyle planning to eat the cathedral
Sunny but cold, the Quai Bélu
Le Club d’Aviron in winter weather
Cathedral at night
Cathedral seen from the frozen Parc Saint-Pierre
Winter sun on the Place du Don
Cathedral with a glimpse of spring
Cathedral at night
Amiens is filled with cute little houses
Nice architectural curve
House on the square before the cathedral
Frozen mirror
Just outside of Amiens
Almost cold enough for ice-skating
View from my office window
Colourful mirror
Sweden autumn 2015
Lichen
Sweden summer 2015
View on the 1000 meter plots
Doing research on a cold Arctic morning
Plots flooded by the snowmelt
Flooded by the snowmelt
Meltwater river, racing down the mountain
After a hike, even the most basic house looks cosy. Little hut in the mountains, open for everybody
Snowbridge, maybe don’t cross…
Snowbridge
View from a cliff
Silene acaulis or cushion pink, cutest plant of the Arctic
Two seasons in one image
Steep slope
Hiking down
Narvik Kirche, church of the subarctic
Narvik Kirche
Reindeer on top of the mountain
Narvik Kirche
Summer at the church
Summer flowers
Massive waterfall
Young willow catkins
View from Narvik’s hospital, with lilac flowers
Building a bridge over the fjord will gain al drivers at least an hour
Norwegian fjord
Posing with the water, getting soaked
Minimalistic mountains
Insect investigating our reindeer antler
Catching mosquitoes with our license plate, harvest of the year!
Posing with the plot
Fieldwork on the most beautiful spot of the world
Fieldwork on the most beautiful spot of the world
Summer bridge – still next to the sadly impassable river
Rhinanthus flower in the mountains
Plateau in the valley, beautiful brown
Experimental view from my favourite plot
Salix catkins
Extremely old Betula tree
Waterfall from a cliff
Buttercup is the earliest in spring, here
Rocks!
Alpine views
Views!
Fieldwork
Jumping over rivers
Plot
Golden plover
Angry lemming
Green, the whole north is green!
Snow, so much snow left!
Minimalistic mountain moments
Fieldwork
The research center
Red clover – focal invader
Look at this tiny cute snail!
Massive floods of melting water
Bartsia alpina
Hooray, a toilet!
Dryas octopetala
Lowest elevation plots
Butterball!
That’s a lot of water
Midnight sun is the best
At the lakeside
Beautiful Bistorta vivipara
Don’t fall in the water
Midnight sun
Wild river
Art – made by ages of wild rivers
Baby firework for America’s independence day
Midnight sun at the lake
The Abisko canyon was wilder than ever
That’s a crazy amount of water!
The Abisko canyon was wilder than ever
The Abisko canyon was wilder than ever
Black and white
Stone-man overlooking Abisko
Nothing as soft as a willow catkin
Label and soil temperature sensor attached
I’d drive to the top every day
Reflections
Rocks and clouds
Brave little birch
Brewing our camping poison
Basic camping stuff
Camping in Norway
Home-made temperature houses
Roadside research at its best
Norway is crazy
Horsetail is so funny
Little creek in magical forest
Birches, birches everywhere
Beautiful rock, a gift from the river
Another roadside fellow
Lichen
Ready to rock the summer
Collecting mosses
That’s a crazy old lichen
Tiny tiny piny trees, but old, so old!
Ready to jump into the fjord?
Ready to jump into the fjord?
That’s a spiky stone!
Views on Norwegian fjords
Silene in the mountains
Cute little orchid
Skua
Attacking skua, mind your heads!
Watch out for the attack of the fierce skua!
Black snail
New plot!
Still a lot of snow to melt, but this spot was free for a new plot
Reindeer are better than people
Two seasons in one picture
Let’s see what is happening to the balance in mountains! Is this a starting avalanche, or will it last a bit longer?
Cute little hut
Climbing mountains by car
Softest moss in history
Drosera in the marsh
Hiking in no-man’s land
The clouds are coming
Abisko valley
‘Butterball’
Fieldwork in the tundra
Abisko valley
Little plot
Clouds and sun and mountains
Making soup on a campfire with a view
Little creek on high elevations
Skua on the look-out
Melting snow in a river
Rhodiola rosea and the Törnetrask lake
Beginning of spring
Flooded plots, melting snow, impassible wetness
Ferns and horsetails
Chile 2015
Lunch made by our local colleague, with funny bread (tasty as well!)
Trips to the field sites were sometimes a real adventure, especially right after snowmelt


")


")
")


")


")
")


")


")


