About wrapping up 2 field seasons

This is a guest post by Charly Geron, PhD-student at Gembloux Agro-Bio Tech and in our Virtual Lab.

One month ago, I was left with mixed feelings about finishing up my second field season, and acquiring massive amount of data on a part of my PhD. It was so nice to actually have finished everything on time in the field, but also a bit sad to not going back to the places I visited 2 years in a row!

But please, let me recap what happened since april 2018!

At that time, with my supervisors, we decided to study how urban environments are impacting alien plant development. We then focused on studying the development of the most widespread alien Asteraceae species along Belgian urban-rural gradients. Indeed, this is one the plant family with an impressive high number of aggressive invasive species.

It was with great excitement, that I dived in the practical organization and looked for ways to select and find plants in areas of interests. In fact, for the success of my experiment, I needed plants in every possible anthropogenic habitat in my study zone, an area as big as half of Belgium. No need to say that I was a tiny bit anxious to drive around thousands of kilometers looking for my plants with no clue of where they could be.

That’s when we had the idea (not knowing if it would work) to use the data of a naturalist citizen science platform named waarnemingen.be or observations.be (depending if you prefer the Flemish or Wallonian version) as a source of observations. Now owning thousands of records (GPS points that can be as precise as a few meters) of my chosen species, I selected focal areas to look for my plants.

Picture 1.jpg

Map of the selected areas to look for my plants in Belgium. Each red dot corresponds to an area where the alien plant species had to be spotted. Just to give you an idea, more than 250 plant individuals were studied during each of the 2018 and 2019 field seasons.

The first field days began in July 2018 under a scorching sun, excited to find out if the plan could be successful (luckily, I got help of so many kind people during these long field days in urban labyrinths). And so it seemed: the method was great. I often found the plant exactly at the coordinates uploaded by kind strangers to the internet some time ago. Indeed, happily enough, from times to times, I was discovering tiny, almost undetectable plants in an urban jungle.

Picture 2

Found it! This tiny Solidago gigantea was found back at the exact spot where a kind stranger did register it some time ago. Amazing!

We had glorious surprises (for my experiment, less so for local biodiversity) such as finding huge colonies of flowering non-native species glistening in nice understory vegetation.

Picture 3

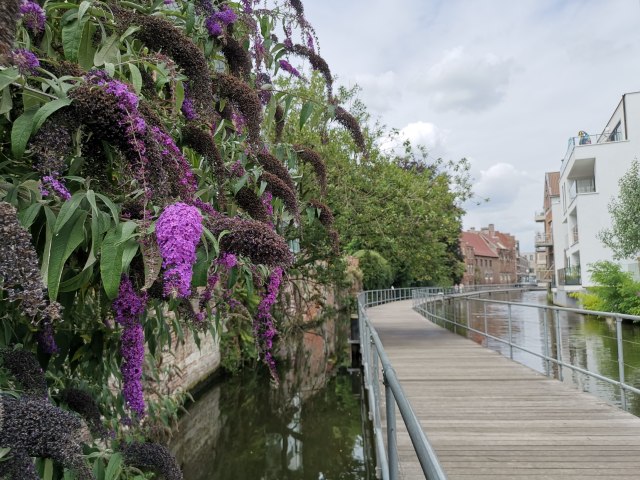
Telekia speciosa in full bloom spreading around in a forested park close to Bruges, picture courtesy of Jonas Lembrechts.

After only 11 field days, recording stress levels of the plants (leaves’ pigments, development variables, etc.), the 2018 field season of this part of my PhD was already finished! Hooray! Even better for me, the weather was nice enough to offer record breaking bright and warm days, perfect to study the impact of urban environments under global warming!

Picture 4

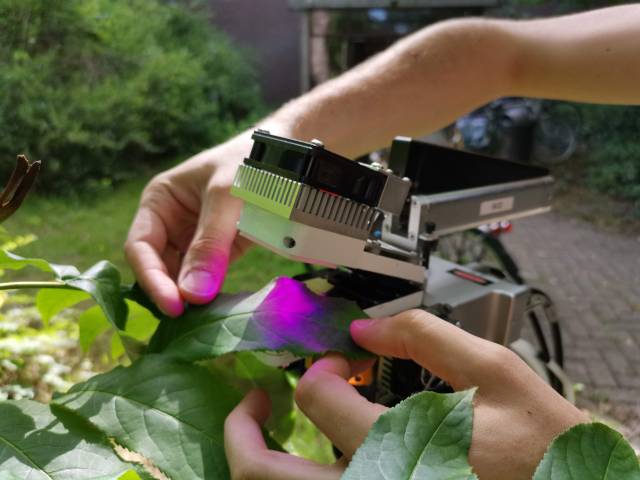
Measuring leaves’ pigments such as chlorophyll to detect whether or not this Artemisia verlotiorum is feeling good.

This summer, more precisely in late June, I did re-survey the locations of my 2018 field season. Indeed, to better understand the conditions experienced by alien plants in urban environments, it is nicer to include inter-annual variation. I got lucky enough to get two contrasting weather periods between summer 2018 and summer 2019.

Picture 5

Almost 39°C in the full sun back in July 2019 in Brussels. Summer 2019 was less warm, but more variable, with intense heatwaves. I’m sure you experienced the uncomfortable heat escaping from urban structures such as pavements in hot days.

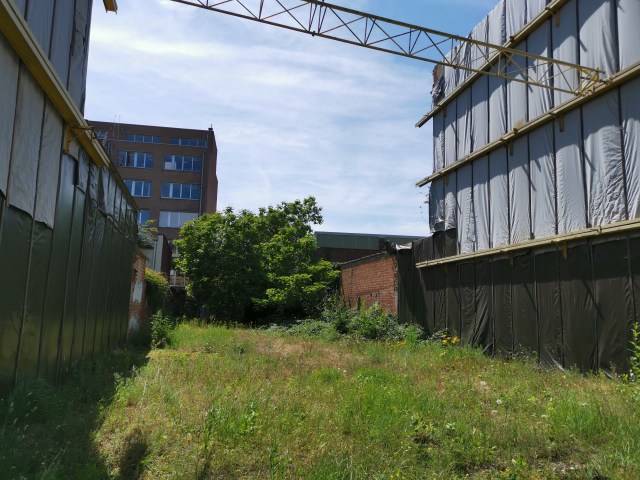
I was happily surprised to be reunited with most of my plants from last year. Of course, some places changed drastically. That’s when I really understood how fast anthropogenic environments are evolving! Urban brownfields where I could see thousands of my ruderal alien plants last year now turned in to fancy brand new housing. Despite some bad luck spots, I was also able to wrap up my second field season, studying about 270 plants and this time in only 7 days!

Picture 6

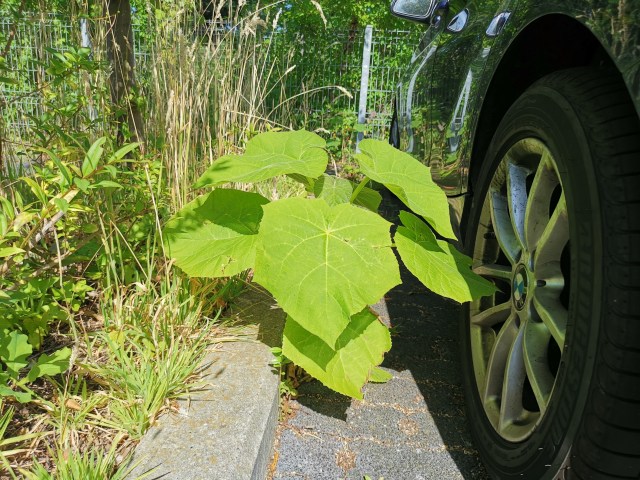
A rather strange place to keep your stroller, but a perfect place to spot ruderal alien plant species.

Following a recent blogpost here, I am so grateful to all the people that are doing citizen science initiatives! They are helping science more than they expect! They saved me so many working days, especially the difficult but exciting task of finding species where they develop.

More will follow later about the findings following these two years of data acquiring. So please stay tuned to learn how urban versus rural environments are limiting or helping alien plant species. For now, off to work to incorporate the data acquired this year to my expanding data sheets.

Posted in Belgium, General | Tagged , , , , , , , , | Leave a comment

Calling in the plant doctor

IMG_20190823_111623

The Li-COR in action

Sometimes you really want to know how a plant is feeling. That’s when you call in The Plant Doctor!

The Plant Doctor is sitting next to me in the office and he knows a lot more diagnostic tools than the ‘I’ll-just-look-if-the-plant-is-there’-ecologist that I have traditionally been.

IMG_20190823_111948

I have to admit the latter has dramatically improved, and I can now call myself familiar with a ton of ecological measurement techniques – from fluorescence to root staining, yet this particular tool has always looked incredibly sofisticated and far beyond my reach: the Li-COR.

The idea is simple, though: the Li-COR measures photosynthesis, which is of crucial importance if one wants to know how well a plant is doing. In practice, though, it involves a lot of buttons to push, decisions to make (like: do we want to measure at the same levels of CO₂ as previous studies, the background levels in the field on the day itself, or the average value from Hawai’i accepted as ‘this year’s CO₂’?), and heavy equipment to take (like: how many kilos of batteries does this thing need to survive throughout the day?). Enough to walk around it up till now, but sometimes you really want to KNOW!

IMG_20190823_111535

Yet there is even more to this than just photosynthesis measurements: we can capture the air the Li-COR uses to measure photosynthesis (yes, we basically collect it into little baloons) and take it to the lab of The Plant Doctor. There, we can send the air through the even more complicated ‘PTR-TOF’ to measure so-called Volatile Organic Compounds; which is basically the smell of the plant, the molecules it emits. Some of these molecules will relate to its stress levels, and that is exactly what we are after: how happy are our plants, and what is driving their happiness levels?

So you can imagine I’m pretty excited for this new project, where finally, really, we’ll get to ask the plants themselves how they feel, instead of looking at them from afar, or using simple proxies.

Stay tuned for the results!

Posted in Belgium, General | Tagged , , , , , , , | Leave a comment

Following from afar

What a feeling that gives: when your PhD- and master-students are rocking their fieldwork, and pictures of their successes are tumbling past.

Case in point: this success for our mountain trail surveys in Norway, finished in the rain and with a few stubborn Carex species that require patient identification at home, yet finished nonetheless:

It makes me proud to see the new generation doing so well, and expanding on the knowledge I gained in those happy years that were my own PhD. Ones in a while, they need my expertise, for example to identify some funny looking high-elevation grasses, but I already feel it happening: they are becoming experts on their own along the way, pushing the boundaries of science for their own important topics.

68548334_479883269469601_8641761816331943936_n

Poa alpina, a wonderful grass species that grows its offspring ON itself. Here in the hands of a PhD-student in Sweden. 

A pride-filled summer, for sure.

Posted in General, Norway, Sweden | Tagged , , , , , , , , , | Leave a comment

Presence of non-native species in mountains

For MIREN, we are working on an awesome new blog series summarizing our scientific findings from the last 15 years for conservation, policy makers and the global public. This is chapter 2 in the series, follow the whole story on www.mountaininvasions.org.

Non-native species are species living outside their natural area, arriving there by following humans in their trace. Recent global change, most notoriously the exponential increase in global trade and travel, have rapidly turned the invasion by non-native species into a global issue. However, there have up till recently always been a few pristine environments that could be considered little affected by invasions. Mountains, with their harsh climate and their low accessibility, were a perfect example 1. These low levels of invasions in mountains are indeed reported in the first MIREN-publications, mentioning only few non-native plant species in the alpine zone in Switzerland 2 as well as in the Northwest of North America 3 more than a decade ago.

DIGITAL CAMERA

The harsh climate in mountains (here the Cañadas del Teide on Tenerife) has always been seen as an adequate barrier against non-native plant invasion.

However, increasing evidence now indicates that plant invasions in fact do occur regularly in these environments 4. More worrisome: the threat of invasion is likely to increase rapidly in the near future as a result of climate change, greater anthropogenic land use (e.g. intensification of human activities, human population growth, and expansion of tourism), continuing novel introductions and upward expanding native species 1,5,6.

This expected increase in non-native plant species introductions into mountainous areas is in fact happening under our very eyes. Over a thousand non-native species have now become established in natural areas at high elevations worldwide, and although many of these are not invasive, some may pose a considerable threat to native mountain ecosystems 4. In total nearly 200 non-native plant species have even been recorded from alpine environments (above the tree line) around the world 6. Islands turn out especially vulnerable for these invasions 7, with over a 150 naturalized plant species already present above 2000 meters in Hawaii as early as 2005 8.

20121124-_MG_0266

Non-native plant species are increasingly found at high elevations in mountains across the globe. Here a dandelion (Taraxacum officinale), a common invader in mountain regions everywhere.

Non-native species richness is highest in the New World regions, reflecting the effects of colonization from Europe 9. Surprisingly, similarity among regions is low and due mainly to certain Eurasian species, mostly native to temperate Europe, occurring in all New World regions 8,9. Most of these non-native plant species appear to have been introduced unintentionally (e.g. as seeds attached to vehicles, animals and humans), but a few are introduced to assist with revegetation of disturbed soils and for amenity plantings in ski resorts 10. Most non-native species are lowland forb species, yet alpine non-native species pose a much greater risk, as they are already pre-adapted to the harsh mountain climate 4,11. We nevertheless identified only three species as specifically cold-adapted, with the overwhelming majority having their centers of distribution under warmer environments 6.

Differences in elevational distributions between non-native species mostly result from differences in biogeographical affinities and climatic tolerances (Arévalo et al. 2005). Range limits of non-native species at high elevation are associated with high population turnover, which results in a transition zone characterized by source-sink dynamics 12. Populations within this zone exhibit reduced probability of occurrence, and smaller patch size. Yet they are there, undeniably.

We thus observe a rapid increase in non-native species presence in high elevation areas around the world, triggering questions on what is driving these introductions, and how to deal with them. In the next episode of this series, we will first discuss the elevational distribution patterns of non-native species in mountains, and how these species deal with the harsh mountain climate.

References

  1. McDougall, K. L. et al. (2011). Plant invasions in mountains: global lessons for better management. Mountain Research and Development 31, 380-387.
  2. Becker, T. et al. (2005). Altitudinal distribution of alien plant species in the Swiss Alps. Perspectives in Plant Ecology Evolution and Systematics 7, 173-183.
  3. Parks, C. G. et al. (2005). Natural and land-use history of the Northwest mountain ecoregions (USA) in relation to patterns of plant invasions. Perspectives in Plant Ecology, Evolution and Systematics 7, 137-158.
  4. Pauchard, A. et al. (2009). Ain’t no mountain high enough: plant invasions reaching new elevations. Frontiers in Ecology and the Environment 7, 479-486.
  5. Kueffer, C. et al. in Plant invasions in protected areas 89-113 (Springer, 2013).
  6. Alexander, J. M. et al. (2016). Plant invasions into mountains and alpine ecosystems: current status and future challenges. Alpine Botany 126, 89-103.
  7. Arteaga, M. A. et al. (2009). How do alien plants distribute along roads on oceanic islands? A case study in Tenerife, Canary Islands. Biological Invasions 11, 1071-1086.
  8. Daehler, C. C. (2005). Upper-montane plant invasions in the Hawaiian Islands: Patterns and opportunities. Perspectives in Plant Ecology Evolution and Systematics 7, 203-216.
  9. Seipel, T. et al. (2012). Processes at multiple scales affect richness and similarity of non-native plant species in mountains around the world. Global Ecology and Biogeography 21, 236-246.
  10. McDougall, K. L. et al. (2005). Plant invasions in treeless vegetation of the Australian Alps. Perspectives in Plant Ecology Evolution and Systematics 7, 159-171.
  11. Alexander, J. M. et al. (2011). Assembly of nonnative floras along elevational gradients explained by directional ecological filtering. Proceedings of the National Academy of Sciences of the United States of America 108, 656-661.
  12. Seipel, T. et al. (2016). Range limits and population dynamics of non-native plants spreading along elevation gradients. Perspectives in plant ecology, evolution and systematics 20, 46-55.
Posted in General, Science | Tagged , , , , , , , | Leave a comment

Thanking the citizens

Hi citizen! We have to thank you. Really, we are eternally grateful for what you do!

Let me explain: we have this interesting scientific question about non-native plant species in cities. We know they are there – tons of them, yet we want to study some patterns in their distribution and performance, among others related to the notorious Urban Heat Island effect.

rhdr

The non-native Butterfly bush (Buddleja davidii) growing on a city wall in Mechelen

So we head out into the urban marvels of Flanders, ready to hunt down invasive plant species and measure their traits. Yet how to find them? We could not just randomly criss-cross through the country, looking at each leave we passed? That would be crazy – and way beyond what I would ask from a PhD-student.

It is there that you, the citizens, come in: there is tons of you out there, already finding all these species, and uploading your observations to fantastic citizen science platforms like iNaturalist and the Flemish Waarnemingen.be. Highly accurate coordinates, often illustrated with pictures of the plants.

nor

Ailanthus altissima, the Tree of Heaven, growing happily on the side of a hot bridge over the ring around Antwerp. 

We just have to download those observations there, plug in the coordinates in our GPS, and navigate to the spot. 3 out of 4 times, we end up lucky, finding what looks like a needle in a haystack: our study species. Then we can measure where they are and how they are doing there, which promises to tell us a lot about the hows and whys of non-native species in the cities.

rhdr

Pauwlonia tomentosa seedlings spreading on a parking lot of a train station. A location we would have never found without the help of the army of citizen scientists.

Stay tuned for these results, they are on the way! For now, just take the ‘thank you’, and please, please, keep recording all those observations, they are of such high value to so many ecologists out there. If you want to help us specifically – and you are in Western Europe – you can do so by recording any observation of our 8 woody city invaders via iNaturalist. Check out the project here, and go out to find them!

qrf

Abandoned building sites, hotspots for non-native species in the cities.

We are recording observations of 8 common non-native woody plant species in Western European cities, to study their distribution across the urban-rural gradient. You can help by uploading your obervations of those species to iNaturalist here! Focussing on Paulownia tomentosa, Ailanthus altissima, Buddleja davidii, Senecio inaequidens, Berberis aquifolium, Cornus sericea, Prunus laurocerasus and Symphoricarpos albus.

Posted in Belgium, General | Tagged , , , , , , , , , , | 1 Comment

Weather station data insufficient for predicting the faith of biodiversity under climate change

We have been doing it all wrong with how we study what the effect of climate change on our biodiversity will be, say Jonas Lembrechts from the University of Antwerp and an international team of ecologists. Their warning is published in the scientific journal ‘Global Ecology and Biogeography’.

It is common practice among ecologists: if you want to know the faith of biodiversity in a changing climate, you first link the distribution of species to the climate at that location. To accomplish this, you use climate models based on the network of weather stations across the world. For many organisms, however, it turns out this approach is unlikely to be valid.

Case in point: northern Scandinavia, where Lembrechts and his colleagues studied the relationship between the tundra vegetation and the local climate. They noted temperature differences of several degrees Celsius between these global weather station models (at 1.5 m in the air) and the temperature just below the soil surface, right there where these small tundra plants are growing.

Picture 1

In winter, plants safely under a blanket of snow do not experience the extreme temperatures we feel – and our weather stations record. Dovrefjell, Norway.

“Especially in winter, the differences are mind-boggling”, Lembrechts explains. “When the local weather station shows average temperatures dropping far below minus 10 °C, plants at the soil surface could still be comfortably at around 0 °C, as the snow cover in the tundra acts like a blanket. Many organisms are thus blissfully unaware of extreme conditions like that.” Consequently, the distribution of most tundra species also relates more strongly to these soil than to air temperatures, the study shows.

“Interestingly,” Lembrechts adds, “this relationship was much stronger for small plant species like grasses, while it was not visible for trees.” The former indeed experience a much stronger mismatch between the temperatures they experience, and the climate reported from weather stations.

Picture 2

The researchers had to brave the tough conditions in Lapland themselves to learn what climate plants are experiencing in this extreme environment.

This information has important implications for the question how biodiversity will react to climate change. This reaction will not be linear, as has often been expected, as the temperatures at the vegetation level are driven by other factors, for example changes in snow cover. This uncertainty on how climate change will look there where it matters for biodiversity needs to be solved urgently if we want to be able to predict what will happen in the future.

Want to know more: Lembrechts et al. (2019). Comparing temperature data sources for use in species distribution models: from in-situ logging to remote sensing. Global Ecology and Biogeography.

Posted in General, Norway, Science, Sweden | Tagged , , , , , , , , | Leave a comment