
In a new paper just published in Global Change Biology, we provide the first-ever global maps of soil temperature (0 -15 cm) at a 1 km² resolution, based on the global SoilTemp database of over 8500 in-situ soil temperature time series. We show that over the year, soils in cold and/or dry biomes are on average 3.6°C warmer, whereas soils in warm and humid environments are 0.7°C cooler, than shielded air temperature at standard height (1.25 to 2 m) as measured by weather stations.
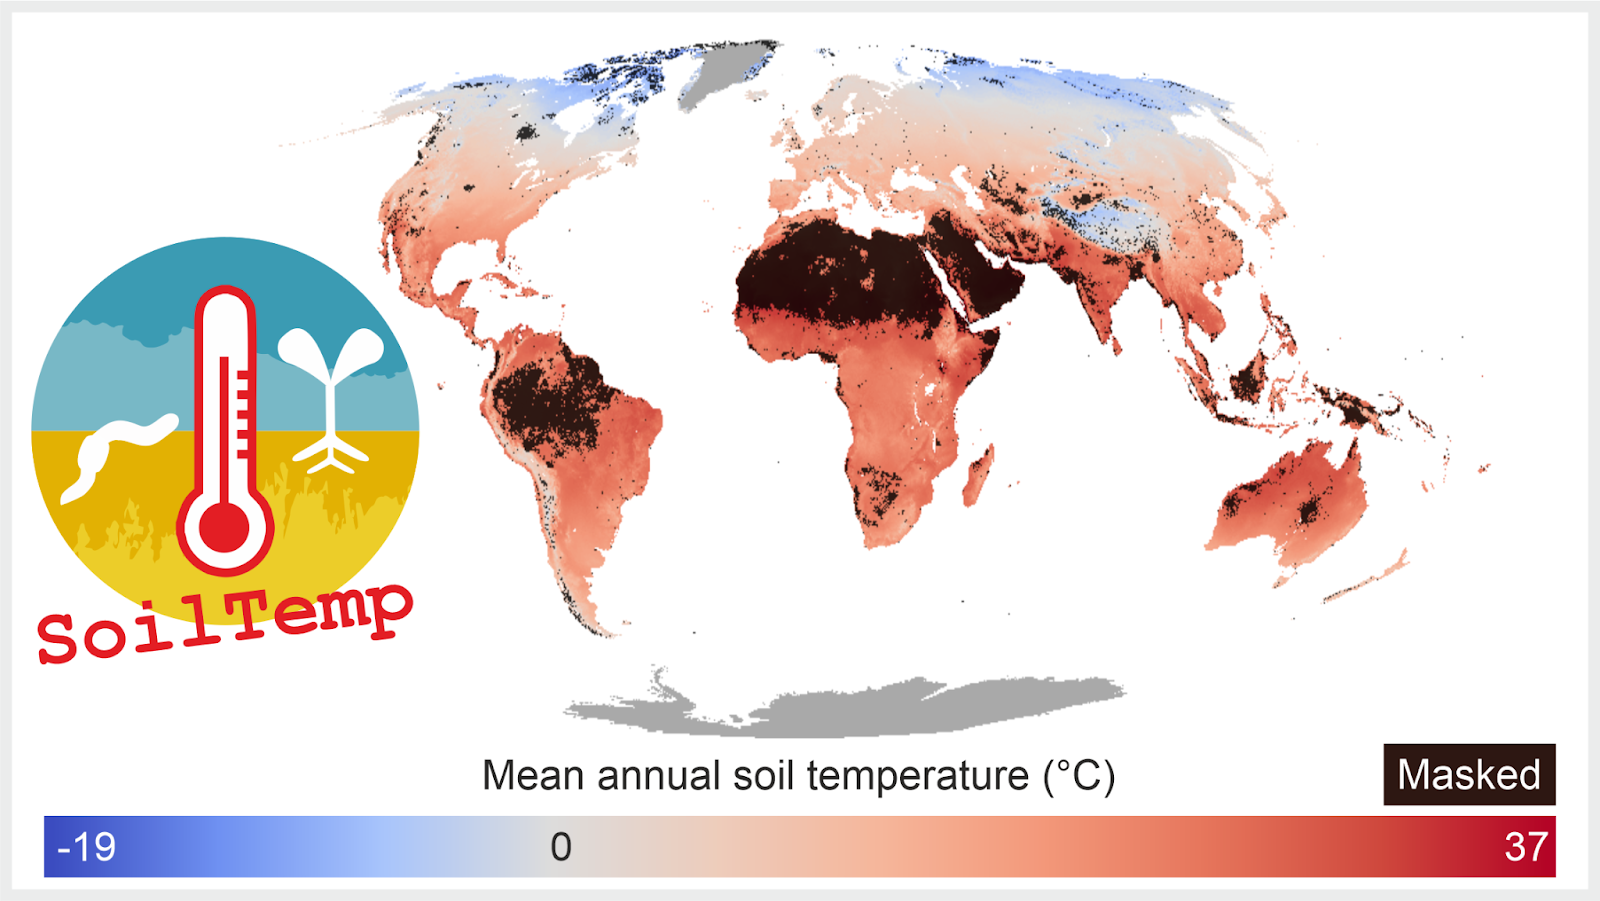
SoilTemp has done what it hoped to do from the start: it brought together over 400 scientists and their over 8500 soil temperature time series from across the globe. This humongous collaboration has now resulted in a first and much-anticipated global product: global gridded layers of soil temperature and bioclimatic variables at a 1-km² resolution for 0–5 and 5–15 cm soil depth. Free for all to use! I can’t emphasize enough how big of a game-changer this can be: now, finally, ecologists working on any pattern or process in, on, or close to the soil surface can use global temperature data that are representative of the soil conditions.
That such a correction is far from trivial is shown by the mind-boggling numbers in the paper. First of all, we show that mean annual soil temperature differs markedly from the corresponding gridded air temperature, by up to 10°C (mean = 3.0 ± 2.1°C), with substantial variation across biomes and seasons: a 20°C (-10 to +10°C) range across the globe! Over the year, soils in cold and/or dry biomes, such as tundra, boreal forests or subtropical deserts, are substantially warmer (+3.6 ± 2.3°C) than gridded air temperature, whereas soils in warm and humid environments, such as tropical rainforests, tropical savannas or temperate forests, are on average slightly cooler (-0.7 ± 2.3°C). We also show a significant reduction in the spatial variation in temperature in the soil in cold and cool biomes (and a slight increase in warm biomes). All this implies that soils will warm differently than the air as climate warms. How big that discrepancy will be, that’s a question up for future research, and a challenge SoilTemp is very happy to take up!

Global maps were created by first calculating the difference (i.e., offset) between in-situ soil temperature measurements, based on time series from over 1200 1-km² pixels (summarized from 8500 unique temperature sensors) across all the world’s major terrestrial biomes, and coarse-grained air temperature estimates from ERA5-Land. Models, based on machine learning algorithms that linked the offset to predictor variables, come with maps of where predictions are most consistent (top) and where the model is extrapolating (bottom). This way, you can verify model quality in your area of interest and mask regions with higher uncertainty.

We hope these maps can mean a major leap forward and finally open up microclimate research to the global scale. But are we done now? Far from! SoilTemp has many other cool things up its sleeve. We are hoping to increase our spatial and temporal resolution, for example, and are working hard to fill the remaining gaps in our global data coverage. Global microclimate networks, it’s still the dream!
The database also has great potential for improving our mechanistic understanding of microclimate across the globe. Most of all, however, we are hoping for a massive surge in applications: if people actually start using our global microclimate products in their ecological analyses, then SoilTemp has achieved what it most dearly wanted.
Reference
Lembrechts JJ, van den Hoogen J et al. (2021). Global maps of soil temperature. Global Change Biology. https://doi.org/10.1111/gcb.16060


")


")
")


")


")


")


")


")


so sick of these nonsensical papers about mapping something from this group. Authors have no idea about spatial analysis and statistics.
Thanks for your comment! I would love to hear what you deem wrong with the statistical approach used here. We are working towards a second version of our maps including more data, for which updates to the statistical approach are also possible.
Thanks for your dataset, which is so helpful!
Happy to be of service!