Sensors

Eleven thousand and counting! This summer has been huge for our SoilTemp-database. Little could we have imagined that our project would become such a tremenduous success, with people contributing from all over the world!

SoilTemp

Temperature loggers from all over the world: from Belgium to the Pyrennees, from Slovenia till Australia, from Sweden to Cameroon, a glimpse of the myriad of contributions to our database

We are now collecting pictures as well, to see where all these heaps of data are coming from. It is only then, when you see the huge variability in landscapes and locations, that you start to grasp the true scope of this endeavour: yes, we are covering all terrestrial landscape types from all biomes across the world! Each of these eleven thousand sensors is a dataset on its own, whispering a story about its own little piece of the world. Together, these stories become a roaring thunder of over hundred thousand months of temperature data, collectively taking the temperature of the world.

And when we’ll be done, the soil climate will hold no secrets anymore.

Keep track of our sensor count on our cool microclimate app!

Posted in General | Tagged , , , , , , , | Leave a comment

Microclimate in the city

Summer 2020 is now in full swing, and that means our trial for our garden microclimate project is in full swing! Let me guide you through some of the plans with some awesome pictures:

IMG_20200531_110423

Lawns, lawns, lawns! We plan to fill thousands of lawns in Flanders with our ‘garden daggers’ (TOMST TMS4 microclimate stations). This summer, we already have up to 50 gardens equiped to monitor drought (here a picture from this springs’ long drought) and heat

IMG_20200528_142745

We are teaming up with some other ongoing climate measuring initiatives, among which the super awesome Leuven.cool community science project. They measure urban heat islands effect in air temperature, we match our loggers on and in the soil, to study vertical gradients in temperature.

We use these set-ups from Leuven.cool also to test small-scale variation: how much does temperature and moisture vary within a few meters in a lawn? How wide of a circle can we capture using one garden dagger?

IMG_20200528_105519

We have gardens ranging from the very center of the city – here a view from the ‘Begijnhof’ in the center of Leuven – to the more rural parts of the country, allowing us to test for the effect of garden location on patterns in drought and heat

IMG_20200528_121539

No project on soil moisture and temperature without soil samples! We dig up soil in all the gardens we are studying, to study soil texture and carbon storage potential

Looking forward to see what these trials will bring, and so ready to roll out this project in full next year!

Posted in Belgium, General | Tagged , , , , , , , , | Leave a comment

Our green is grey

This column appeared originally in Dutch in EOS (www.eoswetenschap.eu)

There’s no nature here anymore in Flanders. Not if we were to define it as ‘untouched wilderness’ that is not or hardly influenced by human activities. We have lost our last primeval forests for centuries, and in inaccessible mountain tops or vast deserts we never really excelled.

No more nature? But what about all those forests, fields, swamps, dunes, moors, parks and gardens? Indeed, there is still green in the region – there is just a lot less of it than we might have hoped. That means, however, that our definition of nature must include more than just wilderness.

rrem

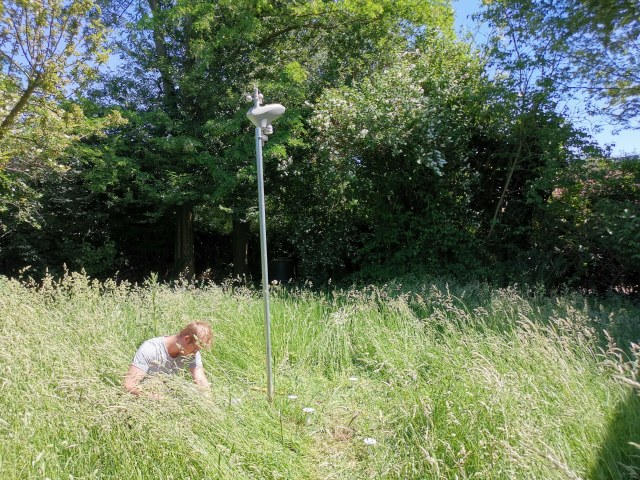
Nature or not? If this typical agricultural scene from Flanders fits under the definition is up for debate

But where do we draw the line? How much ‘culture’ makes green unnatural? What about our heathlands, which can only exist when managed? What about parks, gardens and fallow land? Even such a less strict definition quickly clashes with its limits. Our green clearly has a grey zone.

IMG_20190822_110646

Heathlands – here the Kalmthoutse Heide north of Antwerp – need continuous management to survive. Nevertheless, many would see them as natural.

This grey zone in our definition of nature makes it more difficult to protect it. How, for example, can the government show whether nature is increasing under their management if we disagree on what exactly we mean by it? Just counting forests is not enough – as sometimes happens in the context of carbon sequestration. Few people will argue that a beautiful orchid meadow or extensive flood plain is not nature, and that we need to reforest it. Focusing on all the green patches in our landscape on the other hand will not help us either. Regardless of how green a football field may be, giving it the ‘nature’ label might be a bit of a stretch.

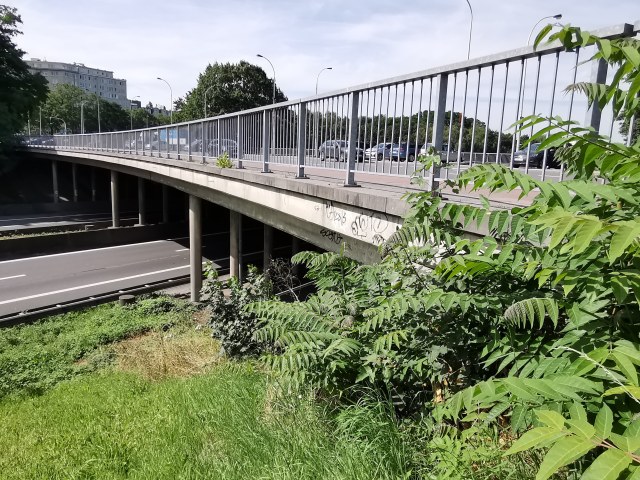
On top of that, nature itself is changing faster and faster. The smooth spread of the word ‘betonstop’ (concrete stop) through the Flemish media has unfortunately not yet prevented the expansion of this concrete itself, while the changing climate is also increasingly oppressing nature.

20190704_112811 (1)

Concrete is still on the rise in Flanders. Some species – like this exotic butterfly bush – can deal with the harsh circumstances of city life, but many others are lost.

We are in the midst of a biodiversity crisis, in which we are losing species at breakneck speed. Animals and plants that used to be taken for granted have increasingly disappeared from the landscape. New species can take their place, so-called exotics that have been introduced here by humans. In many cases, it is precisely in those places where nature is most oppressed – in our cities, for example – that these exotics take the upper hand.

The evolving nature with its new species also changes our own perception of what nature is. The older generation perhaps remembers how you could hear a lark chirping above almost every field. For young people it is a surprise that no noisy parakeets flew through the parks of Brussels just a few decades ago. Your home environment can also influence your definition: those who live in the city have a very different idea of green than those who have spent their whole life on the farm. Often, however, we are hardly aware of these differences in perception.

20190625_082444

A few decades ago, our countryside was filled with biodiversity, now the balance is often tilting towards more and more monocultures. Does that change our perception of how natural we perceive these fields?

The corona crisis in recent months has once again shown how crucial nature is to our health and well-being. As long as we do not clearly visualize these differences in perception, we will remain stuck in a lack of understanding about measures that nature is trying to strengthen. This results in bickering about cutting down trees in order to restore heathland, or in heated discussions about whether or not to fight cuddly-looking exotic species.

A better understanding of what we experience as nature can explain what we hope nature will look like in the future. Even more importantly, it gives nature managers the opportunity to take into account even better this range of personal definitions in their policy and communication. In this way, we increase support for much-needed management.

We will put a good step in that direction, with a questionnaire soon to be launched. Follow it all on www.natureornot.be!

nor

Posted in Belgium, General | Tagged , , , , , , , , | 2 Comments

Meetings

Covid19 has totally transformed the way we go about life. Making this statement after half a year of this virus dominating all global news is truly knocking down an open door, and yet, I wondered what our trusted numbers could tell about the size of the impact on my own work.

In particular I wondered how much of my time would go to meetings, being everything from a one on one talk in the hallway with supervisor or student to a full blown international conference. So I took another deep dive in my Timeular time tracking data:

Meeting time

Number of hours (left) and percentage of my working time (right) spent on meetings since the start of my postdoc in October 2018. Plotted line from a generalized additive model, vertical line marks the day we started our semi-lockdown and working from home here in Belgium.

So what do the numbers say? Intriguingly much, actually. First of all, there is a clear drop in amount of time spent in meetings after the lockdown, going from on average 8.7 hours to only 5.8 per week. There is also a clear drop in the summer months (around month 7), which seems to turn into something even more explicit this year. When correcting for the slightly lower workload during the lockdown, the difference is a bit smaller (right), yet we still drop from 22% to 15% on average.

So what about the amount of meetings? With 22% we have a big chunk of time dedicated to meetings pre-corona. I do think this is fair, though. As an international ecologist embedded in several global networks and with a team of students at work, a main part of my time goes to talking to other people, to keep ideas flowing, spark new projects and decide on ways to move forward.

The drop to 15% is thus a double-edged sword. I have a few hypotheses of what is actually going on:

  • Meetings are becoming more efficient. As they got less ‘cosy’, we seem better at focussing on what the meeting is truly about. And as everyone seems swamped in Zooms and Skypes, there seems to be more of an urge to stay within a one-hour limit. Good thing!
  • We lost the international conferences. Notice all the spikes in the graph pre-corona? Weeks with over 50% of time spent on meetings? That’s those large gatherings (with two conferences in Iceland and Sweden largely driving the uptick just before the lockdown in March). Important for networking and boosting new projects, especially when starting up a global database like SoilTemp. However, usually not so time-efficient for what comes out of them, so dropping those is a mixed-bag.
  • We lost the spontaneous chats in the hallway. Those I was very fond of, and especially with my supervisor those are where the best ideas came from. Again, however, there could be a lack of efficiency there as these can often wander off in less urgent matters. The result? Less sparks for unexpected cool new projects and analyses, more time gained to finish what’s already ongoing…
  • People are busier, leaving less time for them to meet with me. As the virus has hit everybody in a different way, this is a bit harder to judge from my side, yet I see it very likely that many people have put many projects on hold, making meetings with me less of an urgent matter.
  • Students are more isolated. This is a real concern, that there is a big drop in time I spent supervising the students in the team. However, I have kept the students as my main priority. We did regular meetings with The 3D Lab throughout the spring, and I have been checking in on all of them as much as I could. Nevertheless, there is undeniably less one on one-time with them, with many of the interactions moving to email or chat, leaving them more vulnerable. Not such a good thing…

There is probably many more explanatory variables at work, so checking in with the reader: did you see a change in meeting times pre- and post-corona lockdown? What would you say is driving these changes?

IMG_20200710_102427

View from the home office when lunchtime is approaching

Posted in General | Tagged , , , , , , | Leave a comment

Tiny blessings

WhatsApp Image 2020-07-06 at 10.23.24.jpeg
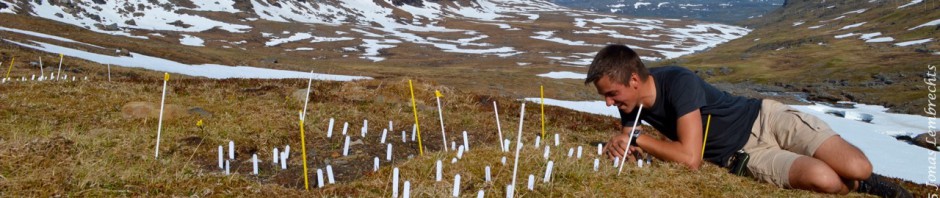
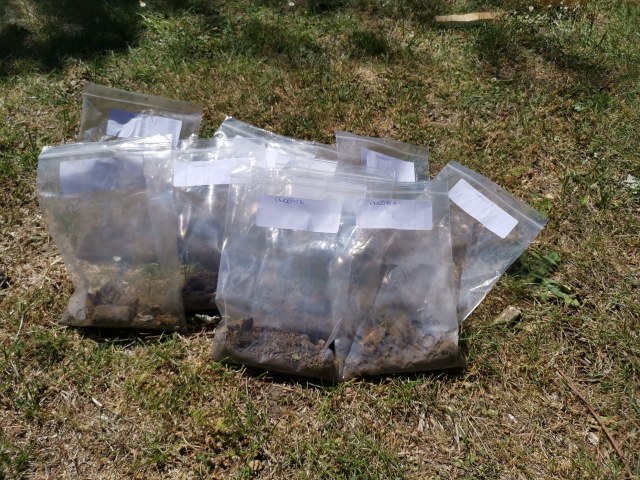
This might not look like much to you, but the picture on the right is a massive success-story!

What you are looking at, is tiny clover-seedlings, sown last autumn in the barren climate of the northern Scandinavian mountains.

This means two things, both of them as extraordinary:

1) They germinated! What a relief, every time, to see these tiny fragile things emerging from the soil, after having been covered in snow and beaten off freezing conditions for months.

2) Someone is there to witness them! Yes, it is still corona-times, and no, we didn’t make it up north ourselves. But  thanks to the amazingly kind offer of the local fieldwork team, our fieldwork is happening anyway, and only very little will get lost!

Both of these things combined have another important consequence: the experiment from Jan is a success, bringing his PhD-project a huge jump forward.

More soon!

Posted in General, Sweden | Tagged , , , , , , , , | Leave a comment

Goodbye!

Two big achievements yesterday: two of our master students defended their thesis, and will thus be able to put an endmark behind their education! A big congratulation to both Ilias Janssens and Bram Vanheule for all they achieved.

Ilias

Virtual trial thesis defence by Ilias Janssens, discussing his cool results on patterns in plant community traits in the Scandinavian mountains

Ilias studied the relative importance of climate and disturbance as driver of plant community traits, using a huge dataset of plant traits from over 160 species from the Scandinavian mountains. Main result: local disturbances like roads and trails have surprisingly small effects on community traits in comparison with large-scale drivers such as temperature.

Capture

Trial defence by Bram, exploring the role of urban heat islands on plant invasions

Bram had a much different arena to work in: Western European cities. His question: how do non-native plant species perform during a heatwave along a gradient from city to rural zones. The conclusion? Urban Heat Island effects are much less important than we anticipated; it is at the smallest scale (e.g. amount of soil available around the plants) that stress-levels are defined.

We hope to bring you more details on these fascinating topics soon, but for now wish the students all the best in their upcoming careers.

Posted in General, Science | Tagged , , , , , , | Leave a comment