Kashmir Himalaya. A region famous for its breathtaking heights and steep mountain regions. From 1994 to 2013, the Indian government here worked on one of the most challenging railway lines of the world, facing major earthquake zones, extreme temperatures and inhospitable terrain, and including India’s highest railway bridge.
That’s the setting of our latest paper: we surveyed native and non-native plant vegetation along the whole stretch of the railroad to monitor its effects on plant species distributions.
Railway of Kashmir Himalaya : (a) map of the railway, with marked localities of the sampling sites, (b) a view of a railway station, (c) a sampling site between stations illustrating the sampling design
Both in 2014 and 2017, we (and with ‘we’, I mean Irfan Rashid and his team in Kashmir, as I was safely at home in charge of statistical analyses) collected vegetation data along T-shaped transects, adopting the common MIREN (Mountain Invasion Research Network, www.mountaininvasions.org) road survey design that might be familiar to many following this blog.
So what did we find? Plant communities changed significantly between 2014 and 2017, driven by declines in both native and non-native species richness, and increasing abundance of a few non-native species, especially in areas away from the railway track.
That both native and non-native richness would decline was unexpected, yet these patterns seem to suggest an advancing succession, where initially – rare – pioneer species are replaced by increasingly dominant and often non-native competitors. Additionally, it could suggest a trend towards delayed local extinctions after the disturbance resulting from building the railway.
What is clear is that the plant communities next to railways do not reach equilibrium quickly after a disturbance. More than ten years after railway establishment, succession continued, and signs point towards a landscape increasingly dominated by non-native species. Our study indicates that the single disturbance event associated with constructing a railway in this Himalayan region had large and long-lasting effects on plant communities at and around this transport corridor.
Importantly, the one railway in the Kashmir valley is currently still disconnected from the national railroad system, with plans under way to finish that connection in the near future. As has been shown elsewhere, such a connection with the rest of the country would further play into the cards of non-native species. We thus highlight the need for a long-term region-wide coordinated monitoring and management program to limit further spread of such non-natives, and make specific recommendations of what is needed to manage the vegetation at and around the railway through Kashmir valley, especially with the planned connection of the railway with the rest of the countries railroad network in mind.
Last week, the southeast of Belgium had to cope with extreme precipitation, resulting in hallucinatory images of floodings. These large amounts of precipitation also leave clear traces in the soil moisture measurements of the CurieuzeNeuzen microclimate network.
As you can see on the map below, gardens in the province of Limburg, Antwerp and Flemish Brabant show an absolute peak in soil moisture of up to more than 20% in some places compared to the reference level last weekend.
Difference in soil moisture in Flemish lawns between the peak level on July 15 (after the days of heavy precipitation in the center and east of the country) and the average soil moisture on July 11, as a reference.
Lawns as sponges
Such soil moisture peaks clearly demonstrate the importance of our lawns, gardens and nature as a sponge during heavy rains: all the water that can be absorbed by our garden soils is at least temporarily trapped, and lowers the pressure on our sewers and rivers, thus reducing the risk of flooding. The observed increases in soil moisture even occurred in garden soils that were already very wet, after a very wet first half of July (the average soil moisture percentage on July 11 in Flemish lawns was 38%).
However, at times of extreme precipitation such as this, much of the precipitation does not get absorbed into the soil: there is a maximum amount of precipitation that soils can take at one time before they are completely saturated. The excess water will have to run off above ground, causing flooding. That maximum depends among others on soil type, precipitation history (very wet, but also very dry soils can absorb less water) and soil health (soils with a high diversity of soil life can absorb more water). If a large part of the soil is also covered with concrete or asphalt, the capacity of the soil as a water buffer rapidly decreases. The result: more flooding.
Also, the data from the lawn clouds clearly show the consequences of the long duration of this unusually stationary rainstorm. On 14/7, when the heavy rainfall in Flanders was still concentrated in the east of the region, the increases in soil moisture in the lawns of the CuriousNeuzen network in Limburg were still limited to 10 to 15%.
Difference in soil moisture in Flemish lawns between the peak level on July 14 (after the day with heavy precipitation only in the eastern part of the country) and the average soil moisture on July 11, as a reference.
More extreme weather
We also expect more of these extreme precipitation events in the future. Even if the total amount of precipitation in Belgium remains the same, it will be more difficult for plants to get water if that precipitation falls in fewer, but larger showers, just because the soil becomes saturated and has to lose much more water.
This summer, unlike previous years so far, Flanders was on the ‘wet side’ of persistent weather events in Europe, resulting in a lot of precipitation. This precipitation did allow the soil water stocks to fill up again. Such a wet start also reduces the chance of heat waves in our gardens: the summer sun will need a lot of energy to evaporate all that water, leaving less energy for heating up. A wet soil as we have now is the best air conditioner against heatwaves one can have. With the data from this summer, CurieuzeNeuzen will dive deeper into the role of this soil moisture in keeping our gardens cool.
The patterns on the maps above also clearly show that there can be large regional and local differences in the impact of precipitation on soil moisture. Our scientists will analyze these patterns to see if and how much garden location and management can affect the impact of precipitation on soil moisture, and how much we ourselves can manipulate the infiltration potential of our gardens.
A warmer climate of origin does not necessarily protect exotic plants from heatwaves like our country has experienced in recent summers, we showed in a recent paper by Charly Géron, PhD candidate in our group. What does? Local microclimates!
Our cities have an increasingly rich diversity of alien plant species. In particular, species from native regions with warmer climates tend to thrive in the city, where they can benefit from the so-called “urban heat island effect”, in which our cities start to be several degrees warmer than the surrounding countryside. A recent study by the university of Ghent and the royal meteorological institute of Belgium (Steven Caluwaerts and colleagues) has shown that the temperature difference between city centre and rural country side added up to as much as 6 °C during the heatwave of summer 2019.
“We already knew that exotics from warmer regions prefer our cities because of that warmer climate,” Charly Géron, lead author of the study, explains. “The question remained whether these species would also cope better with heat waves in urban settings in summer, as we knew that the impact of heat waves in the city can be much harder.”
Measuring plant stress on a non-native Artemisia verlotiorum
So now it turns out that those warm-adapted species don’t necessarily have an edge in the city during a heat wave: they too see their stress levels go up. At least, if they are in full sunlight. Both species of warm and cold origin responded mainly to local shade effects: growing in the shade no matter if it is due to trees or buildings, allowed them to keep their stress levels under control. However, in unshaded city or countryside open spaces, their stress levels increased.
Anthocyanin levels (a measure of plant stress) going up in all studied Asteraceae with increasing openness of their growing location (SVF = Sky View Factor, a measure of how much sky they can see).
“These findings tell us that the effects of urban heat islands on plants are not as straightforward as thought,” explains Géron. “Although those warm species probably benefit from the warmer winter temperatures in the city (you also have much less ice-scratching to do if your car is parked in the city than in the countryside, because the heat island effect protects against freezing temperatures) or also the longer growing season (earlier and later favourable periods in cities with milder temperatures), for those extreme temperatures during a heat wave, it is mainly the local shade effect that counts.”
Similar patterns also show up in the dataset of the citizen science project “CuriousNoses in the Garden”, says Jonas Lembrechts, scientist in the latter project. “We see clearly that local factors such as shading by trees or buildings can do wonders for maximum temperatures in our city soils, a cooling effect from which those plants can also benefit. At night or in winter, those local effects play much less of a role: the city as a whole heats up due to the release of heat by the urban structures, whether or not there is a lot of shade nearby.” This contrast between local shading effects during the day and urban heat islands at night that CuriousNoses’ citizen scientists observe now appears to have an impact on the success of non-native plants as well.
Difference in temperature between day (left) and night (right) across Flanders, with the heat island effect popping up at night only. Interactive figure made by De Standaard, accessible here.
The Crozet archipelago. A few tiny specks in a vast ocean, ‘on the road’ from South Africa to Antarctica. A tough climate, inhabitants limited to a bunch of winter-hardy researchers and the occasional seabird. But also: Poa annua, the common street grass you’d find in cracks in the streets in any European city.
The non-native Poa annua weathering the elements on Possession Island on the Crozet archipelago. Picture by Rémi Joly.
A species perhaps a bit out of place on the island, but it’s far from alone: there are already 68 non-native plant species recorded on Possession Island alone. Some of them very local, restricted to the few human settlements and the trails connecting them, while others have managed to spread quite a lot throughout the island.
That brought us to an important question: what is driving the distribution of these non-native species on the island? Is it climate that limits them, or human-related factors? Luckily, those scientists on the island haven’t been idle: they collected highly detailed survey data on non-native plant species distributions on the island yearly since 2010, making the archipelago and its vegetation into a perfect case study for cold-climate plant invasions. We used that dataset and went ahead to make species distribution models for each of the 6 most important non-natives. The results of this modelling exercise are now published here.
Interestingly, we observed two very distinct invasion patterns: species were either predicted to occur over a narrow spatial extent, with their occurrence probability strongly affected by human-related variables; or they occurred over a wide spatial extent, only limited by particularly harsh climatic conditions (see figure).
Graphical summary of the main findings of the paper, distinguishing between the two types of non-natives: left, low-spread species, mostly tall annuals, who are limited to human settlements and trails. Right, high-spread species, typically short-statured perennials, who have spread beyond the limits of human settlements and now are largely restricted by climate conditions-only.
So some species were highly climate-limited, while others were mostly driven by disturbance. Although the sample size was small, our species suggested that it were mostly perennial and low-stature species, historically introduced earlier, who appeared less dependent on human-induced dispersal and disturbance, and thus more widely distributed on the island.
Tall annual non-natives thus seem to lack the necessary toolkit to successfully spread far from introduction sites under the harsh sub-Antarctic climate on the island. Additionally, the coldest inner parts of the island are currently still free even from those widely-spread short perennials, suggesting that at least some parts of the island are still highly resistant against plant invasions.
So what to do next? Our study clearly exemplifies that even those harsh and remote places are not spared from non-native plants, and that with the right traits, non-natives can become highly successful even there. As climate warms further, these last climatic barriers will also lower, tilting the balance even more in their favour. It is thus extremely urgent to identify current – and future – potential non-natives on the sub-Antarctic islands across the region, and see if sufficient regulations are in place to contain them.
Beautiful data visualization in newspaper De Standaard today, who show-case the newest conclusions from our citizen science project. Here, I provide a shortened English summary of the longread, but for the full beauty of the visuals, you MUST check out the original story here!
Where we can cool our gardens with greenery and shade during the day, we are pretty defenseless against urban fever at night. The 5,000 lawn clouds of CuriousNoses in the Garden provide a unique insight into that dynamic.
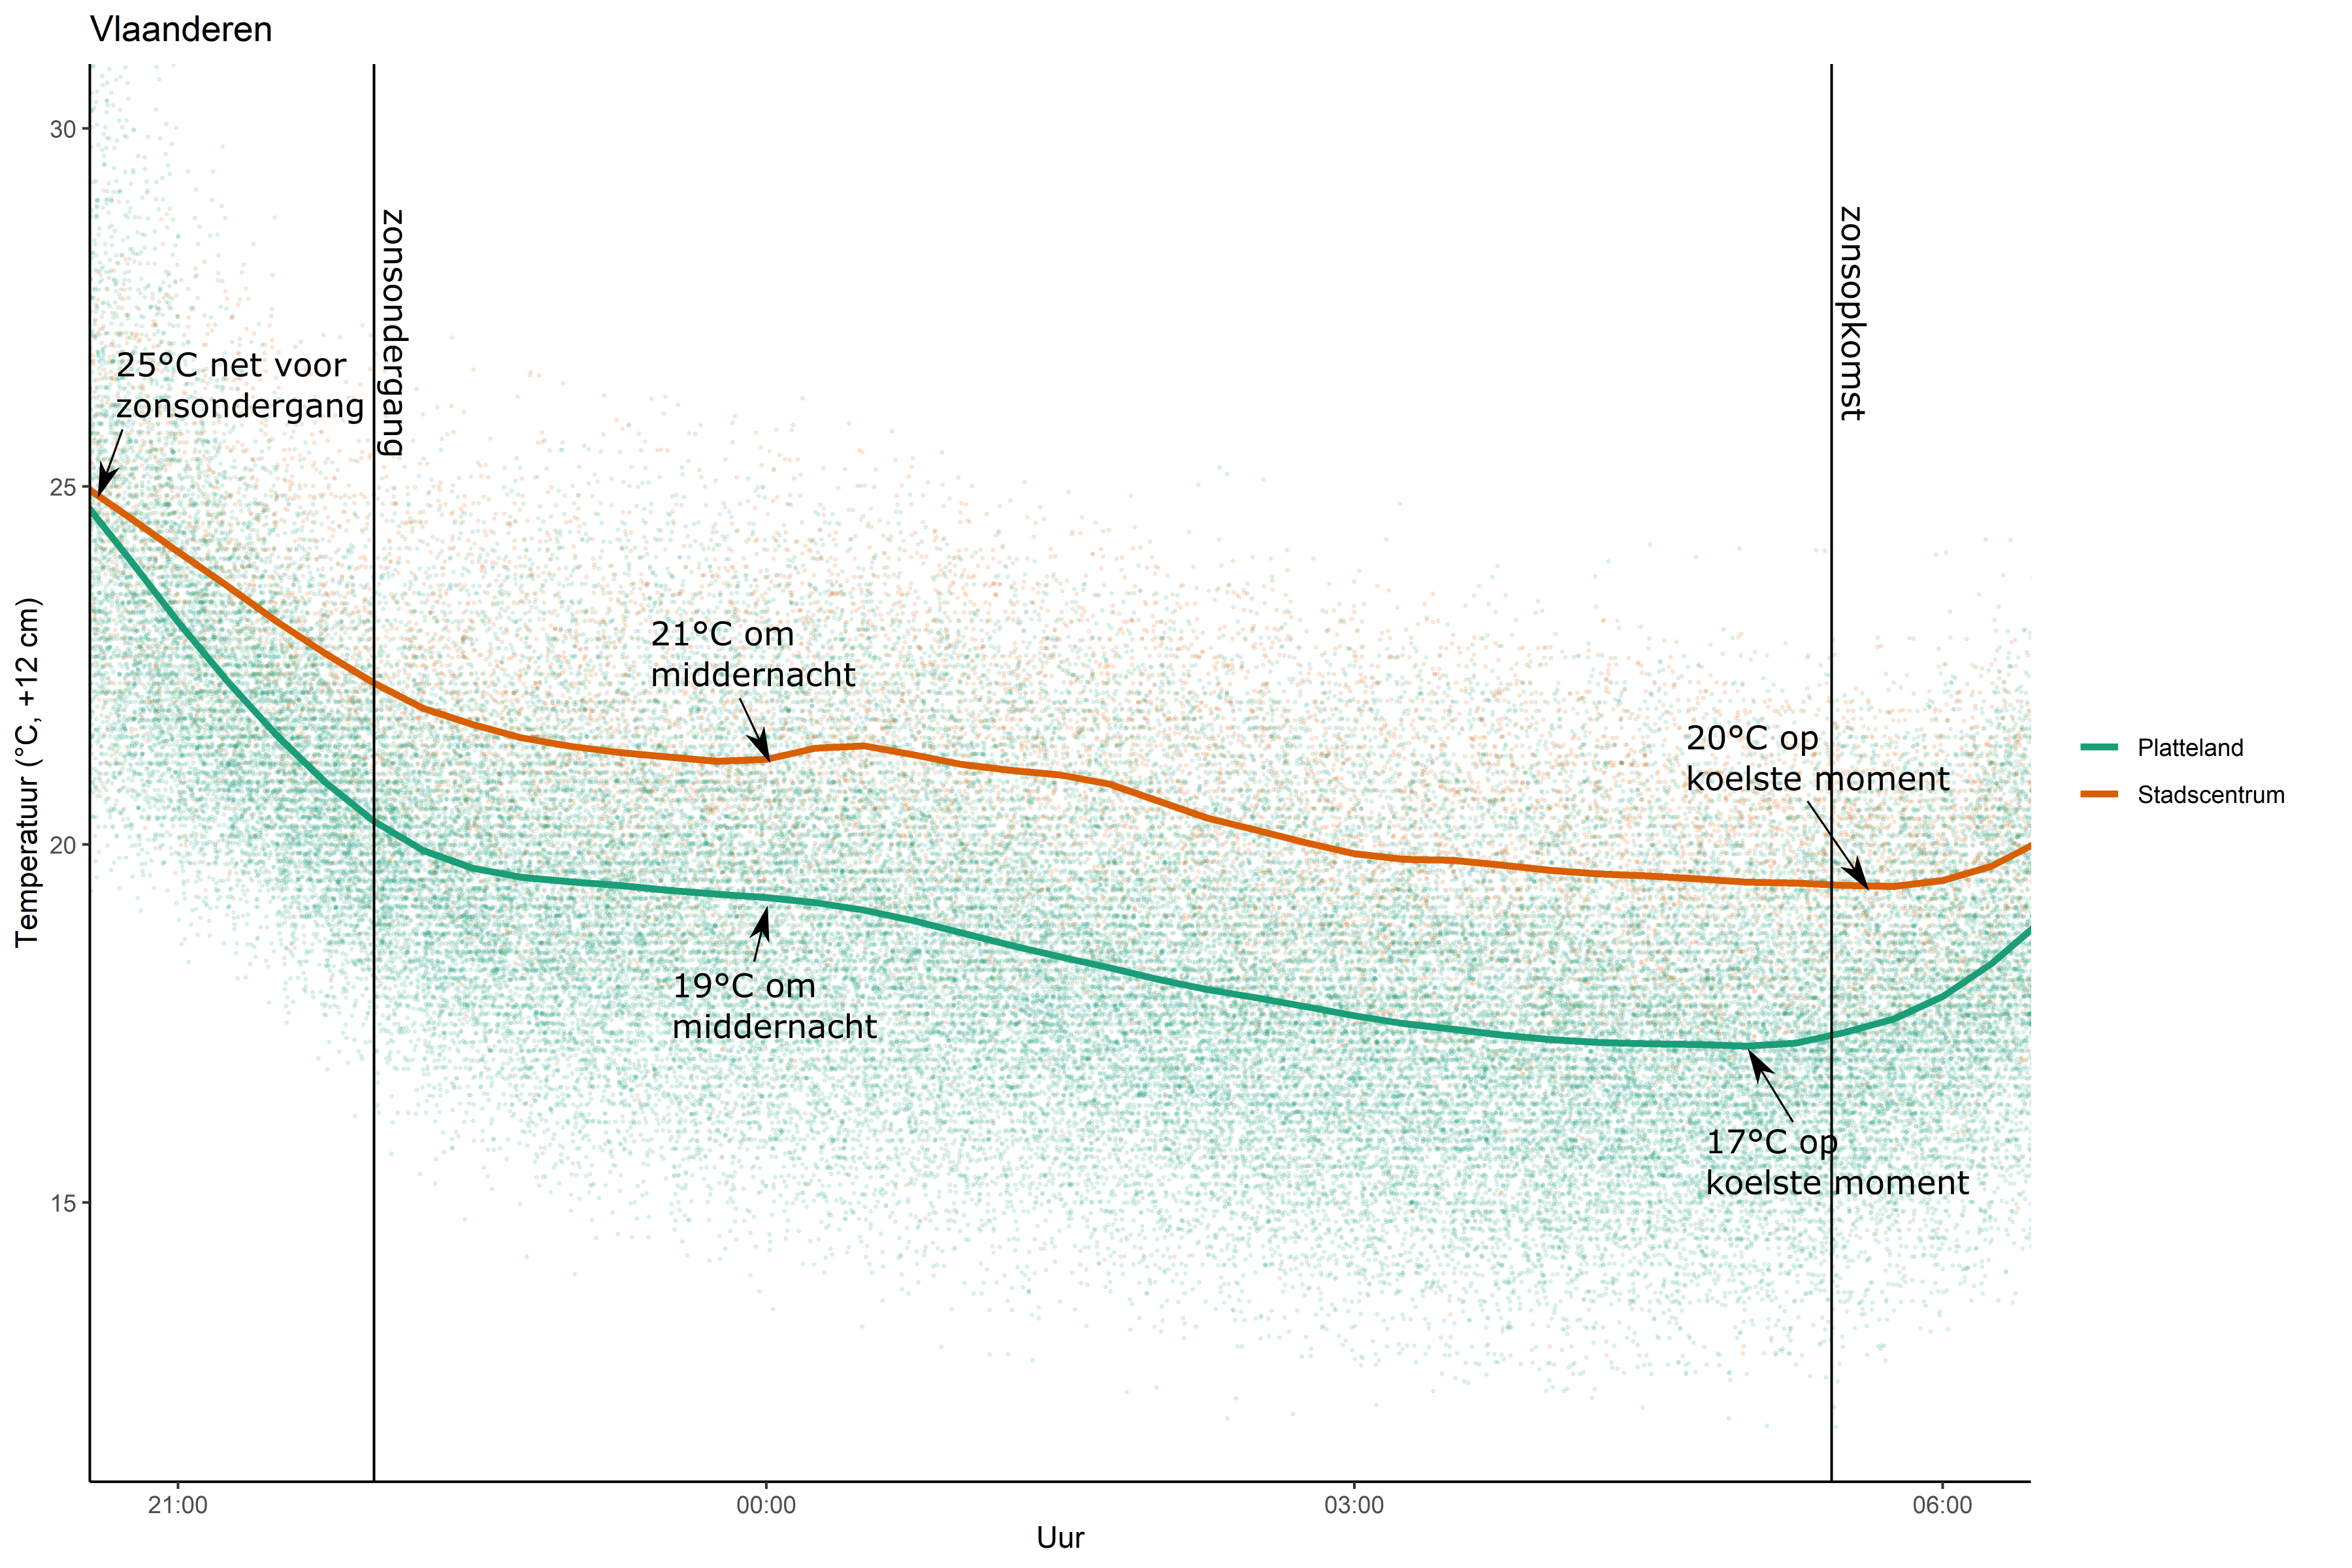
It took some getting used to after that cool spring, when in mid-June the ventilators had to be brought out after all. Especially for residents of large cities, ‘urban fever’ set in. During the night of June 16 to 17, many were tossing and turning at temperatures that hovered between 20 and 25 degrees around midnight. In the surrounding countryside, it was often much cooler.
We know that the heat island effect, in which cities are significantly warmer than the surrounding area, exposes city dwellers to heat stress at higher rates. But much remains to be discovered about its exact dynamics. With their temperature data recorded every 15 minutes, the 5,000 lawn clouds from CuriousNoses in the Garden provide a unique insight into that process.
To study the heat island effect, we look at the air sensor at 12 centimeters above the ground. The temperature there is similar to the temperature we ourselves feel in our garden. The heat island effect can be observed most clearly at night: buildings, asphalt and concrete absorb heat during the day and give it off again in the evening.
It’s harder to sleep in the city
On that warm night of June 16, it was on average two degrees warmer at midnight in Flemish cities than in the countryside. At the coolest time of the night, the difference was three degrees. That doesn’t seem like much, but then it is the average temperature of all urban gardens versus the average temperature of all rural gardens. If you know that local weather conditions, soil type or relief also leave a strong mark and that our countryside is highly urbanized, those few degrees of difference are very significant, says Jonas Lembrechts, ecologist at the UAntwerpen and scientific supervisor of the project. ‘Despite all the variation, the fingerprint of the heat island effect remains. Compare it to global warming: two degrees doesn’t seem like much, but behind that average there are huge differences.’
Comparison between temperatuur (at 12 cm height) in the city and the countryside during a warm, clear night (16-17 june).
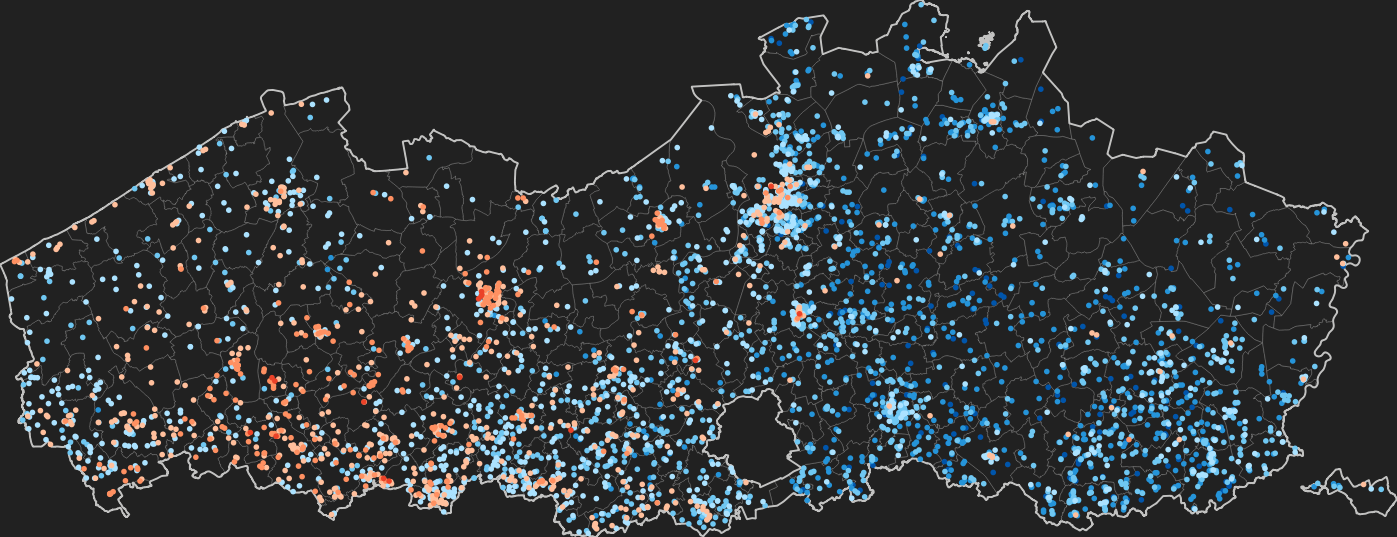
The Flemish average masks large local differences between cities and their surrounding countryside. In Antwerp, at midnight, you had peaks of up to 23 degrees and more in the center, while in the surrounding countryside it often stayed below 17 degrees. Across Flanders, the contrast is even greater: between the warmest and coolest gardens, there was a difference of over 15 degrees at midnight.
That makes a huge difference when you’re sleeping, says Lembrechts. Up to 18 degrees you sleep comfortably, but above that temperature it becomes more difficult for many people. The warmer it is outside, the more difficult it is to get rid of the heat that’s hanging in the house. In the countryside it usually cools off at night, so you can ventilate. In the city, this is then no longer possible. The only thing left is energy-hungry air conditioners. That drives up your electricity bill and, on top of that, those air conditioners heat up the outside air even more.’
The 5,000 lawn clouds beautifully illustrate that rhythm through the night. Consider this animation of the night of June 7-8: at 8 p.m. it is still about the same temperature everywhere (orange and red dots). But as the evening and the night progress, you can see big differences. While it gradually cools down in the countryside (blue to dark blue), the heat lingers in several cities (orange and light blue dots).
This spring the temperatures were not extreme yet in the region. But this pattern clearly shows what we can expect during the next heat wave. As climate change makes our summers hotter, the health risks associated with heat stress will also increase.
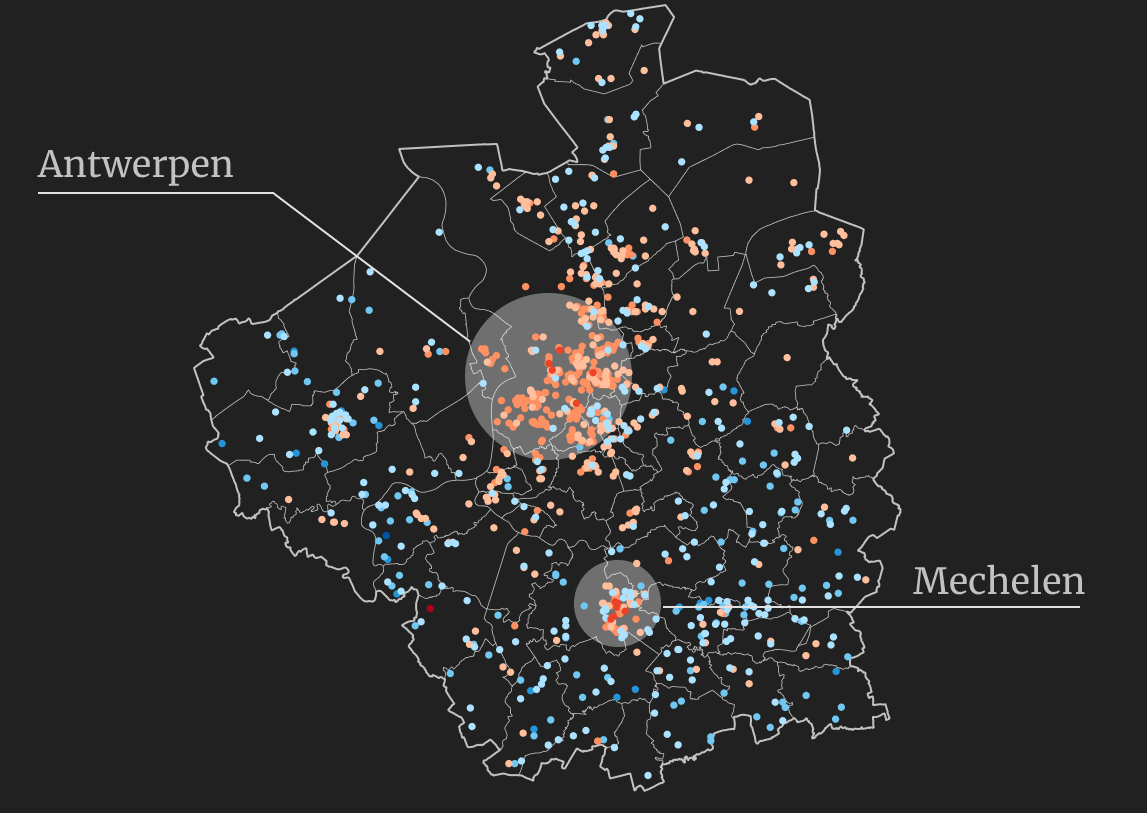
There is no such thing as ‘the’ heat island effect
An interesting observation: there is no such thing as “the” heat island effect. Every city has its own dynamics. The larger and more densely built up, the greater the heat island effect. As the largest city, Antwerp stands out. But even in Ghent, Mechelen or Leuven the heat lingers until the early morning.
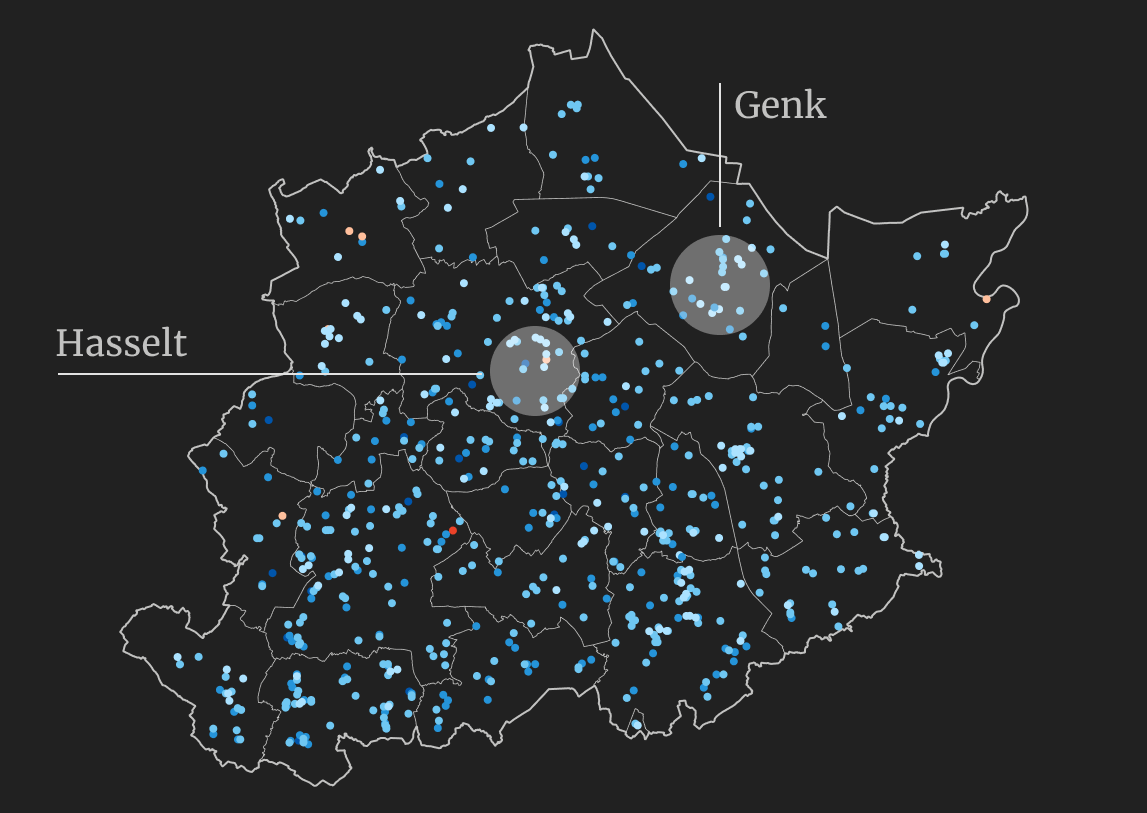
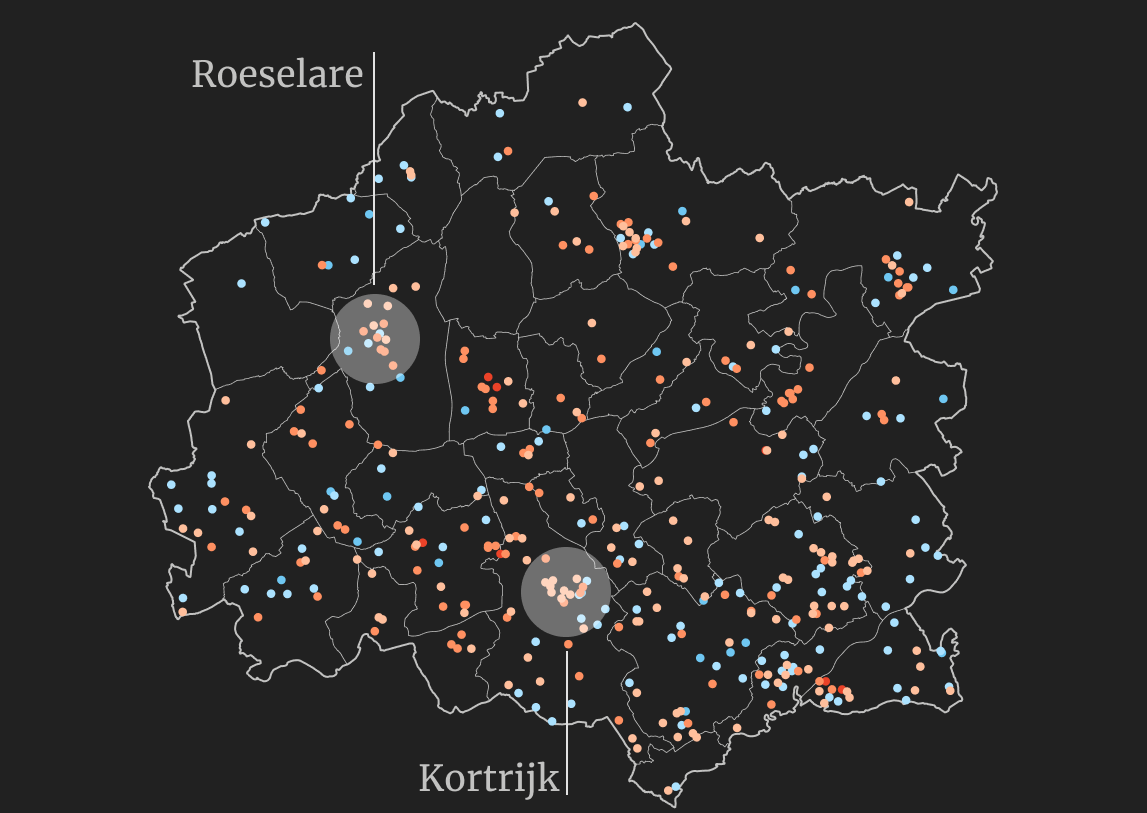
Cities like Genk or Kortrijk stand out less on the maps. ‘A lot depends on how compact a city is built,’ says Lembrechts. ‘Genk, for example, has a less densely built-up city center, but rather a wide-spread development. More compact cities have urban planning advantages, but must consider adequate cooling in their urban planning.’
Regional differences also stand out. For example, in the Kempen region and in Limburg there are often temperature peaks on hot days. The sandy soil heats up faster and there is no cooling sea breeze that brings relief. But during the night the Kempen and Limburg gardens cool down well. ‘Sandy soil heats up more strongly in the sun, but also quickly loses its heat again,’ Lembrechts explains. ‘So the difference between day and night is usually greater in the Kempen than at the coast.’
The heat island effect is also a dynamic phenomenon that can be experienced differently every night. ‘The effect is most pronounced during clear nights, warm or cold,’ says Lembrechts. But on cloudy or rainy nights, there is little sign of it. That’s when classic weather patterns take over, such as a rainstorm washing away the heat or a cold front moving across the country. That rain is often not distributed evenly across the region, so other patterns appear on the dot map.
The June RMI data show that it rained a lot less than average in the Kortrijk region, which meant that it was locally warmer at night than in other regions. These regional differences can influence the size of the heat island effect in each city from day to day.
An extreme example of the impact of weather phenomena can be seen on the night of June 20-21, when a heat storm rolled over Flanders, coming in from France. You can see clearly how a blue wave rolled from west to east, washing away all the heat.
A difference between day and night
But it gets really interesting when we compare day and night. Because during the day the heat island effect plays much less. The Curious Noses data already showed that in urban gardens you can cool down just as well in the shade of buildings and trees. How you design your garden has a big impact on how it feels during the day, but also on the warming of the soil, and thus how plants and soil life thrive in your garden.
This was evident when we looked at maximum temperatures in the garden soil. Contrary to expectations, there was no heat island effect on that dot map: urban garden soils are not necessarily warmer during the day than those in the countryside.
But on the urban fever at night and how we experience it when we sleep, we have less impact. The heat spreads through the city at night and lingers between the buildings like a warm blanket,’ says Jonas Lembrechts.
Whereas the soil temperature shows a diffuse picture during the day, you can see clear patterns in the map of the air temperature at night.
It is the first time that this fascinating difference has been mapped so accurately with a sensor network.
So are we defenseless against urban fever at night? ‘Not quite,’ says Lembrechts. ‘We still see big differences between gardens that are close to each other. You do have an influence as a gardener. This may have to do with the amount of greenery or paving in your garden, and how much heat your garden gives off in the evening. We want to analyze that further. In a garden with ten trees, you might have a cooler head start.’
And what if the neighbors also have ten trees? And the rest of the neighborhood too? Then together you have a small forest. That is the interesting question’, says Lembrechts: ‘We see our gardens as isolated places, but from a climate perspective they can form one big park. If we work together, perhaps we can provide a lever against the nocturnal heat island effect.’
This is then a matter of collective responsibility of neighbors, but also of urban planning and landscaping in which parks and natural areas close to the city can play a key role. ‘We’re going to use this beautiful dataset we are amassing to find out how big that collective effort has to be to have an effect,’ says Lembrechts.
3DLab-member Charly Géron’s second paper recently got featured on www.eoswetenschap.eu! Here is an English translation of the story they brought there:
—-
Plants from warmer regions feel perfectly at home in our cities. From there, they can colonize the countryside.
Exotic animal and plant species that settle outside their natural range cause biodiversity loss. They can displace indigenous species. To be able to do tackle that issue, it is important that researchers gain insight into how this colonization process takes place.
For 24 exotic plant species that occur in Western Europe, scientists investigated from which climate zones they originated. They also looked at the habitats they tended to colonize in our country. This excercise showed that exotic species that are more often found in urban areas generally come from warmer and drier regions.
In cities it is often several degrees warmer than in the surrounding countryside. This is a result of the so-called heat island effect, caused by the large amounts of stone and concrete in the city. It is also often drier in cities because the large percentage of impervious surfaces prevent water from seeping into the ground. ‘This connection between urbanity and climate of origin is therefore not surprising, but it had never been thoroughly investigated before,’ explains ecologist and author Charly Géron (UAntwerpen and ULiège).
‘Cities can serve as an outpost from which exotic species can colonize other areas when it gets hotter and drier there as well,’ says Géron. ‘In addition to the direct negative impact of urbanization on nature, this favouring of non-native species provides an additional negative effect of cities.’ Better monitoring of which species are popping up in cities could help nip the advance of exotics in the bud at an early stage, the scientists suggest.
Young bluebell (Hyacinthoides non-scripta) surrounded by flowers of yellow archangel (Lamium galeobdolon)
The common bluebell (Hyacinthoides non-scripta), the signature flower of the Hallerbos
Single bluebell flower surviving on a wetter spot, as indicated by the field of wild garlic (Allium ursinum)
A really wet patch of forest, with giant horsetail (Equisetum telmateia) in a field of wild garlic (Allium ursinum)
Wild garlic (Allium ursinum) in the Hallerbos flowers a bit later than the bluebells, yet this one was already in full bloom
A bumblebee visiting yellow archangel (Lamium galeobdolon)
A bumblebee visiting yellow archangel (Lamium galeobdolon)
Wild garlic (Allium ursinum)
Wild garlic (Allium ursinum)
Weirdly beautiful, the inflorescence of pendulous sedge (Carex pendula), typical for the wettest spots in the forest
Weirdly beautiful, the inflorescence of pendulous sedge (Carex pendula), typical for the wettest spots in the forest
A little stream in the Hallerbos, surrounded by endless fields of wild garlic (Allium ursinum)
The herb-paris (Paris quadrifolia), less common in the forest
Wild garlic (Allium ursinum)
Bluebells (Hyacinthoides non-scripta)
Weirdly beautiful, the inflorescence of pendulous sedge (Carex pendula), typical for the wettest spots in the forest
Another one from the wet plots: large bitter-cress (Cardamine amara)
Another one from the wet plots: large bitter-cress (Cardamine amara)
Young beech leaves, as soon as they are fully grown, spring in the understory is over
A beech forest without understory, most likely too dry and too acid for any survivors
A young beech seedling (Fagus sylvatica), looking nothing like a beech, yet everything like a tiny dancer
Young beech seedling (Fagus sylvatica)
Bluebells (Hyacinthoides non-scripta)
Bluebells (Hyacinthoides non-scripta)
Bluebells (Hyacinthoides non-scripta)
Mountain melick (Melica nutans), a grass in the most amazing green
Bluebells (Hyacinthoides non-scripta) in a rare patch of mountain melick (Melica nutans), a grass in the most amazing green
Bluebells (Hyacinthoides non-scripta)
Bluebells (Hyacinthoides non-scripta)
Montpellier 2017
The entrance to the cathedral of Montpellier
The cathedral of Montpellier
The entrance to the cathedral of Montpellier
The cathedral of Montpellier
Narcissus poetics
The cathedral of Montpellier
The botanical garden of Montpellier
The botanical garden of Montpellier
The botanical garden of Montpellier
Brackish Camargue vegetation
Brackish Camargue vegetation
Brackish Camargue vegetation
A typical lagune
Brackish Camargue vegetation
Camargue horses
Camargue horses
Camargue horses
Brackish Camargue vegetation
Brackish Camargue vegetation
Brackish Camargue vegetation
Camargue horses
Brackish Camargue vegetation
Little egret in the evening sun
Flamingo’s in the evening sun
A typical lagune
Dandelion fuzz
Grass lily
Grass lily
Dandelion fuzz
Veronica in a sea of poplar fluff
Euphorbia in a sea of poplar fluff
Poplar
Gare du Midi, Brussels
Gare du Midi, Brussels
Gare du Midi, Brussels
Gare du Midi, Brussels
Sweden autumn 2016
Autumn in Abisko
Yellow leaves of mountain birch, with lake Torneträsk in the background.
Lapporten, the gate to Lapland, in Abisko
Rain blowing over the Abisko National Park
The colours of the north: red fireweed and yellow mountain birches, with lake Torneträsk on the background
Yellow leaves of mountain birch, with lake Torneträsk in the background.
Rain on the background, the ski lift in Abisko on the foreground
The steep slope of mount Nuolja on a dramatic looking morning
The beautiful colors of lake Torneträsk in Abisko
A little stream on top of the mountain, with a view on Lapporten, the gate to Lapland
Well, that is a beautiful table with a nice view on lake Torneträsk in Abisko
Our little experiment on top of the mountain in Abisko, with a view on Lapporten
Autumn in Abisko is extremely colorfull
The ski lift with a view on Abisko National Park and Lapporten
Hiking dowhill towards lake Torneträsk
This green is greener than the greenest green: moss on top of mount Nuolja
Well, that is a beautiful table with a nice view on lake Torneträsk in Abisko
The ski lift with a view on Abisko National Park and Lapporten
The ski lift with a view on Abisko National Park and Lapporten
The most beautiful hiking trail of the world: Nuolja in Abisko
Angelica archangelica, often the biggest plant of the Arctic
The most beautiful hiking trail of the world: Nuolja in Abisko
Cirsium helenioides, the melancholy thistle
Hiking down mount Nuolja
The steep slope of mount Nuolja on a dramatic looking morning
The colours of the north: red fireweed and yellow mountain birches, with lake Torneträsk on the background
The prettiest yellow and blue: autumn in Abisko
Fireweed, Epilobium angustifolium
Campanula or bellflower, I think ‘uniflora’
Vaccinium myrtillus
Cornus suecica, the prettiest red of the world
Hieracium alpinum, alpine hawkweed
Carex atrata, one of my favourite sedges
Alpine clubmoss, Diphasiastrum alpinum
Agrostis capillaris, bentgrass
Common yarrow (Achillea millefolium)
Anthoxanthum odoratum, sweet vernal grass, fully grown and mature
Snow scooter trail
Our plot in the mids of a field of horsetails (Equisetum pratense)
Equisetum pratense
Cliff overlooking the valley with the road to Norway
Seedling of Taraxacum officinale, the dandelion, after two years of growing in bad conditions
Poa alpina, the alpine meadow-grass, with its viviparous seeds
Massive flowerhead of Angelica archangelica
Angelica archangelica
Blueberry (Vaccinium myrtillus) in autumn
A lowland marsh in Abisko in autumn
Installing the plots of our trail observations on top of mount Nuolja
Installing the plots of our trail observations on top of mount Nuolja
Tanacetum vulgare (Tansy), non-native for the high north
Autumn forest down in the valley
The valley of Nuolja to Björkliden
Summer on the Nuolja-side
A full rainbow behind mount Nuolja in Abisko
It’s raining in the west, clouds trapped behind the mountains
A strong wind blowing rain from behind the mountains to our side
A strong wind blowing rain from behind the mountains to our side
Betula nana, the dwarf birch, mini autumn forest
Betula nana, the dwarf birch, mini autumn forest
The valley of Björkliden in autumn
The valley of Björkliden in autumn
The valley of Björkliden in autumn
The valley of Björkliden in autumn
Sweden spring 2016
Silene suecica
Ranunculus glacialis
Rubus arcticus
Salix reticulata
A rainy hike
Dryas octopetala
The valley of the lakes
Although the alpine zone has been harder for invasives to access than most places, human structures like trails are often an easy gateway for the invaders to get up there. Picture from Abisko, Swedish Lapland.
Silene acaulis
Cornus suecica
Eriophorum vaginatum
Western European species like the red clover (Trifolium pratense) here are often listed as non-native species in mountain regions.
Trifolium pratense
Trifolium repens
Bartsia alpina
Overlooking the valley of Laktajakka
Ranunculus glacialis
Melting snowpatch on a lake
Oxyria digyna
Amiens
Winter sun on the Place du Don
Colourful mirror
Gargoyle planning to eat the cathedral
Sun rising above the water
Cathedral at night
Enjoying silence and the morning sun
Sunny but cold, the Quai Bélu
Just outside of Amiens
Cathedral with a glimpse of spring
Maria without a shirt
View from my office window
Cathedral seen from the frozen Parc Saint-Pierre
Cathedral at night
Amiens is filled with cute little houses
Frozen mirror
Cold!
Nice architectural curve
Le Club d’Aviron in winter weather
View from my office window
The museum behind the beautiful gates
Almost cold enough for ice-skating
Frozen to the bone
Sunny but cold, the Quai Bélu
Cathedral at night
The southern side
Cathedral at night
House on the square before the cathedral
Sweden autumn 2015
Lichen
Sweden summer 2015
View on the 1000 meter plots
Doing research on a cold Arctic morning
Plots flooded by the snowmelt
Flooded by the snowmelt
Meltwater river, racing down the mountain
After a hike, even the most basic house looks cosy. Little hut in the mountains, open for everybody
Snowbridge, maybe don’t cross…
Snowbridge
View from a cliff
Silene acaulis or cushion pink, cutest plant of the Arctic
Two seasons in one image
Steep slope
Hiking down
Narvik Kirche, church of the subarctic
Narvik Kirche
Reindeer on top of the mountain
Narvik Kirche
Summer at the church
Summer flowers
Massive waterfall
Young willow catkins
View from Narvik’s hospital, with lilac flowers
Building a bridge over the fjord will gain al drivers at least an hour
Norwegian fjord
Posing with the water, getting soaked
Minimalistic mountains
Insect investigating our reindeer antler
Catching mosquitoes with our license plate, harvest of the year!
Posing with the plot
Fieldwork on the most beautiful spot of the world
Fieldwork on the most beautiful spot of the world
Summer bridge – still next to the sadly impassable river
Rhinanthus flower in the mountains
Plateau in the valley, beautiful brown
Experimental view from my favourite plot
Salix catkins
Extremely old Betula tree
Waterfall from a cliff
Buttercup is the earliest in spring, here
Rocks!
Alpine views
Views!
Fieldwork
Jumping over rivers
Plot
Golden plover
Angry lemming
Green, the whole north is green!
Snow, so much snow left!
Minimalistic mountain moments
Fieldwork
The research center
Red clover – focal invader
Look at this tiny cute snail!
Massive floods of melting water
Bartsia alpina
Hooray, a toilet!
Dryas octopetala
Lowest elevation plots
Butterball!
That’s a lot of water
Midnight sun is the best
At the lakeside
Beautiful Bistorta vivipara
Don’t fall in the water
Midnight sun
Wild river
Art – made by ages of wild rivers
Baby firework for America’s independence day
Midnight sun at the lake
The Abisko canyon was wilder than ever
That’s a crazy amount of water!
The Abisko canyon was wilder than ever
The Abisko canyon was wilder than ever
Black and white
Stone-man overlooking Abisko
Nothing as soft as a willow catkin
Label and soil temperature sensor attached
I’d drive to the top every day
Reflections
Rocks and clouds
Brave little birch
Brewing our camping poison
Basic camping stuff
Camping in Norway
Home-made temperature houses
Roadside research at its best
Norway is crazy
Horsetail is so funny
Little creek in magical forest
Birches, birches everywhere
Beautiful rock, a gift from the river
Another roadside fellow
Lichen
Ready to rock the summer
Collecting mosses
That’s a crazy old lichen
Tiny tiny piny trees, but old, so old!
Ready to jump into the fjord?
Ready to jump into the fjord?
That’s a spiky stone!
Views on Norwegian fjords
Silene in the mountains
Cute little orchid
Skua
Attacking skua, mind your heads!
Watch out for the attack of the fierce skua!
Black snail
New plot!
Still a lot of snow to melt, but this spot was free for a new plot
Reindeer are better than people
Two seasons in one picture
Let’s see what is happening to the balance in mountains! Is this a starting avalanche, or will it last a bit longer?
Cute little hut
Climbing mountains by car
Softest moss in history
Drosera in the marsh
Hiking in no-man’s land
The clouds are coming
Abisko valley
‘Butterball’
Fieldwork in the tundra
Abisko valley
Little plot
Clouds and sun and mountains
Making soup on a campfire with a view
Little creek on high elevations
Skua on the look-out
Melting snow in a river
Rhodiola rosea and the Törnetrask lake
Beginning of spring
Flooded plots, melting snow, impassible wetness
Ferns and horsetails
Chile 2015
Lunch made by our local colleague, with funny bread (tasty as well!)
Trips to the field sites were sometimes a real adventure, especially right after snowmelt


")


")
")


")


")


")

")


")


