I find it of paramount importance that students learn how to communicate their research. Summarizing their ideas and findings for a broad audience challenges them to keep the ‘why’ in mind for their research, and reminds them they are part of a bigger effort to solve the remaining mysteries of our world. In this mini series, all master students of this academic year present their work in around 300 words. Third post: Renée Lejeune.
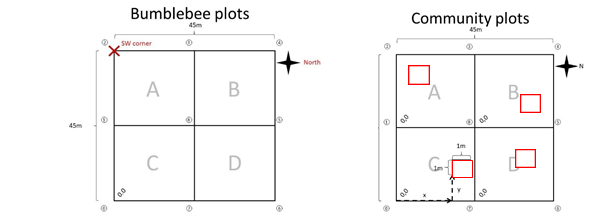
In this project, we try to link distribution limits of the plant species present on the ‘Nuolja’ mountain in the Scandinavian tundra with pollinator presence. Plant surveys were done along a specific transect on Nuolja to determine all the present species and their abundance per location. The transect consist of 13 locations along the whole elevation gradient. The same 13 locations were also used for the bumblebee surveys. Per location, bumblebees were surveyed in one big plot, and vegetation was surveyed in 4 smaller plots equally distributed in the different quadrants (A, B, C & D)(see figures below).
During bumblebee surveys all visited plant species were noted down. The research will only focus on the plant species visited by bumblebees. For these selected plant species the elevation limit can be determined and since plant surveys were done in previous years as well, a possible shift in elevation limit can be seen. For the bumblebees similar elevation limits can be determined and also a possible shift in these limits. Depending on how well both elevation limits match with each other, we can calculate how much variation in the plant distribution can be explained by the presence of pollinators.
We hypothesize several possibilities: for example, when bumblebees occur all across the elevational gradient on different plant species, we could expect a smaller or even no effect on upward plant movement. A bigger effect might on the other hand be seen when the bumblebees themselves are limited to certain heights and plant species moving up would thus have to wait for their pollinators. Disentangling these relationships is important to understand the role of pollinators as facilitators – or hindrances – for plant distribution changes. This can also give a better idea of how climate change directly and indirectly, through pollinators, affects plant distribution.
I find it of paramount importance that students learn how to communicate their research. Summarizing their ideas and findings for a broad audience challenges them to keep the ‘why’ in mind for their research, and reminds them they are part of a bigger effort to solve the remaining mysteries of our world. In this mini series, all master students of this academic year present their work in around 300 words. Second: Amber Pirée!
Most of us in Belgium will remember the past summer’s weather as outright miserable. The debilitating heatwaves and problematic water shortages of the summers of 2018, 2019, and 2020 may have already started slipping our minds. Yet such heatwaves and droughts, interspersed with periods of extreme rainfall and flooding, are predicted to become the new normal. During the sweltering days and nights in a heatwave period, we often seek coolness from air conditioning, take more refreshing showers or install swimming pools for children to play in. Our gardens and arable lands are being watered more often to keep plants from withering. As important as refreshing is on such days for our health, it is accompanied by high economic and climate costs.
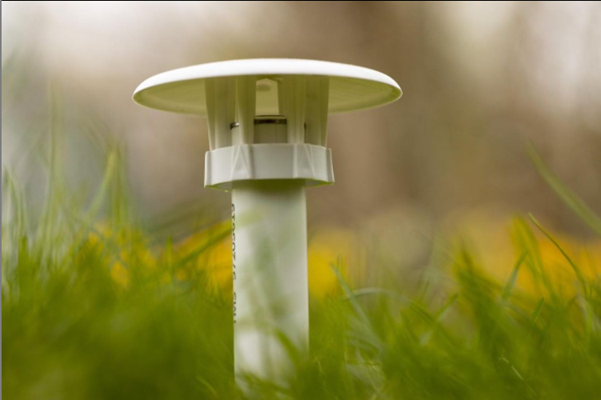
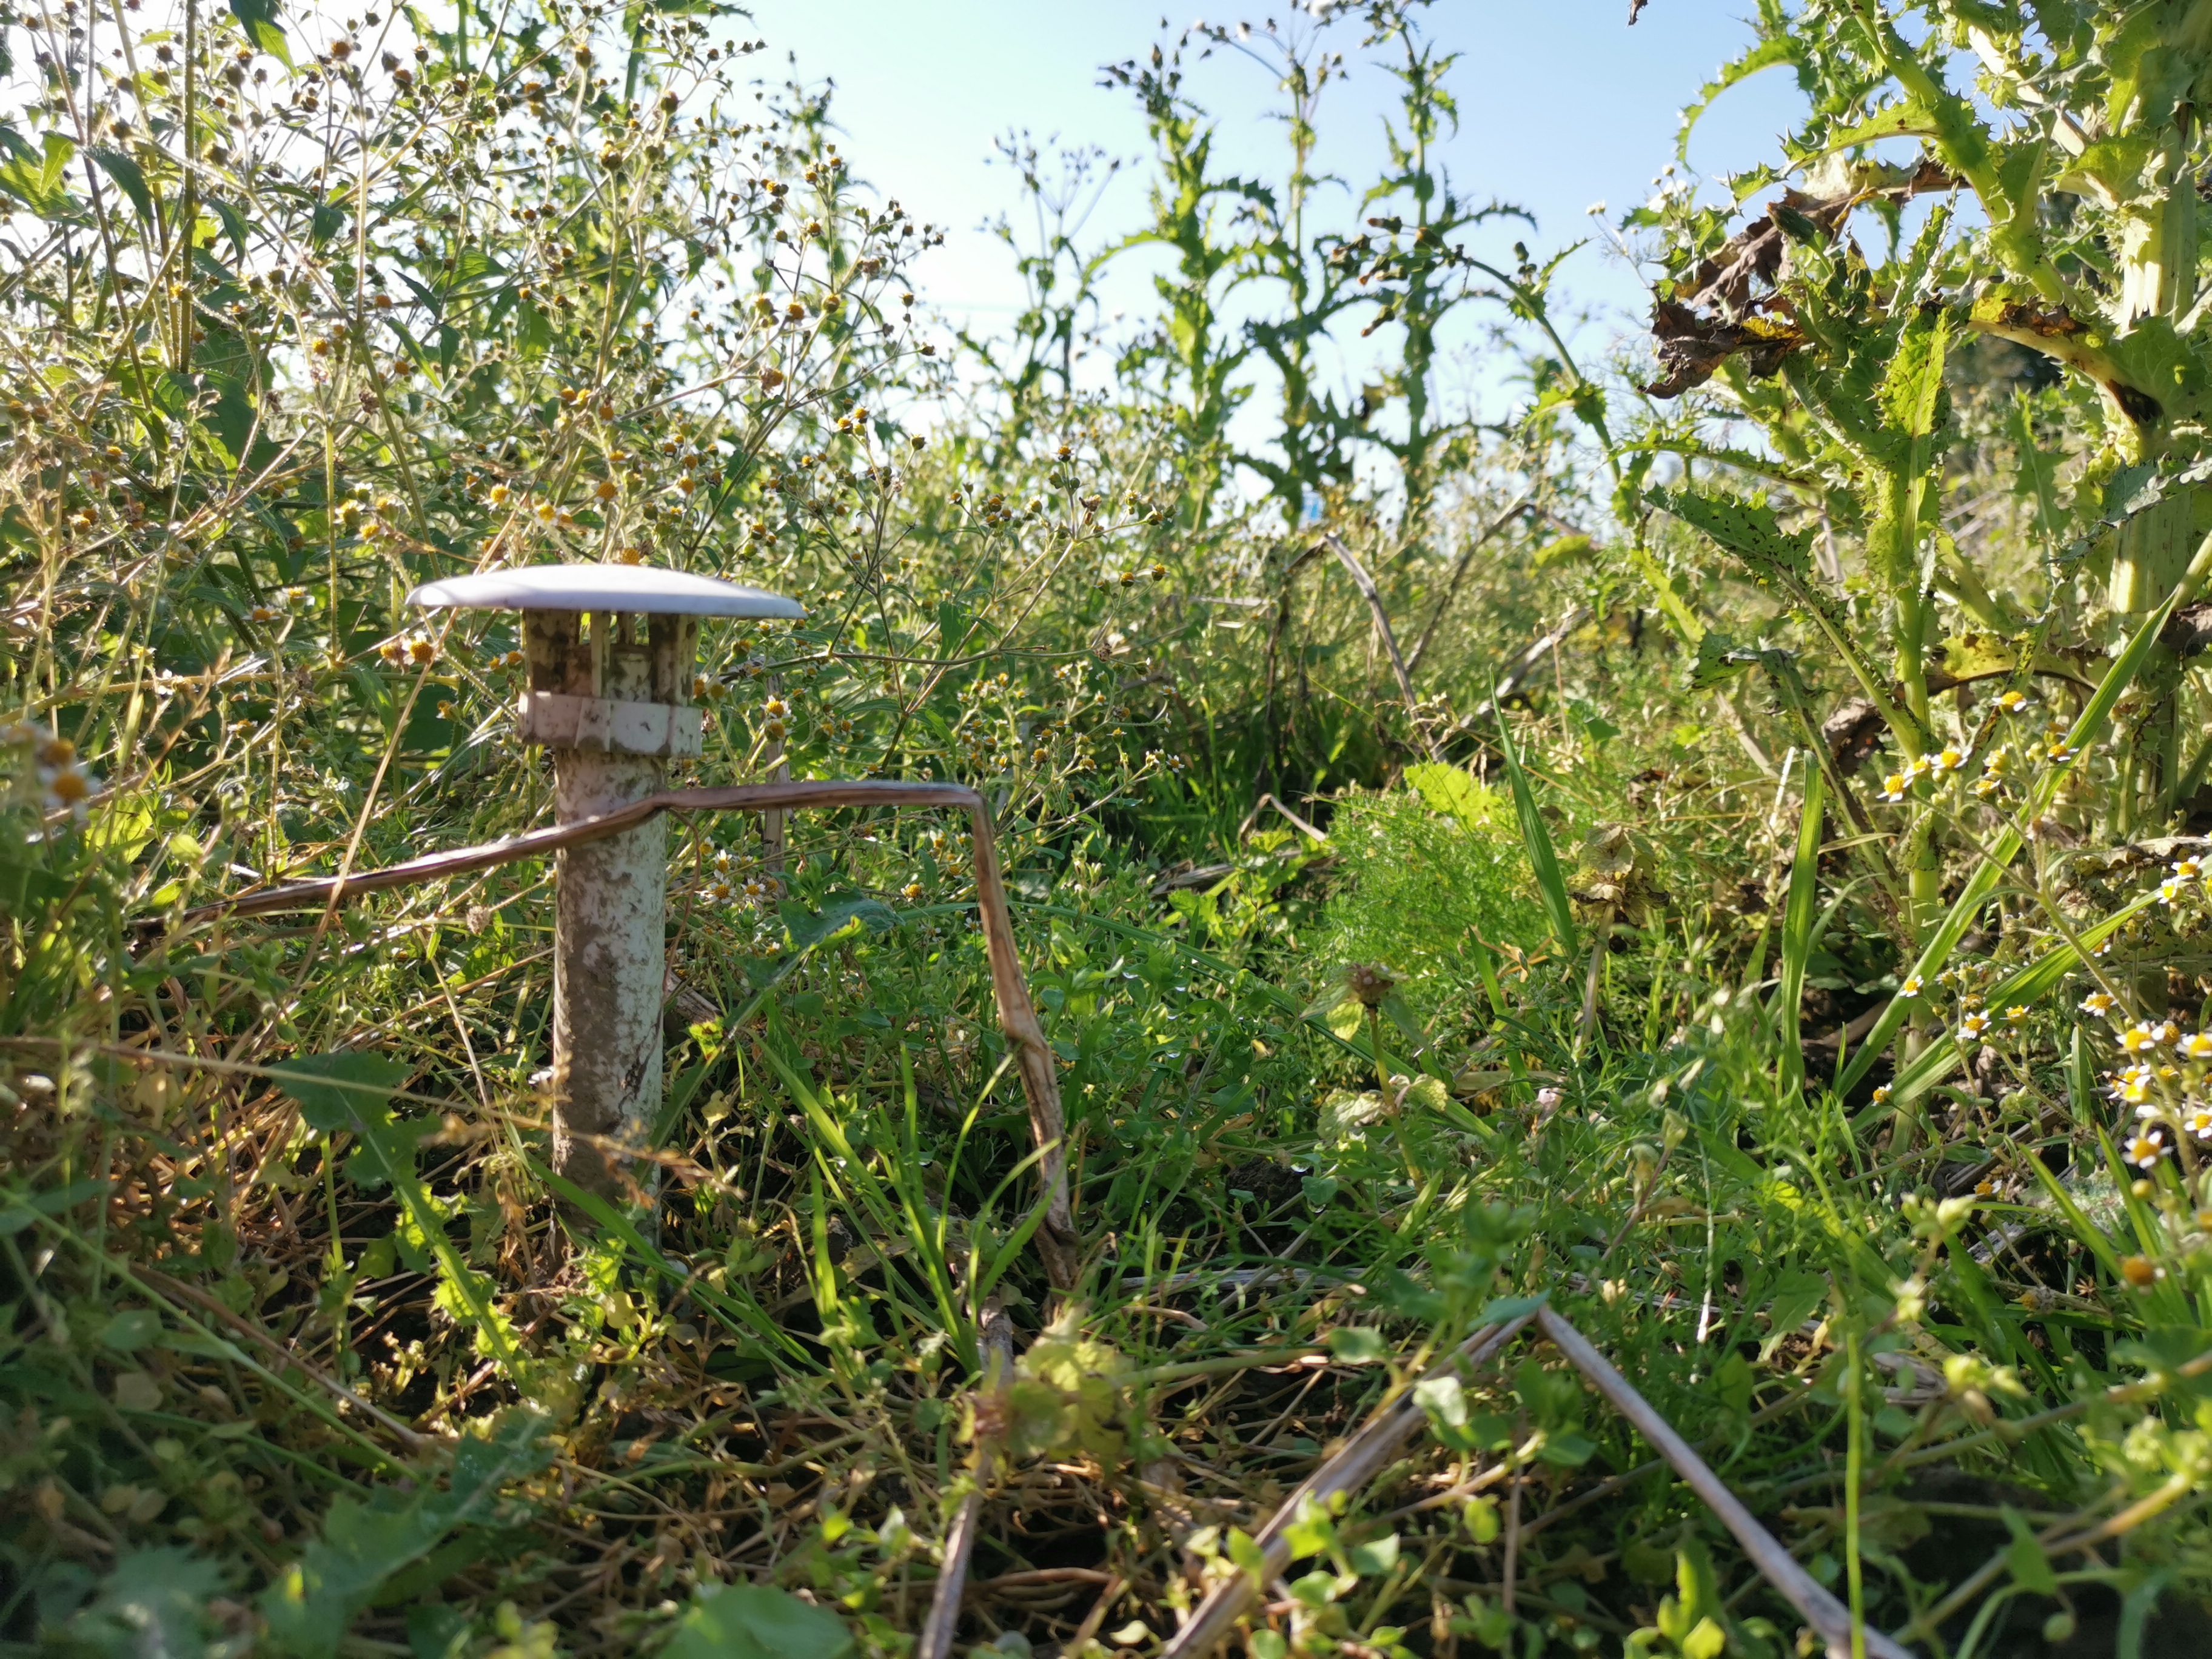
Another well-known way to escape some of those high temperatures in the city, is seeking shelter in nature. We experience that urban areas get warmer than rural areas, because cities, with their paved surfaces and dark materials such as asphalt and concrete, retain heat longer. In Belgium, 98% of us live in these urbanized areas, making it important to investigate how we can bring more of that countryside refreshment into the city. Therefore, almost 5 000 participants of the ‘CurieuzeNeuzen in de Tuin’ citizen science project placed small weather stations (affectionally called ‘lawn daggers’) in their gardens. Additionally, we installed a network of these sensors across nature reserves.
‘Lawn dagger’ @Bart.vdsm
This generates a unique dataset of microclimate data on soil temperature and soil moisture for the whole of Flanders. In this strand of the ‘CurieuzeNeuzen in de Tuin’ project, we ask ourselves: are these nature reserves cooler than urban gardens? And how far into the city does the influence of natures’ natural airco’s reach? More specifically, we will look at the influence of the amount of paved surfaces, forest or grassland, water elements, and agriculture on local temperatures. The ultimate goal? Quantifying the buffering impact of nature and green spaces on microclimate – and thus the quality of life for humans and nature – in a highly urbanized region.
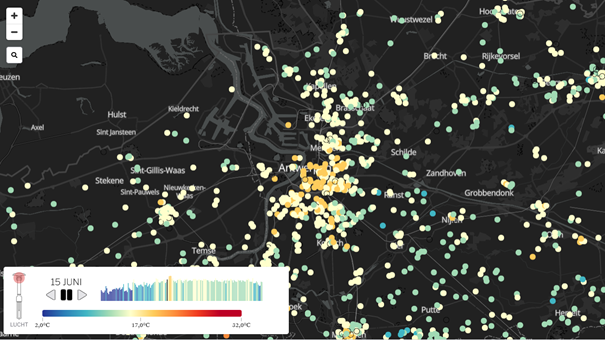
Temperatures in the city center of Antwerp during the night of June 15 were up to 9 °C higher than in the surroundings. Figure made by De Standaard.
I find it of paramount importance that students learn how to communicate their research. Summarizing their ideas and findings for a broad audience challenges them to keep the ‘why’ in mind for their research, and reminds them they are part of a bigger effort to solve the remaining mysteries of our world. In this mini series, all master students of this academic year present their work in around 300 words. First up: Dymphna Wiegmans
Historical data over the past 100 years may reveal important climate and land-use change impacts on vegetation composition in the Scandinavian mountains.
With the looming presence of climate change, subarctic ecosystems are changing rapidly in vegetation composition. Plant species are either moving uphill or disappearing entirely, with dramatic repercussions for ecosystem health and stability.
Climate change is occurring twice as fast in subarctic regions than in most others, but this is not the only major disturbance, land-use change and tourism are two other common disturbances that may disrupt native vegetation and introduce new species to a region. Together, these pressures could lead to a shift in biodiversity and ecosystem functioning.
Our research focusses on the Abisko region – a village in Northern Sweden that lies approximately 250 km above the Arctic circle. Due to low mean annual temperatures, arctic permafrost occurs here and the region accommodates a unique biodiversity, with a lot of rare plant species. However, climate change, land-use change, and tourist activity increasingly impact this region. For instance, intense human activity and warmer temperatures lead to the introduction of ruderal species that are exploiting the warmer climate and increased disturbance. Due to their ecological needs, ruderal species may increase in numbers over time and will contribute to changes to the subarctic ecosystems in Abisko.
The Rallarvägen trail around Abisko, setting of more-than–a-century-old vegetation survey
In 1903 and 1913 botanist Nils Sylvén made vegetation surveys along the Rallarvägen trail: a trail established for the building of the railroad from Kiruna to Narvik. He started in Abisko and surveyed all the way up to Riksgränsen, at the border with Norway (40 km). In the following decades, a few other surveys were done in the region, resulting in a wealth of historical vegetation data that has up till now never been left unexplored. After Sylvén’s first survey, the railroad was built in 1904, paralleling the Rallarvägen trail, with a couple of intersecting train stations and settlements. Since then, the trail itself became popular amongst hikers. In the summer of 2021, almost 120 years after Sylvén, we revisited and resurveyed the trail. Together with climate data from the Abisko Scientific Research Station (ANS), available since 1913, and with additional plant distribution data from other trails ranging from the Rallarvägen into the adjacent mountains, we intent to investigate how climate and/or land-use change influences the vegetation composition and their migrations uphill in the Abisko region.
Preparations are now in full swing for the first ever international microclimate ecology conference, which we’ll host here in Antwerp from the 28th-31st March 2022. The Microclimate Ecology & Biogeography conference is a joint collaboration between the microclimate labs from the Universities of Antwerp, Ghent and Leuven and is supported by our SoilTemp network. Both abstract submission and registration are now open, and can be found on our website!
This conference will be held in Antwerp over 4 days and will be an in-person and online event. It will cover a wide range of microclimate-related topics, from arctic ecosystems to tropical ones and all species and ecosystems in between, as well as from a tiny scale to a global scale.
We got interviewed by Flora Passfield from the BES Forest Ecology section about the what’s and why’s of our conference, very much worth checking out the story here!
In the alpine tundra of the Changbai Mountains in Northeast China, on the border with North Korea, climate has warmed significantly over the last few decades (at a rate of 0.28 °C/decade, from 1959 to 2017, to be precise). It’s a pity that we can’t go back in time to see how this has affected the mountain and its ecosystem! Or can we…?
A unique time series
In a new paper, led by Shengwei Zong and published just now in Remote Sensing and the Environment, we dug up an extraordinary time series of 54 (!) years of satellite data, starting with declassified KeyHole camera data from a US Defense satellite from 1963, and then all the way up to the most recent, high-resolution satellite imagery. The goal? Analyzing these images for changes in snow and vegetation cover on the mountain. For the latter, we focused specifically on a unique little shrub: Rhododendron aureum, an alpine shrub that conveniently stands out in autumn as it’s the only shrub in the region that keeps its green leaves when winter approaches.
Changbai Mountains, on the border with North Korea, providing the back-drop for our study. Noteworthy is the top-right picture (A), where you can see patches of Rhododendron (in dark green) stand out from a brown autumn vegetation on the mountain.
Rhododendron in retreat
In short: we show that climate change has advanced the melting of snow in spring over the last 54 years of satellite data, while it resulted in a general upward retreat in the distribution of R. aureum over the last 30 years (of applicable satellite data). This makes sense, as the species needs a good spring snow cover to survive against cold temperatures! Take away the spring snow, and conditions get much harsher.
We used our model – calibrated on the current modelled link between Rhododendron and snow cover (a), to predict its future distribution as climate keeps warming (b). While we already observe a small upward retreat now (not shown here), we expect significant further declines in area (c) and shifts in elevational optimum (d) in the future.
So, our study provides a good example of how climate change is actively affecting species distributions under our very own eyes (or at least those of our satellites), in this case through changes in snow cover. We can expect those changes to be happening all around us. However, as long-term biodiversity monitoring is still rare and far-between, these changes are often hard to proof.
Complexity abound
We here show that the increasingly long-term satellite record can provide a great alternative to long-term surveys on the ground to record such changes over decadal periods. However, and we can’t stress this enough, accurately reading satellite data and getting this information out of them is NOT easy. You’ll see this if you browse through the paper, which has an impressive methods section (cheers and applause for Shengwei Zong for persisting with the analyses), and has gone through a few rounds of deep peer review helping us to clean up loose ends and making the methodology more air-tight.
Did I say complexity? This figure gives an overview of the methodological steps taken to extract Rhododendron aureum (RA) distribution data and link it to environmental data through species distribution models.
Just to give one example of the complexities: in the Changbai Mountains, we were pretty lucky to have fairly large patches of one specific species – the Rhododendron of interest – that stand out on satellite images in autumn, while the rest of the vegetation is green. And even then, it is far from straightforward to tell your algorithm which color of green represents your species of interest, and which is noise, as often enough there are other plants intermingled with the Rhododendron.
Linking the ‘greenness value’ of the satellite images (here called ‘NDVI’) to distinguish between a large cover of herbs (brown line) or Rhododendron (green line) in autumn
And then I’m not even talking yet about the aligning of images from different satellite sources, which gets especially tricky when one dives back as deep in time as the KeyHole camera data from back in the days when accurately monitoring environmental change was most certainly not the main goal of the imagery.
In short, we hope this rather complex methodological paper holds lessons for ecologists and remote sensing specialists in the future, and can help put us further on track to use satellite data to analyze vegetation change in these times of increasingly rapid global changes.
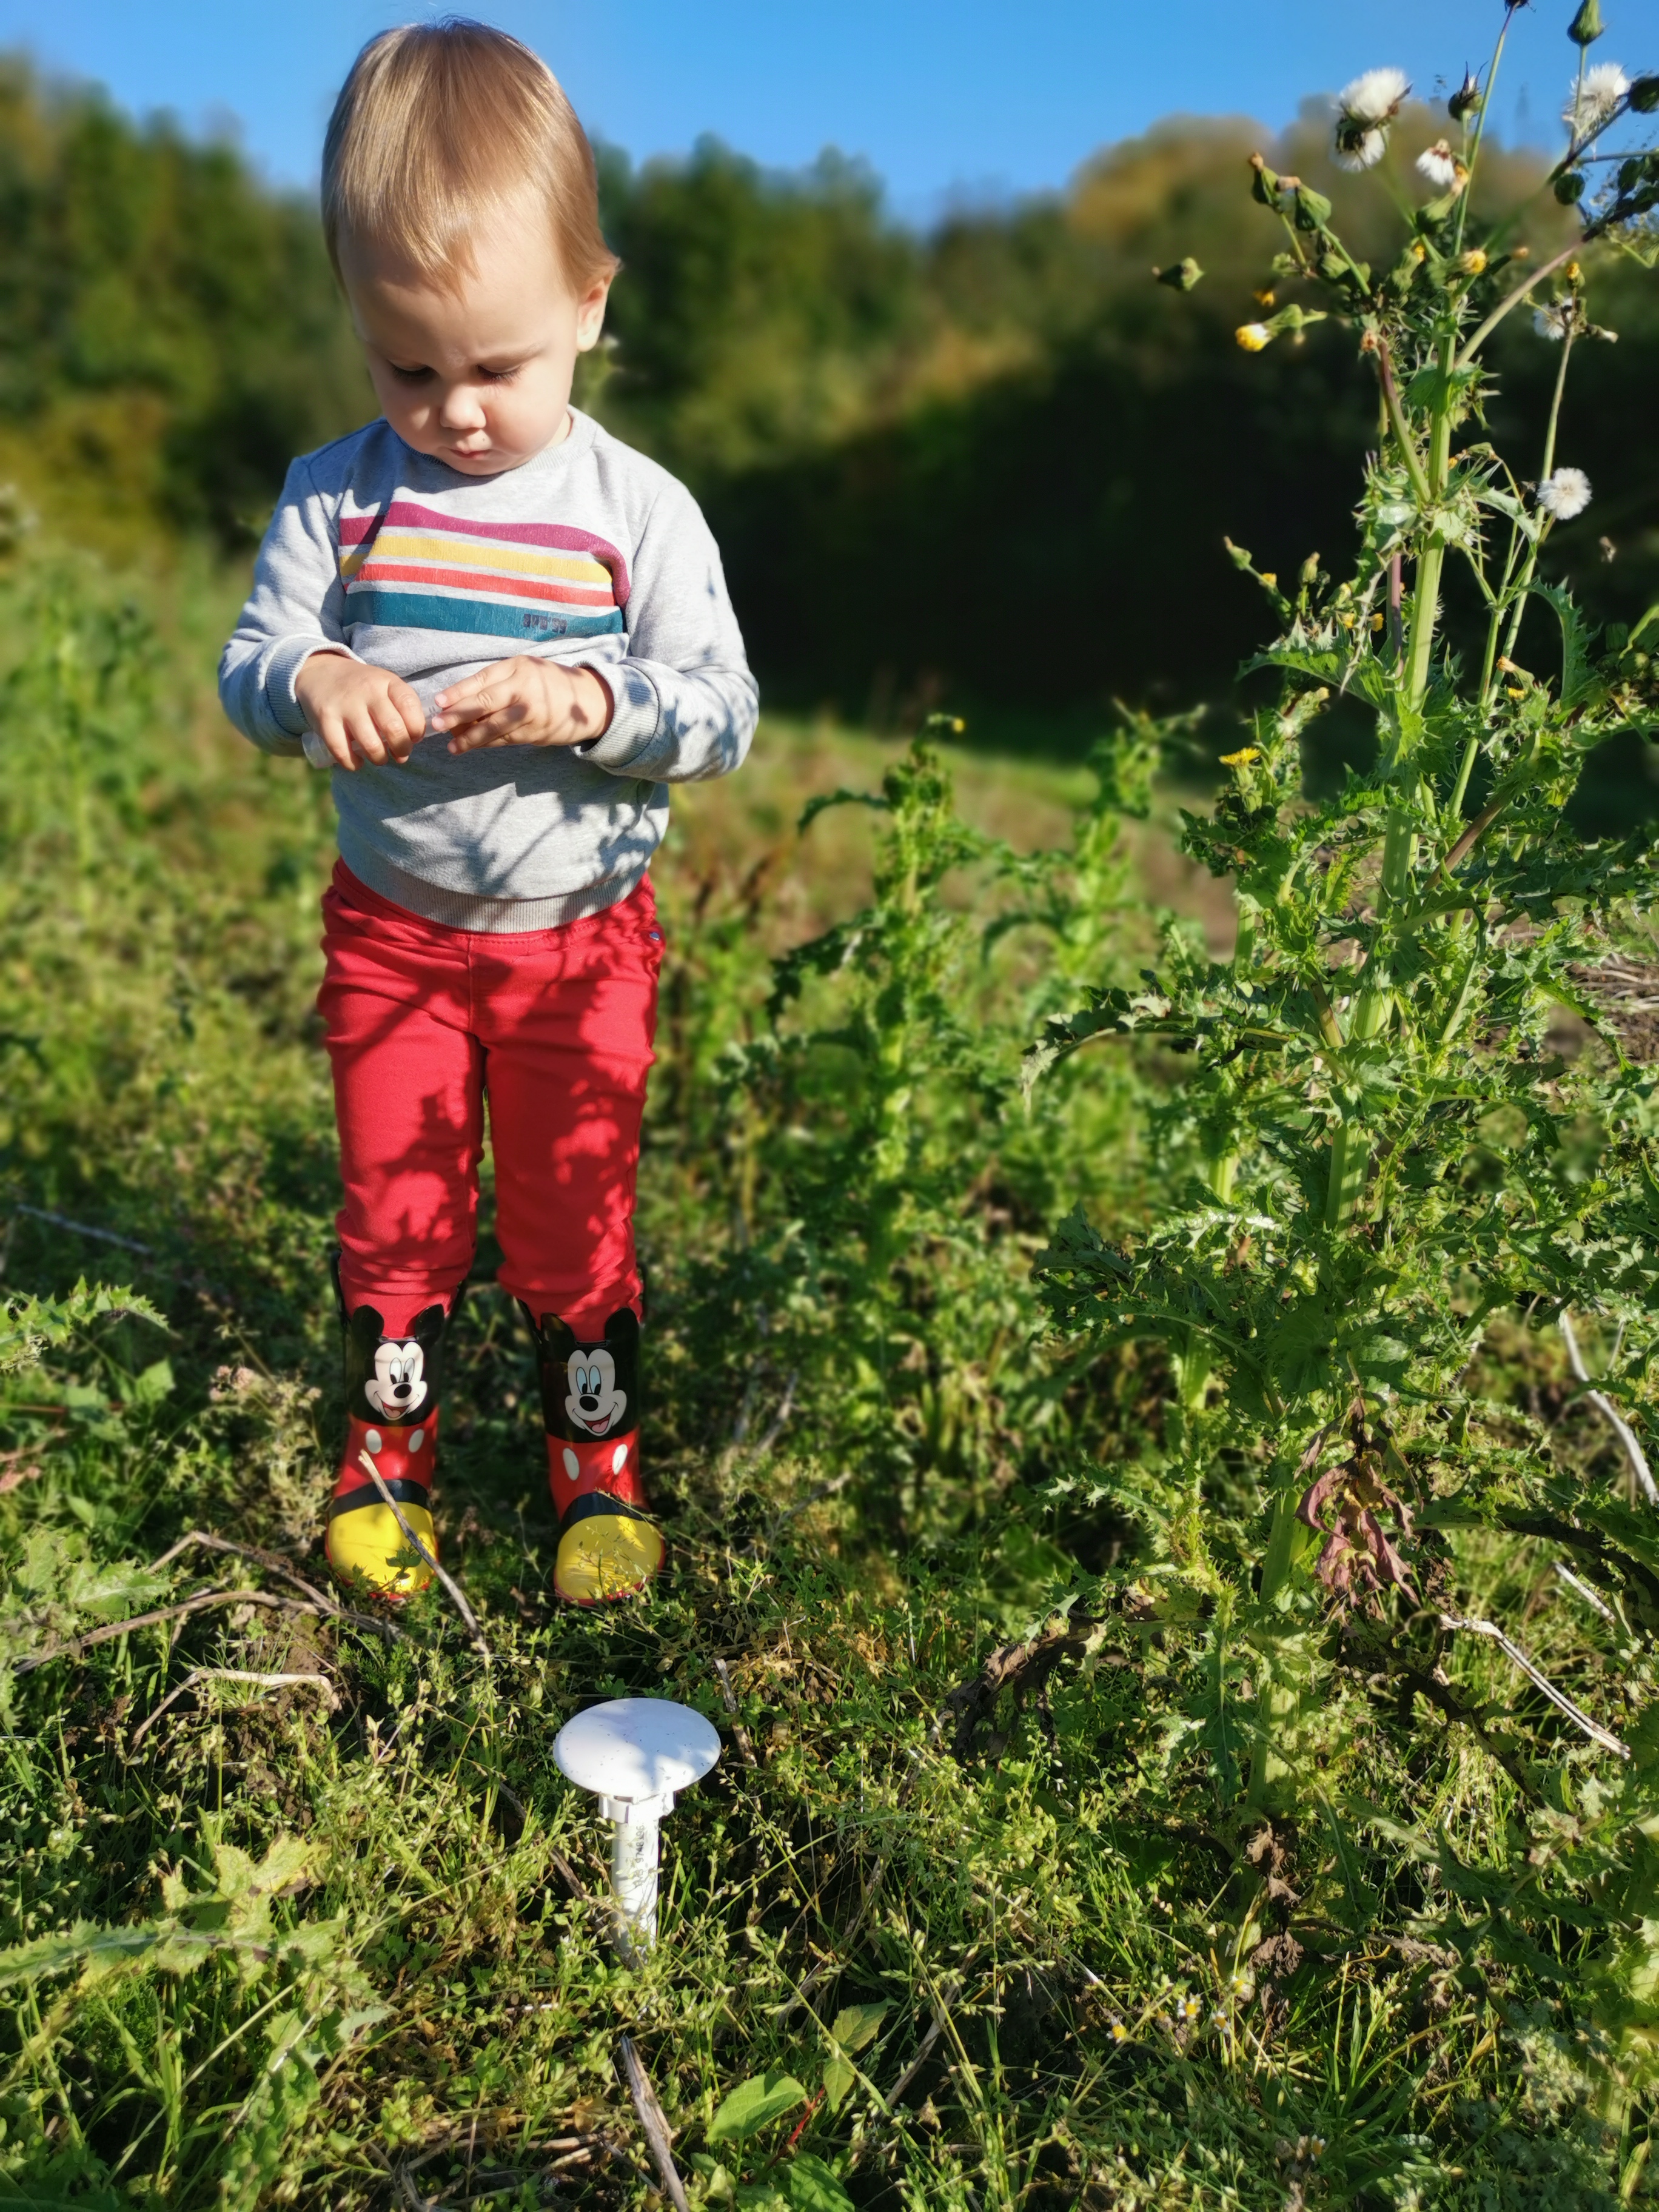
Finding ‘daddy’s little mushrooms’ has become one of the favourite activities of our oldest
I spent a happy, sunny, warm autumn Saturday on the farm with my oldest. The goal? Finding back the microclimate sensors we installed there together in early spring, and taking soil samples for soil microbial analysis. And learning about farm life, of course!
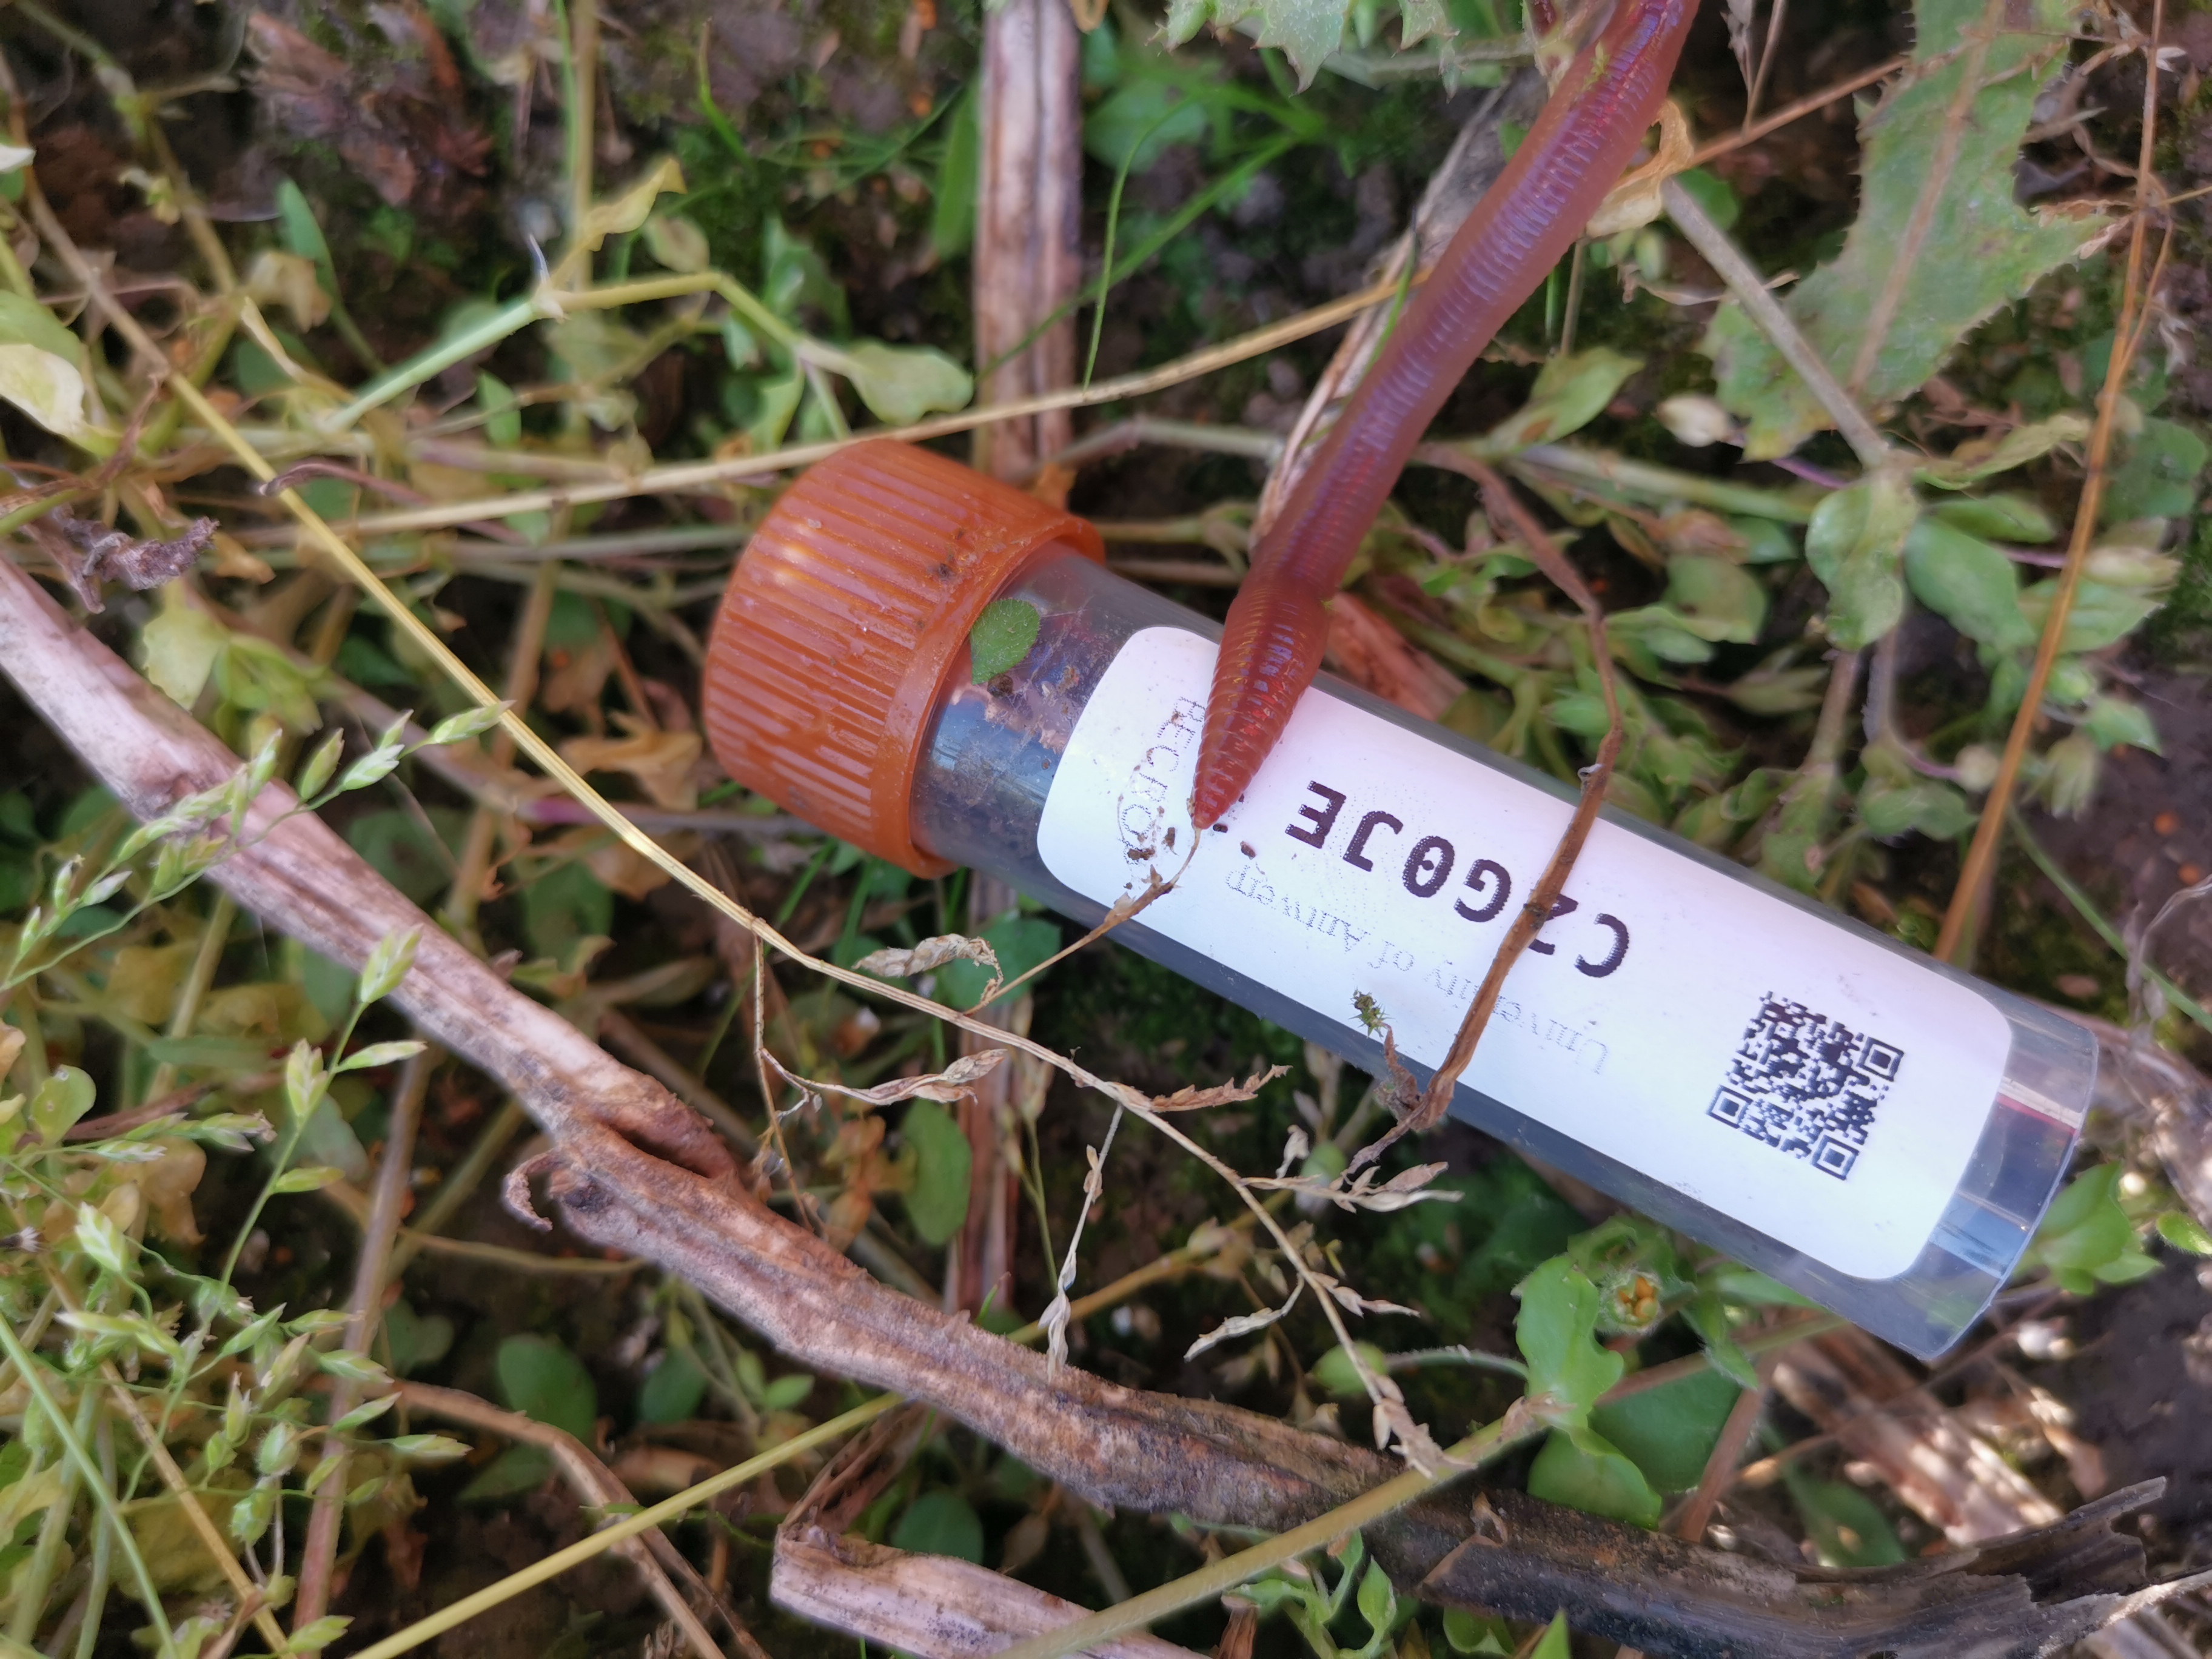
Taking a soil sample at the sensor location. Samples will be sent to ‘BiomeMakers’ in Spain, a company analyzing agricultural soils for their microbial diversity with which we partnered up
The fieldwork is part of our ‘CurieuzeNeuzen’ citizen science project, for which we also installed 500 sensors in potato fields and other farmlands all across Flanders. Goal is to see the spatial variability in microclimatic conditions across farmlands, and link these to the growth of the potato plants and the health of the soil.
This doesn’t look much like a potato field, but they are there – belowground! The diversity of plants (weeds, so you want) is the result of the organic farm methods used here.
We are participating with our community farm, where we weekly get our own vegetables. Across the farm, we installed ten sensors. The farm is small-scale and organic, so it will be especially interesting to compare with large-scale more industrial potato production we cover elsewhere.
The soil on the farm was beaming with life, perhaps thanks to the organic farming? We’ll take a look at the microbial communities and see if an organic footprint can be found back. In any case: plenty of little crawlers and creepers to show to the kid!
With that, another great day spend in nature, combining curiosity with science!
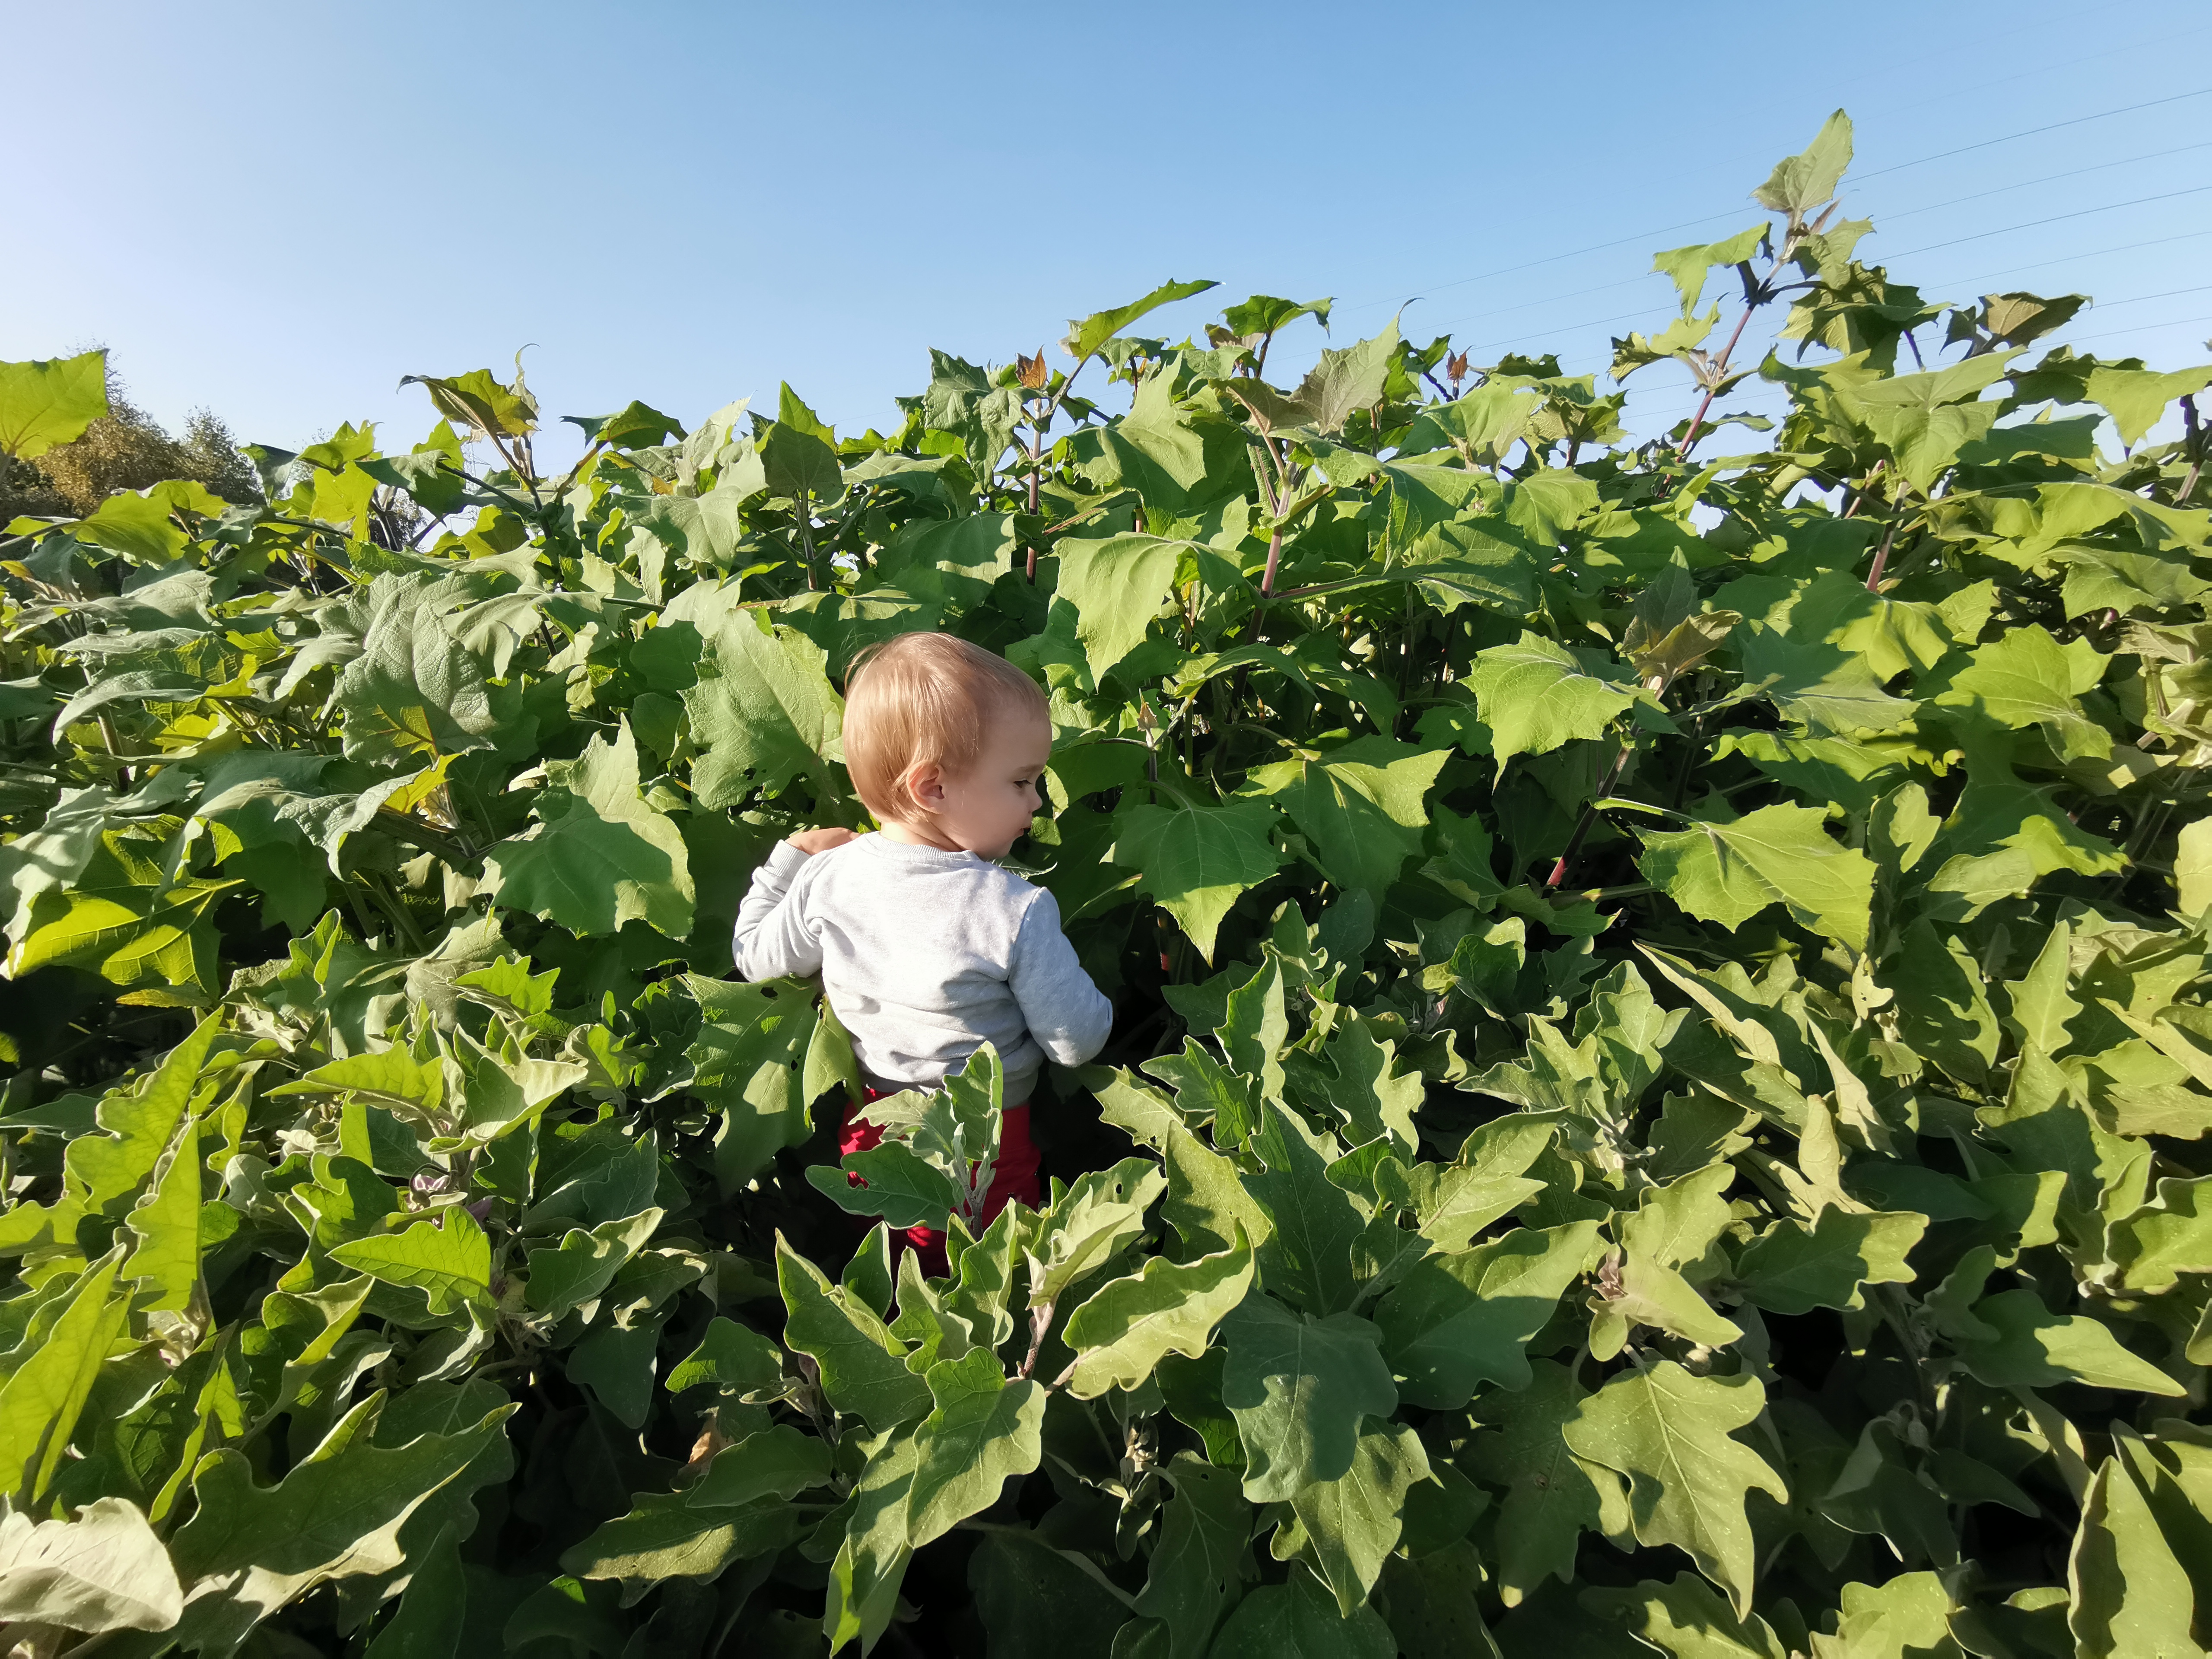
Searching sensors in a dense field of yacónMicroclimate in action: this tire is really warm, daddy!
Angelica archangelica along mountain road in the northern Scandes, Norway
Saxifraga aizoides, Narvik, Norway
Abisko, Sweden
Sweden
Hallerbos 2017
Young bluebell (Hyacinthoides non-scripta) surrounded by flowers of yellow archangel (Lamium galeobdolon)
The common bluebell (Hyacinthoides non-scripta), the signature flower of the Hallerbos
Single bluebell flower surviving on a wetter spot, as indicated by the field of wild garlic (Allium ursinum)
A really wet patch of forest, with giant horsetail (Equisetum telmateia) in a field of wild garlic (Allium ursinum)
Wild garlic (Allium ursinum) in the Hallerbos flowers a bit later than the bluebells, yet this one was already in full bloom
A bumblebee visiting yellow archangel (Lamium galeobdolon)
A bumblebee visiting yellow archangel (Lamium galeobdolon)
Wild garlic (Allium ursinum)
Wild garlic (Allium ursinum)
Weirdly beautiful, the inflorescence of pendulous sedge (Carex pendula), typical for the wettest spots in the forest
Weirdly beautiful, the inflorescence of pendulous sedge (Carex pendula), typical for the wettest spots in the forest
A little stream in the Hallerbos, surrounded by endless fields of wild garlic (Allium ursinum)
The herb-paris (Paris quadrifolia), less common in the forest
Wild garlic (Allium ursinum)
Bluebells (Hyacinthoides non-scripta)
Weirdly beautiful, the inflorescence of pendulous sedge (Carex pendula), typical for the wettest spots in the forest
Another one from the wet plots: large bitter-cress (Cardamine amara)
Another one from the wet plots: large bitter-cress (Cardamine amara)
Young beech leaves, as soon as they are fully grown, spring in the understory is over
A beech forest without understory, most likely too dry and too acid for any survivors
A young beech seedling (Fagus sylvatica), looking nothing like a beech, yet everything like a tiny dancer
Young beech seedling (Fagus sylvatica)
Bluebells (Hyacinthoides non-scripta)
Bluebells (Hyacinthoides non-scripta)
Bluebells (Hyacinthoides non-scripta)
Mountain melick (Melica nutans), a grass in the most amazing green
Bluebells (Hyacinthoides non-scripta) in a rare patch of mountain melick (Melica nutans), a grass in the most amazing green
Bluebells (Hyacinthoides non-scripta)
Bluebells (Hyacinthoides non-scripta)
Montpellier 2017
The entrance to the cathedral of Montpellier
The cathedral of Montpellier
The entrance to the cathedral of Montpellier
The cathedral of Montpellier
Narcissus poetics
The cathedral of Montpellier
The botanical garden of Montpellier
The botanical garden of Montpellier
The botanical garden of Montpellier
Brackish Camargue vegetation
Brackish Camargue vegetation
Brackish Camargue vegetation
A typical lagune
Brackish Camargue vegetation
Camargue horses
Camargue horses
Camargue horses
Brackish Camargue vegetation
Brackish Camargue vegetation
Brackish Camargue vegetation
Camargue horses
Brackish Camargue vegetation
Little egret in the evening sun
Flamingo’s in the evening sun
A typical lagune
Dandelion fuzz
Grass lily
Grass lily
Dandelion fuzz
Veronica in a sea of poplar fluff
Euphorbia in a sea of poplar fluff
Poplar
Gare du Midi, Brussels
Gare du Midi, Brussels
Gare du Midi, Brussels
Gare du Midi, Brussels
Sweden autumn 2016
Autumn in Abisko
Yellow leaves of mountain birch, with lake Torneträsk in the background.
Lapporten, the gate to Lapland, in Abisko
Rain blowing over the Abisko National Park
The colours of the north: red fireweed and yellow mountain birches, with lake Torneträsk on the background
Yellow leaves of mountain birch, with lake Torneträsk in the background.
Rain on the background, the ski lift in Abisko on the foreground
The steep slope of mount Nuolja on a dramatic looking morning
The beautiful colors of lake Torneträsk in Abisko
A little stream on top of the mountain, with a view on Lapporten, the gate to Lapland
Well, that is a beautiful table with a nice view on lake Torneträsk in Abisko
Our little experiment on top of the mountain in Abisko, with a view on Lapporten
Autumn in Abisko is extremely colorfull
The ski lift with a view on Abisko National Park and Lapporten
Hiking dowhill towards lake Torneträsk
This green is greener than the greenest green: moss on top of mount Nuolja
Well, that is a beautiful table with a nice view on lake Torneträsk in Abisko
The ski lift with a view on Abisko National Park and Lapporten
The ski lift with a view on Abisko National Park and Lapporten
The most beautiful hiking trail of the world: Nuolja in Abisko
Angelica archangelica, often the biggest plant of the Arctic
The most beautiful hiking trail of the world: Nuolja in Abisko
Cirsium helenioides, the melancholy thistle
Hiking down mount Nuolja
The steep slope of mount Nuolja on a dramatic looking morning
The colours of the north: red fireweed and yellow mountain birches, with lake Torneträsk on the background
The prettiest yellow and blue: autumn in Abisko
Fireweed, Epilobium angustifolium
Campanula or bellflower, I think ‘uniflora’
Vaccinium myrtillus
Cornus suecica, the prettiest red of the world
Hieracium alpinum, alpine hawkweed
Carex atrata, one of my favourite sedges
Alpine clubmoss, Diphasiastrum alpinum
Agrostis capillaris, bentgrass
Common yarrow (Achillea millefolium)
Anthoxanthum odoratum, sweet vernal grass, fully grown and mature
Snow scooter trail
Our plot in the mids of a field of horsetails (Equisetum pratense)
Equisetum pratense
Cliff overlooking the valley with the road to Norway
Seedling of Taraxacum officinale, the dandelion, after two years of growing in bad conditions
Poa alpina, the alpine meadow-grass, with its viviparous seeds
Massive flowerhead of Angelica archangelica
Angelica archangelica
Blueberry (Vaccinium myrtillus) in autumn
A lowland marsh in Abisko in autumn
Installing the plots of our trail observations on top of mount Nuolja
Installing the plots of our trail observations on top of mount Nuolja
Tanacetum vulgare (Tansy), non-native for the high north
Autumn forest down in the valley
The valley of Nuolja to Björkliden
Summer on the Nuolja-side
A full rainbow behind mount Nuolja in Abisko
It’s raining in the west, clouds trapped behind the mountains
A strong wind blowing rain from behind the mountains to our side
A strong wind blowing rain from behind the mountains to our side
Betula nana, the dwarf birch, mini autumn forest
Betula nana, the dwarf birch, mini autumn forest
The valley of Björkliden in autumn
The valley of Björkliden in autumn
The valley of Björkliden in autumn
The valley of Björkliden in autumn
Sweden spring 2016
Trifolium pratense
A rainy hike
Rubus arcticus
Silene acaulis
Oxyria digyna
Bartsia alpina
Eriophorum vaginatum
Silene suecica
Overlooking the valley of Laktajakka
Cornus suecica
Ranunculus glacialis
Although the alpine zone has been harder for invasives to access than most places, human structures like trails are often an easy gateway for the invaders to get up there. Picture from Abisko, Swedish Lapland.
Western European species like the red clover (Trifolium pratense) here are often listed as non-native species in mountain regions.
The valley of the lakes
Trifolium repens
Ranunculus glacialis
Dryas octopetala
Melting snowpatch on a lake
Salix reticulata
Amiens
Nice architectural curve
Sun rising above the water
House on the square before the cathedral
Gargoyle planning to eat the cathedral
Le Club d’Aviron in winter weather
The southern side
Almost cold enough for ice-skating
Enjoying silence and the morning sun
Cathedral at night
The museum behind the beautiful gates
Maria without a shirt
Frozen to the bone
Cathedral at night
Cathedral at night
View from my office window
Colourful mirror
Sunny but cold, the Quai Bélu
Cathedral at night
Just outside of Amiens
Cathedral with a glimpse of spring
Frozen mirror
Cathedral seen from the frozen Parc Saint-Pierre
Sunny but cold, the Quai Bélu
Cold!
Winter sun on the Place du Don
Amiens is filled with cute little houses
View from my office window
Sweden autumn 2015
Lichen
Sweden summer 2015
View on the 1000 meter plots
Doing research on a cold Arctic morning
Plots flooded by the snowmelt
Flooded by the snowmelt
Meltwater river, racing down the mountain
After a hike, even the most basic house looks cosy. Little hut in the mountains, open for everybody
Snowbridge, maybe don’t cross…
Snowbridge
View from a cliff
Silene acaulis or cushion pink, cutest plant of the Arctic
Two seasons in one image
Steep slope
Hiking down
Narvik Kirche, church of the subarctic
Narvik Kirche
Reindeer on top of the mountain
Narvik Kirche
Summer at the church
Summer flowers
Massive waterfall
Young willow catkins
View from Narvik’s hospital, with lilac flowers
Building a bridge over the fjord will gain al drivers at least an hour
Norwegian fjord
Posing with the water, getting soaked
Minimalistic mountains
Insect investigating our reindeer antler
Catching mosquitoes with our license plate, harvest of the year!
Posing with the plot
Fieldwork on the most beautiful spot of the world
Fieldwork on the most beautiful spot of the world
Summer bridge – still next to the sadly impassable river
Rhinanthus flower in the mountains
Plateau in the valley, beautiful brown
Experimental view from my favourite plot
Salix catkins
Extremely old Betula tree
Waterfall from a cliff
Buttercup is the earliest in spring, here
Rocks!
Alpine views
Views!
Fieldwork
Jumping over rivers
Plot
Golden plover
Angry lemming
Green, the whole north is green!
Snow, so much snow left!
Minimalistic mountain moments
Fieldwork
The research center
Red clover – focal invader
Look at this tiny cute snail!
Massive floods of melting water
Bartsia alpina
Hooray, a toilet!
Dryas octopetala
Lowest elevation plots
Butterball!
That’s a lot of water
Midnight sun is the best
At the lakeside
Beautiful Bistorta vivipara
Don’t fall in the water
Midnight sun
Wild river
Art – made by ages of wild rivers
Baby firework for America’s independence day
Midnight sun at the lake
The Abisko canyon was wilder than ever
That’s a crazy amount of water!
The Abisko canyon was wilder than ever
The Abisko canyon was wilder than ever
Black and white
Stone-man overlooking Abisko
Nothing as soft as a willow catkin
Label and soil temperature sensor attached
I’d drive to the top every day
Reflections
Rocks and clouds
Brave little birch
Brewing our camping poison
Basic camping stuff
Camping in Norway
Home-made temperature houses
Roadside research at its best
Norway is crazy
Horsetail is so funny
Little creek in magical forest
Birches, birches everywhere
Beautiful rock, a gift from the river
Another roadside fellow
Lichen
Ready to rock the summer
Collecting mosses
That’s a crazy old lichen
Tiny tiny piny trees, but old, so old!
Ready to jump into the fjord?
Ready to jump into the fjord?
That’s a spiky stone!
Views on Norwegian fjords
Silene in the mountains
Cute little orchid
Skua
Attacking skua, mind your heads!
Watch out for the attack of the fierce skua!
Black snail
New plot!
Still a lot of snow to melt, but this spot was free for a new plot
Reindeer are better than people
Two seasons in one picture
Let’s see what is happening to the balance in mountains! Is this a starting avalanche, or will it last a bit longer?
Cute little hut
Climbing mountains by car
Softest moss in history
Drosera in the marsh
Hiking in no-man’s land
The clouds are coming
Abisko valley
‘Butterball’
Fieldwork in the tundra
Abisko valley
Little plot
Clouds and sun and mountains
Making soup on a campfire with a view
Little creek on high elevations
Skua on the look-out
Melting snow in a river
Rhodiola rosea and the Törnetrask lake
Beginning of spring
Flooded plots, melting snow, impassible wetness
Ferns and horsetails
Chile 2015
Lunch made by our local colleague, with funny bread (tasty as well!)
Trips to the field sites were sometimes a real adventure, especially right after snowmelt