If you’ve been following my research for a while, you should know by now that microclimate warming rates can be very different from what our weather stations and climate models tell us. We’ve been discussing it for forests, mountains and backyards: the temperature that plants, insects and soil life actually experience doesn’t just differ from the regional average, it can also change at a different pace. It’s something I’ve been repeating on this blog for years, as a logical consequence of the existence of microclimate.
However, what we hadn’t told yet in much detail, is how that difference could come about. While we’ve seen a few great published examples (forest cooling, shrubification, urban expansion, …), a good overview of the mechanisms behind these different changing rates was still largely missing. And having those mechanisms sharp in our heads is quite important, as the implications of this phenomenon are quite substantial.
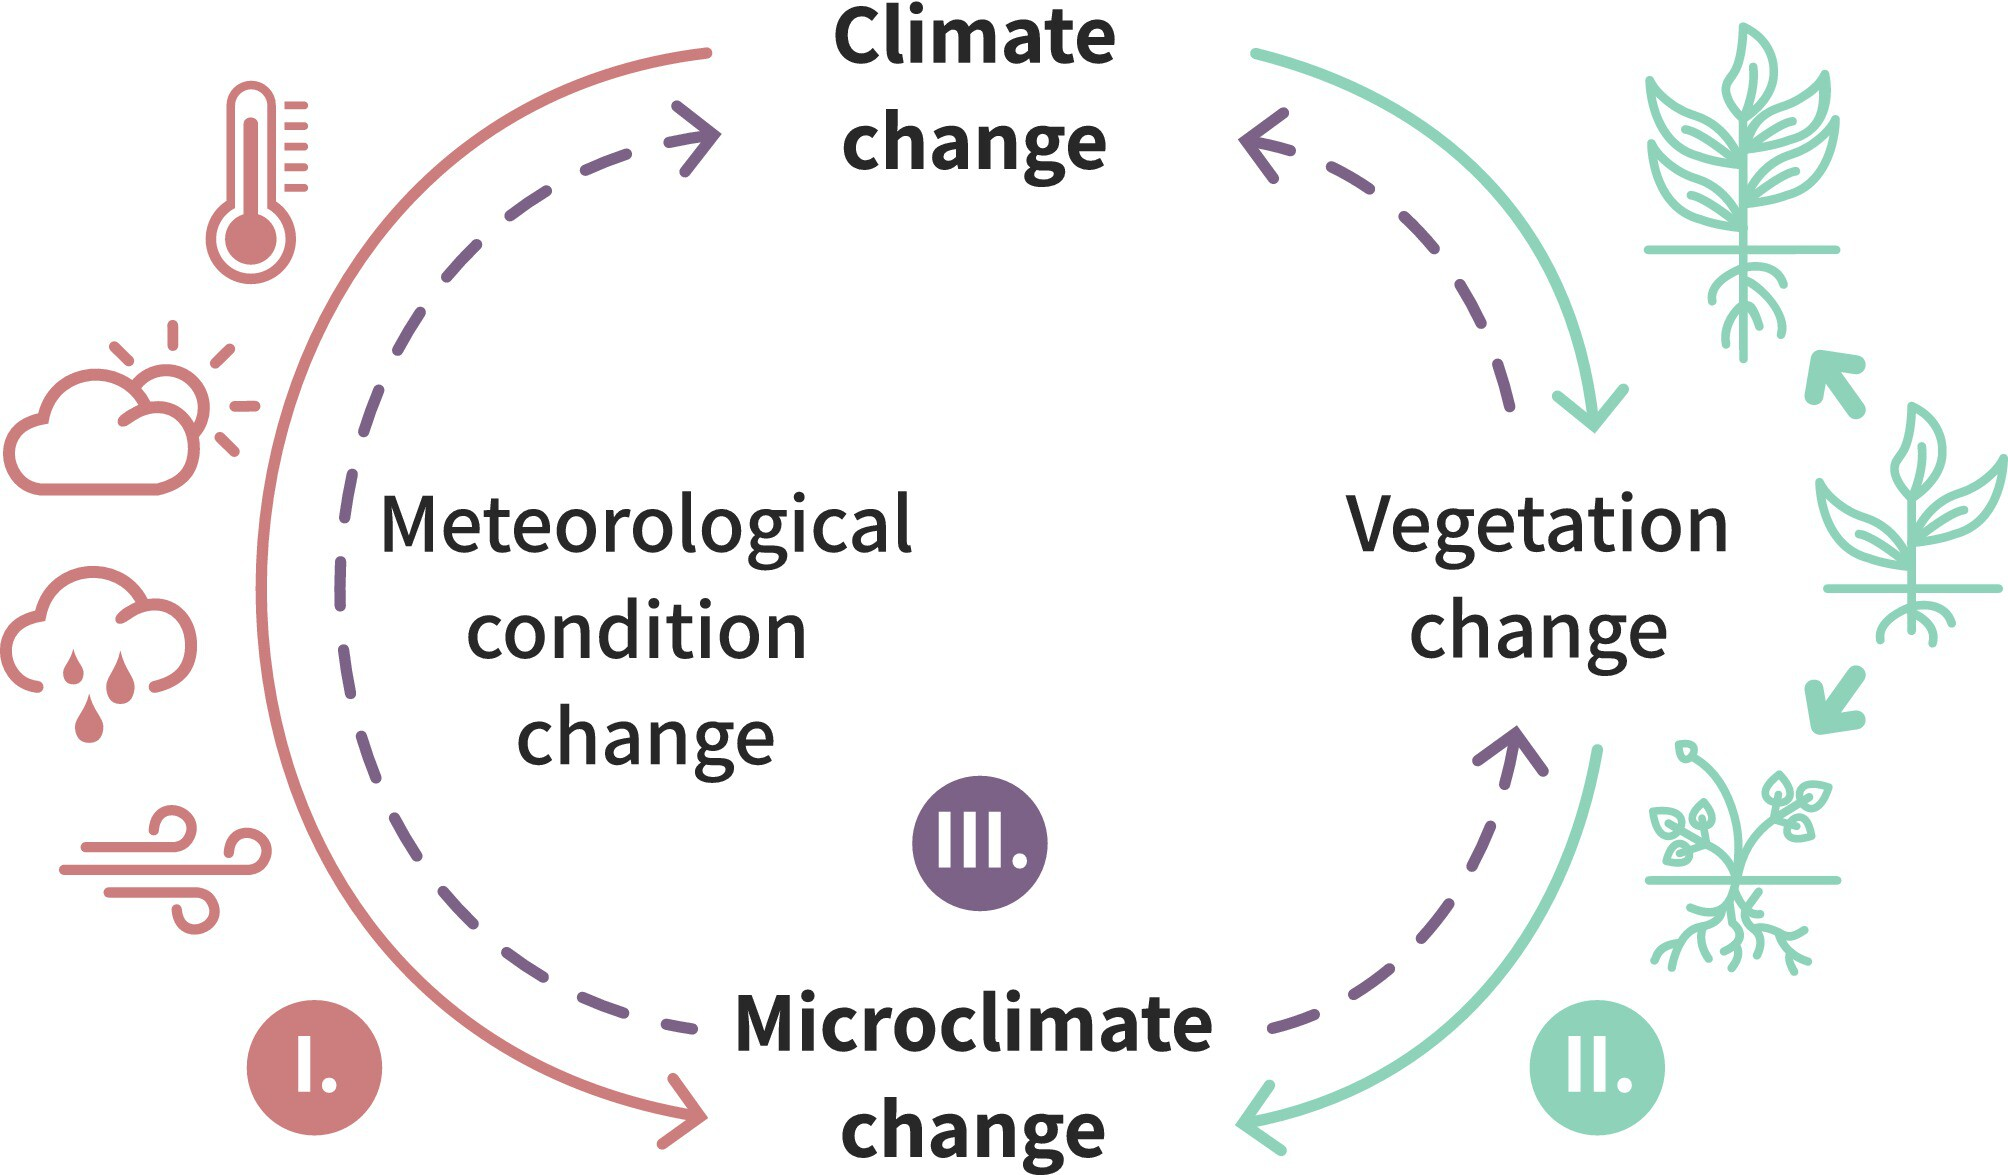
That knowledge gap has been filled now, with a new review in Global Change Biology, led by Caroline Greiser and written together with an international team spanning 12 countries (I had the pleasure of being among them). This one focuses on how it can be macroclimate change itself that drives different rates of microclimate changes as experienced by life on Earth, and how these micro-scale changes may, in turn, feed back into the regional and global climate system.
One headland, three warming rates
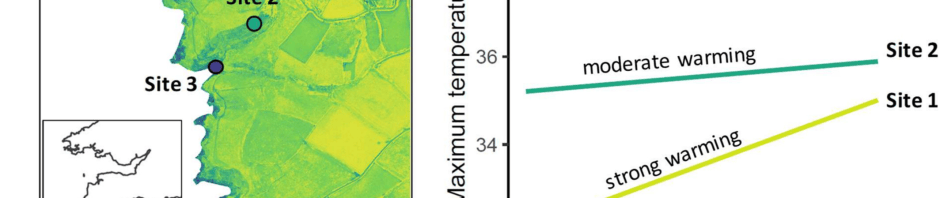
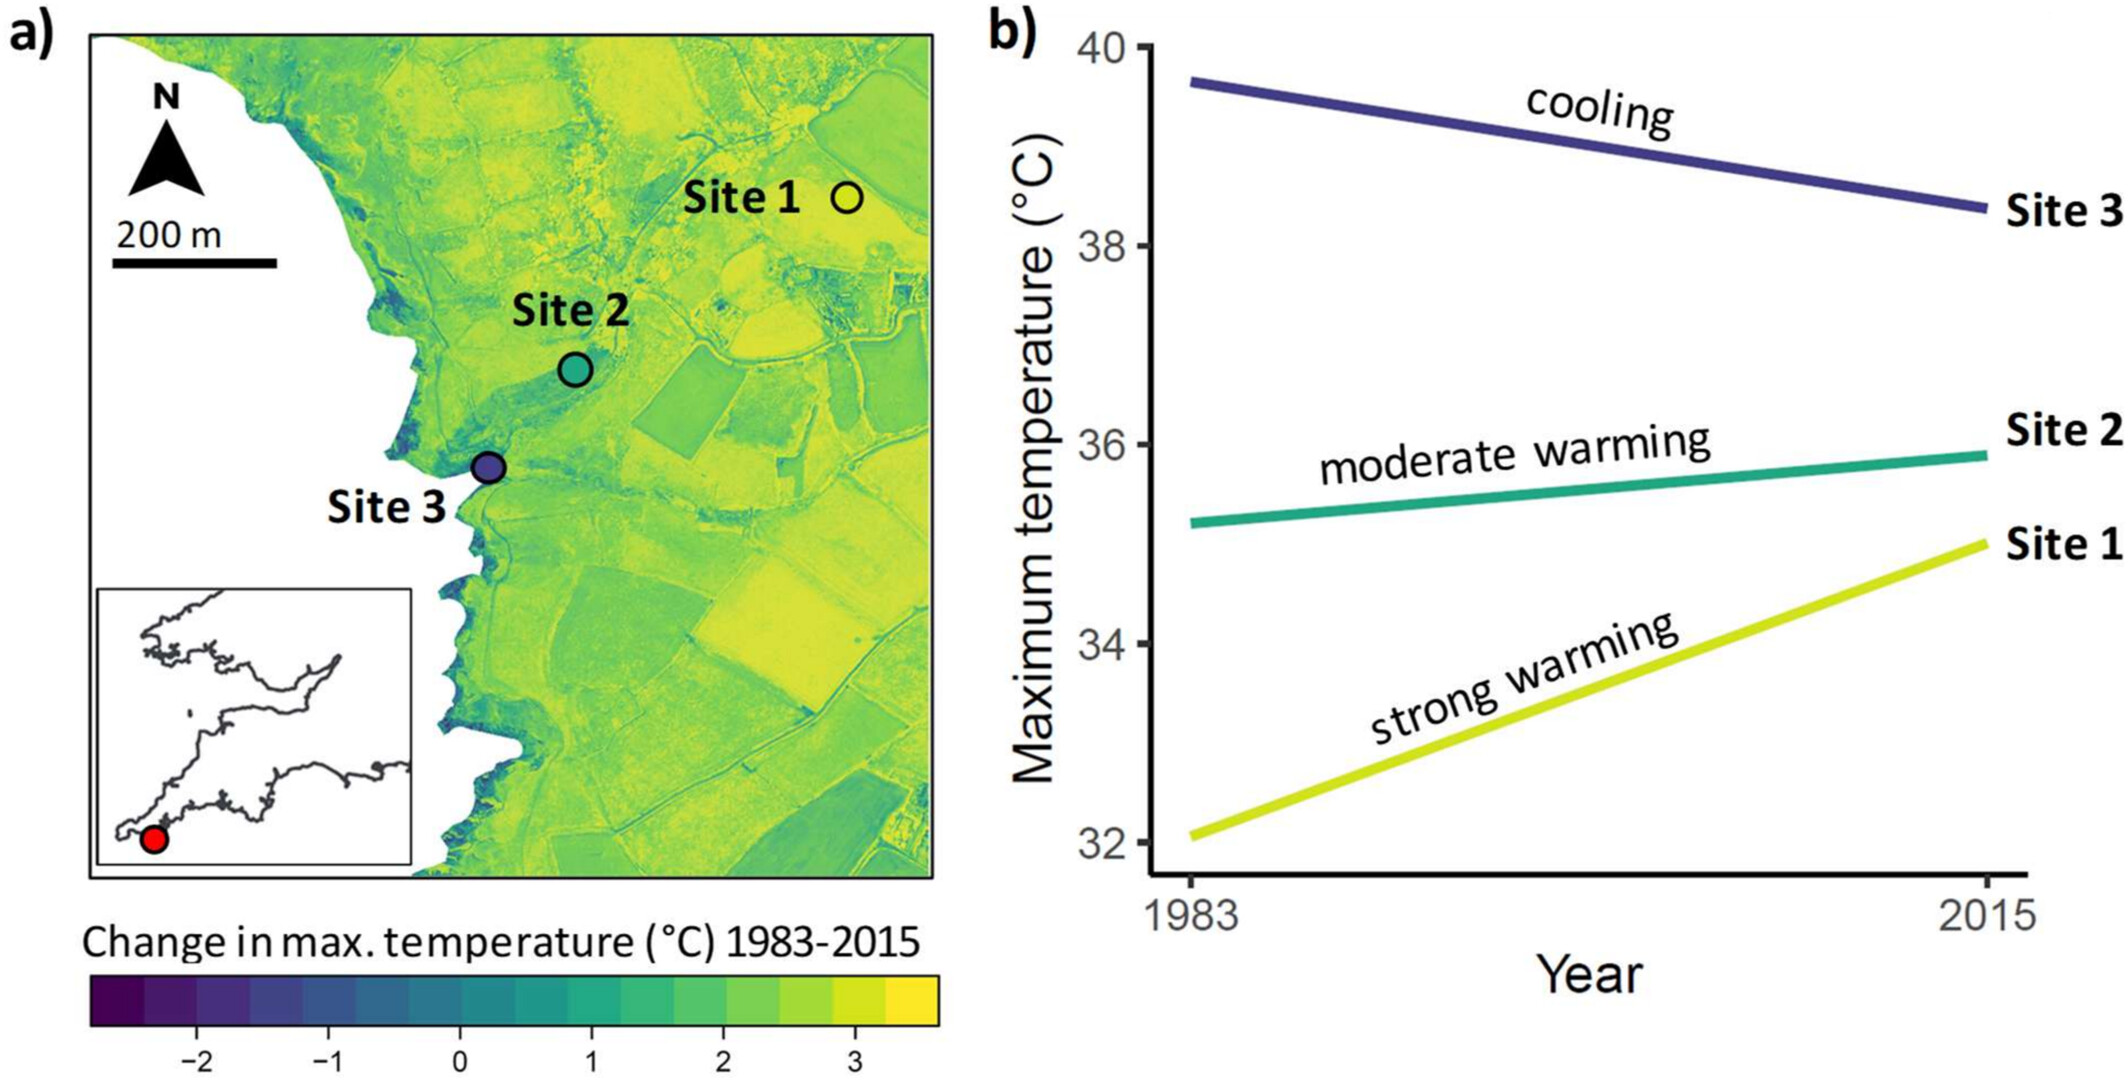
Let’s start with the example that, to me, says it all. Walk across the Lizard Peninsula in southern England (close to home for co-author Ilya Maclean and thus one of the most intensively modelled microclimates in the world, I’d say) and you pass from a spot that warmed by almost 3 °C over the last three decades to one that actually cooled by more than 1 °C. The regional average over the same period? 0.3 °C. Climate change, as it turns out, can vary quite substantially over just a few hundred metres.
It’s easy to think of climate change as a single number for a region, but the organisms we care about never experience those weather station averages. They live on one particular hillside, in one particular patch of forest. For them, the warming rate can be very different from the regional average, and that is a story we have largely been missing. The same is true for us humans, of course, which makes this a story that hits close to home.
All this implies a much wider range of warming rates than we are used to. You may have heard of Arctic amplification, the Arctic warming faster than the rest of the planet. This study suggests that such differences can play out on a much smaller scale still, from one valley to the next, depending on changes in vegetation and atmospheric conditions.
So how is that possible?
The technical answer is that microclimate is the outcome of an energy balance at the land surface: sunlight comes in and is divided between heating the ground and the air, evaporating water, and being stored in soil and plants. Change anything in that balance, and places respond differently depending on their slope, vegetation, soil and exposure. Thanks to new data (including from remote sensing) and models, we are now able to decipher what that means for future microclimate trends.
Clouds play a surprisingly big role here, and are my personal favourite. Daytime cloud cover has been declining in many regions, in Europe by roughly 1.5 to 2% over two decades. That extra sunshine doesn’t land equally everywhere: sun-exposed slopes and open meadows catch it, while shaded slopes and forest interiors barely notice. As cloud cover decreases, the contrasts in a landscape are thus accentuated. Your south-facing hill will suddenly be much warmer, much more often in the year, and so warms at a substantially faster rate than the north-facing hill next to it.
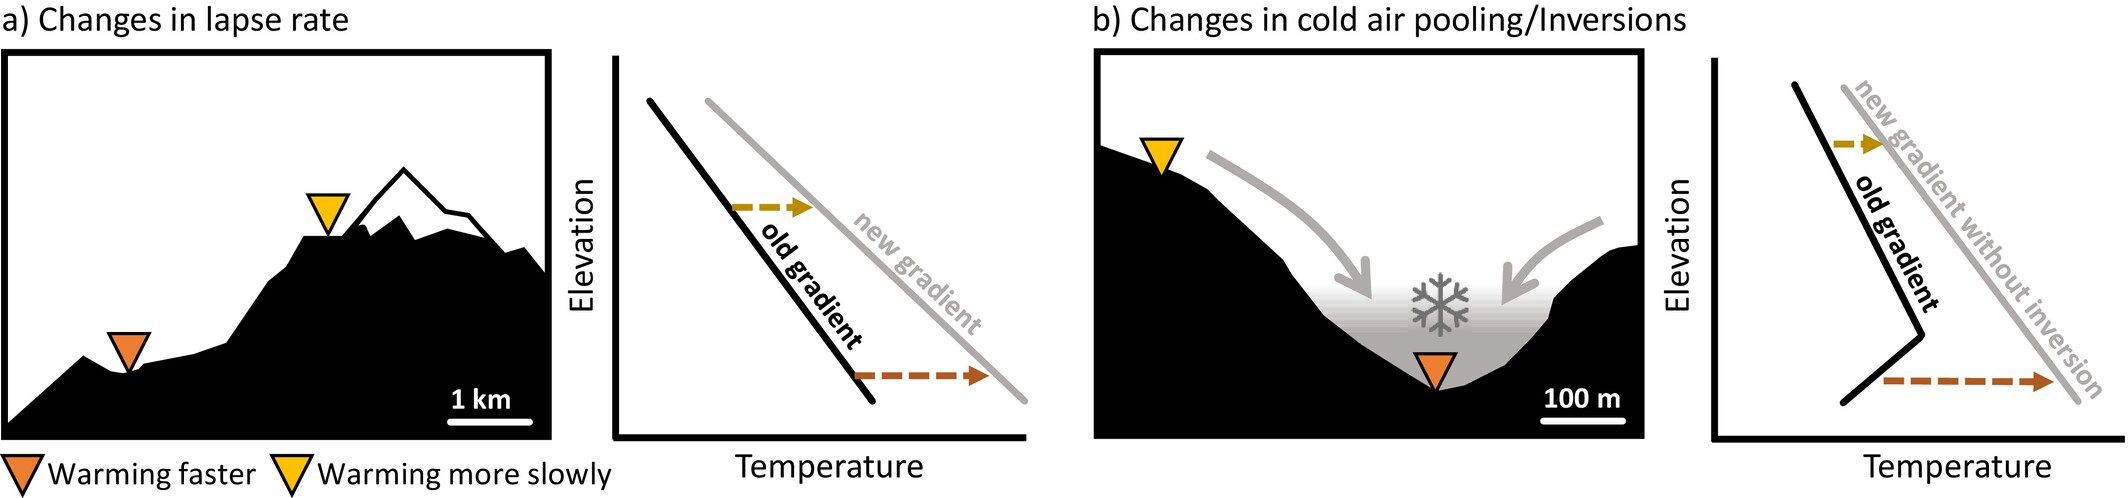
Snow does something similar in colder regions. It insulates the ground from cold air and caps surface temperatures at 0 °C for as long as it lies there. In the simulations of a mountain landscape in the Pyrenees, snow cover shifted minimum temperatures by about 3 °C, almost an order of magnitude more than wind or air humidity. Less snow therefore changes local conditions all year round, and not equally everywhere. Soil moisture works in a comparable way: wet soils spend their energy on evaporation, dry soils on heating the air, so where soils dry out, temperature extremes can climb faster than the nearest weather station suggests.
Plants, finally, play a role as well. If they stop transpiring water to survive more frequent and intense drought spells, their cooling effect will be much reduced. Entire plant communities are also shifting due to climate change. In a simulation of a steppe taken over by shrubs and trees in Turkey, the hottest days cooled by up to 16 °C under dense cover, while open patches nearby became several degrees hotter. A small note of caution here: these simulations isolate single drivers to show the mechanisms, so read them as illustrations of how landscapes respond rather than as forecasts.
If there is one thing that really stands out from all of this, it is that there is no single culprit. Clouds, snow, soil moisture and vegetation each shift the energy balance a little differently from one spot to the next, and together they can pull neighbouring places apart quite substantially. For farmers, beetles and everything in between, those differences have real implications.
What this means for the future
Indeed, if the pace of warming differs so much over such short distances, so will its impacts on biodiversity and ecosystem processes. Some places may already be facing substantial changes in local climate conditions, while others haven’t even noticed that change is on its way. Solutions will therefore need to be much more tailor-made: the farmer on one side of a hill and the farmer on the other may well need completely different strategies against the changing climate.
That also makes climate adaptation a joint effort of climate science and ecology, two fields that have long worked in parallel but not always together. To work out which strategy fits where, we need ecologists and atmospheric scientists in the same room, speaking the same language. Much of the physics we need has been known for decades. What is needed now is the interdisciplinary collaboration to apply it.
And since this paper for now leaves out what we humans do to the landscape, through farming, forestry and urban design, there is a natural next question: how much do we ourselves shape these local warming rates? More on that soon!
Reference: Greiser, C., et al., Lembrechts, J.J., et al. (2026). Climate change experienced by life on Earth – drivers and mechanisms of future trends in microclimates. Global Change Biology. https://onlinelibrary.wiley.com/doi/10.1111/gcb.71140