Tropical forest understory temperatures

New paper in Nature Communications: Ismaeel et al. (2024) Patterns of tropical forest understory temperatures.

It’s a thing we do at SoilTemp: create microclimate maps over large extents for all to use. We have done this before for soil temperature at the global scale (with 1 km resolution), and have done so for European forest understory temperatures at a breathtaking 25-m resolution.

And now we do that again! This time, for an area that has long been undersampled, but that is extremely important for global biodiversity and ecosystem functioning: tropical forests. As is the case for European forests, we can expect substantial temperature buffering under tropical forest canopies. How much, that has always been hard to say.

A microclimate sensor in the tropical rainforest of Congo, one of the many that allowed mapping forest understory microclimate across the pantropics. Pic: Matti Barthel

Not anymore, as we are proud to introduce a new paper in Nature Communications: patterns of tropical forest understory temperatures. The big thing: we created maps of tropical forest understory temperatures at a resolution of just a few tens of meters for all tropical forests, in South America, Africa, and Oceania!

As expected, forest understories were on average cooler (1.58°C, to be precise) than macroclimatic temperatures, and they were also buffered more (1.72°C lower diurnal – day/night – variation) than macroclimate.

We found significant spatiotemporal variation in daily temperature offsets in tropical forest understories in South America (left), Africa (middle) and Oceania (right).

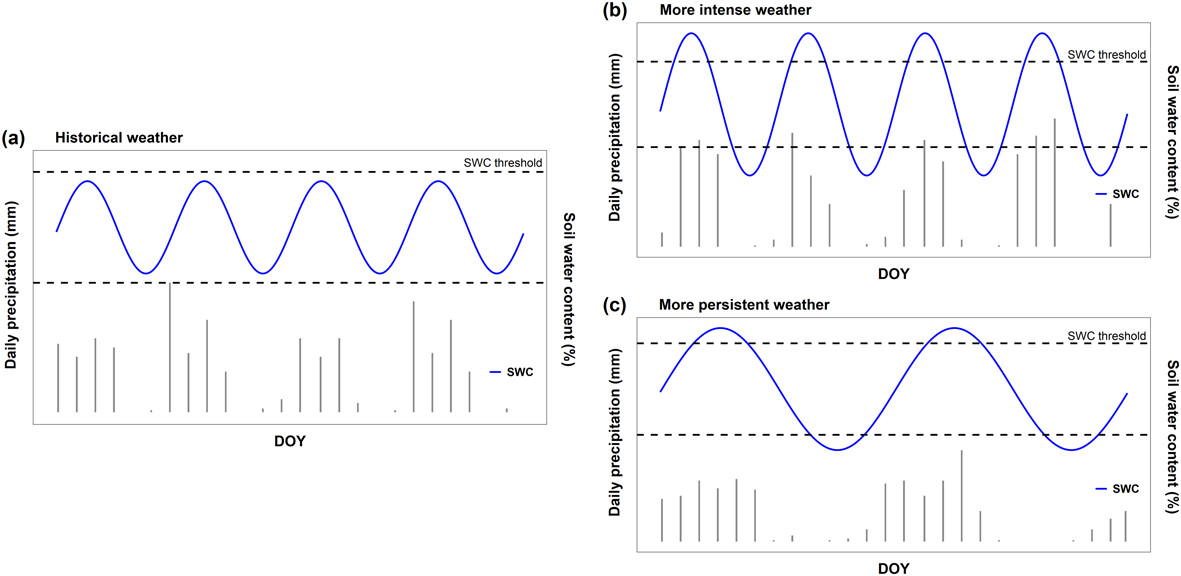
Importantly, however, these averages hide significant spatiotemporal variation in that buffering, driven by patterns in macroclimate, vegetation structure, and topography. This variation holds some important information for understanding of these important ecosystems. For example, temperature buffering is stronger in regions with a distinct dry season. Although reduced rainfall is usually associated with higher temperatures, deep-rooting tropical species can for a long time still access water reserves and keep up their ‘airconditioning’ function, effectively creating a larger difference between understory and free-air temperatures.

The former works as long as these droughts remain within reasonable limits, of course, as climate change might very well push these forests over a threshold, making them lose their airconditioning function and rapidly increasing understory microclimatic temperatures. But that’s a story for another day.

An interesting observation for me is the fact that offsets across these tropical forests are usually not so large. On a daily basis, forest understory temperatures were often less than 1°C cooler than macroclimatic temperatures outside the forests. This was especially true in Indonesia, for example, but large swaths of South American and African rainforests are showing surprisingly small offset values as well.

This phenomenon can be attributed partially to the contrast between daily maximums (which tend to be cooler in forests) and minimums (warmer within forests). However, there might be other contributing factors at play. The high humidity prevalent in tropical regions is likely another significant influencer, dampening the intensity of microclimatic differences.

Nevertheless, despite these seemingly small variations, the consistent stability of temperatures throughout the year results in a cumulative effect. Over time, these incremental differences in temperature do add up, significantly impacting the overall energy input within the ecosystem.

The marked disparities and the crucial spatial diversity present across the pantropical regions underscore the significance of the maps we’ve crafted. These visual representations hold immense importance for anyone delving into the intricate workings of tropical forest understories, spanning from deciphering species distributions to comprehending litter decomposition dynamics. The relevance of such high-resolution microclimate products has already been elegantly demonstrated in understanding the distribution patterns of European forest understory plants. It’s only a matter of time before their paramount significance in tropical ecosystems is similarly illuminated.

The maps are freely available here! For now, at a 300 m-resolution, while we figure out a good way to share the 30-m resolution files open access. The latter are currently available upon request.

Posted in General | Tagged , , , , , , , | Leave a comment

Following plants in the crags: MIREN rock face survey

Join the new MIREN rock face survey

With long-term monitoring campaigns focussing on mountain roads and trails, and divergences to railroads and rivers, we are happy to announce that MIREN wants to tackle another – perhaps more unusual – linear disturbance in a new, global survey: rock climbing!

Rock climbing is in many respects similar to mountain roads and trails, with routes serving as linear disturbances and dispersal corridors across elevation gradients, with significant effects on the local vegetation. Nevertheless, cliff vegetation, and the influence of rock climbing on it, is pretty unique: rock faces often cover strong microclimatic gradients, resulting in a unique vegetation of species at either the warm or cool edge of their distribution. 
This unique vegetation often consists of (locally) rare species with very patchy distribution, and the passage of climbing routes over their habitat might thus have substantial impact. To map that impact, and its interaction with the effects of microclimate and climate change on species redistributions, we launch this new MIREN rock face survey, and you are welcome to join!

Wilder Kaiser, Austria – by Sarane Coen

Through the MIREN rock face survey we want to learn about global similarities and interregional differences between rock faces. To do this, we will set up permanent vegetation monitoring plots on and adjacent to existing rock climbing routes to monitor local plant species richness and community composition. Wherever possible, we will also measure rock face microclimate in comparison with the microclimate in the environment.

If you are interested in monitoring the vegetation on and along one or a few rock climbing routes in the upcoming summer, express your interest via this form. We are currently developing a standardized protocol that can be applied with minimal effort on any rock climbing route across the globe. If you want to be involved in finalizing that methodology, you can inform us through the same form!

Posted in General | Leave a comment

Take it to the higher order

New paper: Reynaert et al. (2023) Direct and higher-order interactions in plant communities under increasing weather persistence. Oikos

Let’s knock down an open door: interactions between species are key determinants of their performance. How well an individual is growing, or even if it is growing somewhere at all, hinges significantly on the surrounding organisms. They may vie for vital resources like air or sunlight, or conversely, aid one another by providing shade against the scorching rays of summer.

It should therefore not come as a surprise that there are thousands of papers on biotic interactions and their role in ecosystem functioning. However, while we have learned a lot about this over the last decades, there is still a surprisingly big hole in that literature. And that gaping hole is the result of inevitable oversimplification. That is, we have way too often – for the sake of simply being able to grasp ecology’s complexity – limited ourselves to direct interactions: A outcompetes B, C facilitates D. Yet, natural interactions seldom adhere to such straightforward narratives. Within an ecosystem, every individual is engaged—albeit to varying degrees—in an intricate dance of relationships, influencing and being influenced in turn.

Conceptual framework of higher order interactions (HOI)

Consider, for example, a scenario where a plant species, Plant A, attracts a specific herbivorous insect. Ordinarily, these herbivores might feed on Plant A, reducing its fitness. However, another plant species, Plant B, grows nearby and emits a molecule that attracts predators of the insects. As such, Plant B is indirectly helped by Plant A, as Insect B comes to eat Insect A. Or any other orientation of interactions.

These intricate and multifaceted relationships are labeled higher-order interactions (HOIs), a domain that has consumed a considerable amount of my time to get a hold of them in a convincing, statistically sound way. In a first attempt, we used real-world data from our mountain vegetation monitoring initiative (MIREN, http://www.mountaininvasions.org). However, that turned out very tricky, as there were simply way too many things changing at the same time to isolate something as complex as these higher-order interactions. After many an attempt, that idea was moved to the ‘death paper pile’.

In a new attempt, however, expertly led by UAntwerp-colleague Simon Reynaert and now published in Oikos, we took a different turn. We made use of a fascinating controlled experiment performed at our university campus, where precipitation was manipulated for 256 so-called mesocosms (in essence: pots with plants). What made this experiment especially useful was the uniform conditions experienced by all plants and pots, with precipitation being the sole variable—specifically, not even the AMOUNT, but the timing of rainfall.


An explanatory framework illustrating how changes in rainfall patterns, specifically increased variability, can impact the moisture levels in the soil. The grey bars represent daily rainfall amounts. Across all panels, the total precipitation matches historical weather averages (a).
When weather becomes more intense (b), it leads to less frequent but heavier rainfall episodes interspersed with extended periods of dryness, particularly during higher temperatures. This scenario could worsen the effects of droughts or floods.
On the other hand, when weather patterns become more persistent (c), it results in prolonged stretches of both dryness and wetness. This persistence might intensify the fluctuations in soil moisture content, potentially causing more extreme variations.
In both scenarios, there’s an increased likelihood of surpassing critical soil moisture levels. This excess—either too much or too little moisture—can detrimentally impact how ecosystems function.

By holding all these conditions constant, except for the precipitation regime, we could finally test how extreme events affect HOIs. And yes, lo and behold, our results indicate that species interactions (including HOIs) are an important determinant of plant performance under this increasing weather persistence. Moreover, the importance of these interactions changed substantially along the gradient of weather persistence, with  HOIs showing a shift towards stronger facilitation (or weaker competition) as drought persistence increased.

What was thus interesting, was that HOIs – at least partially – counteracted the effects of direct competition by neighbours, a conclusion that has been made in other studies as well. This could mean good news for biodiversity, as complex interactions could as such help support a higher diversity. However, a cautionary note is necessary: this counteractive effect was truly only partial, and could not overcome the increased drought intensity experienced in the most extreme precipitation regimes. In the end, species succumbed on their own to the extreme drought, and no positive higher-order interaction effect could prevent that from happening.

The complex interactions between individuals in such a meadow might help a bit in reducing the impact of extreme drought events.

There was a lot more to the results, of course, with perhaps the main conclusion that, indeed, HOIs are bloody complicated to analyze statistically. Even in this extremely controlled setting, picking up on these trends remained difficult. Thus, while ample papers have shown the theoretical importance of HOIs, we are still a long way from routineously integrating these complexities in our ecological analyses.

Posted in Belgium | Tagged , , , , , , , | Leave a comment

Blockchains and biodiversity

tl;dr: we will be looking for a database manager who wants to join our SoilTemp team, based in Antwerp, Belgium, with the main goal to make the database more accessible and more flexible. Knowledge of R required, of SQL a plus.

Blockchains and biodiversity? While these words are not too far away from each other in the dictionary, it is not that common to see them brought together in one sentence. Yet that is exactly what we aim to do in a new project that just got funded by Europe’s BiodivERsA+-funding scheme.

The project is called ForestWeb 3.0, and its goal is to help biodiversity with the power of the next generation of internet – Web 3.0, with its fancy developments like blockchain, and others.

An old birch tree in the Abisko area. Forest biodiversity like this requires long-term monitoring to observe subtle trends, but also real-time follow-up to catch sudden changes. In this project, we want to improve data availability for both.

So, how is that supposed to work? Well, biodiversity monitoring is all about data availability, and when we are talking about global monitoring, that is a LOT of data. This data is owned by LOTS of people, who spend blood, sweat, tears and a lot of chocolate and trail mix on collecting that data out in the real world. If we want to track the impacts of global change on biodiversity, we need all those monitoring initiatives – and especially the long-term ones – available in one place.

This is something we have been doing for a while in SoilTemp, especially for the vital microclimate data underlying any complete biodiversity monitoring initiative. However, there are three things to note about that:

  1. There is still a lot more data out there than we have currently brought together (especially given that data from the latest call is still frantically being processed).
  2. This data is not yet as available as one might hope. It still needs to be made open access, and the framework to access it should be made as user-friendly as possible.
  3. Not everyone is that keen to send their precious data to this unknown guy in Belgium, and understandably so. What if we can ensure people can store their data locally, and it’s only the LINK to that data that gets sent to the central database?

Points one and two are things we were planning to do anyway. Point three is where the blockchain and Web 3.0 come in, with these new technologies specifically designed to increase trust, transparency and control of the data, something we are all aspiring to.

ForestWeb 3.0 also wants to go further than that. Biodiversity is economically valuable, and increasingly so. Conserving that biodiversity is as well, and should be even more. What if we could increase that economical value for biodiverse land owners, to enhance the incentives to conserve nature? Doing so, however, requires good (and fast) monitoring of biodiversity and ecosystem services.

In part two of ForestWeb 3.0, we’ll explore how this can be done. First, we’ll work on digital twins of nature, tracking biodiversity and ecosystem functions (e.g., microclimate buffering) in quasi-real time to ensure we can put better numbers to the value of biodiversity. Second, we’ll work on systems to monetize that biodiversity, and give (financial) credit to the actual people putting in the actual effort to conserve and restore nature.

Our team at the University of Antwerp is in charge of that first part: bringing together as much biodiversity and microclimate data as possible (through SoilTemp), make it accessible (both open access ánd easy to use), and make that database able to talk to remote datasets (over blockchain) and to real-time sensor networks.

Think that sound cool? Well, then we’ll soon have an opportunity for you! We will be looking for a postdoc (or predoc) to join our team and work on making SoilTemp bigger and better! A position based in Antwerp, initially for 1,5 years, for a person who loves data and databases, and is proficient in R and at least eager to learn about SQL and Web 3.0. Contribution to – and potentially leading of – global SoilTemp-papers can become part of the deal. Interested, feel free to reach out already by email (lembrechtsjonas [.ad.] gmail.com)

Posted in Norway, Sweden | Tagged , , , , , , , | Leave a comment

The dark secrets of dark diversity

Dark diversity. A term that sounds sufficiently dramatic to catch the attention of many an ecologist. But it’s a good theory as well to explore: instead of the common ‘diversity’, which looks at the diversity of species/genes/traits present at a certain location or in a certain region, dark diversity focuses on those species that are NOT there. Even more importantly, it focuses on those species that are not there, but SHOULD have BEEN there. The hidden masses, the forgotten ones, those that have been lost.

The field of dark diversity tries to explain why certain species are not where they should be, in the hopes that this can give us a better understanding of community dynamics, and risks for biodiversity loss.

Intrigued? We were too, so we decided to estimate the dark diversity of our study region in northern Scandinavia, in the area surrounding the Abisko Research Station, as part of DarkDivNet, the dark diversity network. That work – led by master’s student Lore Hostens – now got published (here)!

Which plant species are missing here and why? We put the concept of dark diversity to the test in our favourite research arena in the north of the Scandes mountains

We got to work by monitoring the species that were present, and then scanned the literature for different methods to estimate dark diversity based on those. That’s when things starting to go dark (pun intended). Indeed, there were important decisions to take: which method to choose? There were a whole bunch available, many of them with several additions, adjustments, or nuances around them.

Would it matter which method we chose? Now, YES, it would! Soon enough, this question grew into our main research question: how much did the outcome differ between the different dark diversity estimation methods? Would conclusions still hold when switching from method A to B? Brace yourselves, as we are entering the muddy terrain of incomparable indices.

Schematic overview of three of the main approaches used to estimate dark diversity from the habitat-specific species pool (SP; the sum of species that are present with those that should have been present). (a) Theoretical concept of dark diversity, where the dark diversity is the non-observed set of species in a certain location, after filtering the regional species pool based on abiotic, dispersal and biotic interaction limitations. (b) Dark diversity is calculated using climatic filtering of the regional species pool (e.g., using climatic niche models to estimate which species could occur at a certain location). (c) Commonly used co-occurrence-based methods, which integrate both abiotic and interaction filters, yet don’t always include the dispersal filter, as assessments of dark diversity of a species in a plot are independent of distance to its source population.

Basically, there are (at least) three main methods to estimate dark diversity, depending on what filters one incorporates to estimate which species should and should not be present at a site. These are summarized in the figure above. Theoretically, one would exclude all species that 1) cannot occur there due to a mismatch in their environmental niche (too cold, too warm, too acid…), 2) cannot occur there because they can’t reach the place (too far away), and 3) those that are outcompeted by other species at the site (too weak, or incompatible). Unfortunately, every method has a different way of dealing with those filters.

So, many of these dark diversity estimates are theoretically substantially different. What is more, even when choosing a certain path, there are still a myriad of decisions one has to take that could affect the outcome. It should thus come as no surprise that in our case study, conclusions were entirely overturned by switching from one method to the other.

Variation in dark diversity as explained by different habitat-specific parameters, and analyzed with four different dark-diversity estimation methods. If one squints, one could assume that elevation was on average the dominant driver, but the main take-home message is clearly that every method gives an entirely different result.

The why and how of these differences are explained in detail in the paper, which you can find here.

In this story, I just want to ensure that you take one lesson home from this, and that’s the following: the concept of dark diversity is very intriguing, and intuitively makes a lot of sense, but be extremely wary of the methodological decisions that underlie it. If you use just one method to estimate your dark diversity, you might be building your conclusions entirely on loose sand. What’s more, I wouldn’t be surprised if these cautionary words could not be expanded to many other concepts in ecology that are supported by mathematical indices. Your index only tells you exactly what it measures, nothing more and nothing less, and the decisions you make along the way can have fundamental effects on your outcomes. So please, stay wary of the mathematics underneath your ecology, as they are more important than you might wish!

Note: we are no statisticians. We are humble ecologists enthusiastically coming into a problem and ending up in the mud, and just want to warn others not to get stuck!

Posted in Science, Sweden | Tagged , , , , , , , | Leave a comment

How to get the word out?

Twitter/X, Mastodon or LinkedIn, what works best for communicating scientific findings? I got the numbers for you!

This website is almost ten years old, and still going strong. I am far from done with its main goal, which is the communication of our – I dare say important – scientific findings to a broad audience.

Now, however, for a long time, I have been relying for a significant part on Twitter to get the word out about new stories on this website. Twitter was, at least for scientific collaborators in the broad sense of the term, the best way to reach them.

For a while now, Twitter has gotten into some unwanted turmoil, and many colleagues have jumped the sinking ship. I haven’t jumped yet – not even after its renaming to the ominous ‘X’. Perhaps selfish of me, but I did not want to get off before I found an alternative way of getting the word out. A scientific publication that nobody knows about could better not have been written.

I have kept an eye out for alternatives, and tried a few, just to see what could work. Most promising, initially, was Mastodon, a network that in the days of the ‘free fall’ of Twitter was louded as its best alternative. Unfortunately, although there was a lot of buzz around it, I didn’t really find ‘my people’ there, as reflected in my poor following (see Table below): on Twitter I reach over 2000 people, on Mastodon I have only 111.

Table summarizing the likes and impressions a series of different posts got on Twitter/X, LinkedIn and Mastodon, as well as the number of followers I have on each platform (on the right). The table focusses on a selection of different topics, all linking to a blogpost on http://www.the3dlab.org, and all posted in a similar manner (yet with slightly different messages) on each of the three platforms. The ‘best performance’ for each post has bee underlined. Note that Mastodon doesn’t show the Impressions (and per default hides the likes) to avoid exactly what I’m trying to do here…

Much later, I realized that the best alternative might actually already exist, as many of these new ‘start-up’ social media platforms just don’t find the momentum they need. An existing platform that I had long been overlooking was LinkedIn. While it is mostly seen as an online CV, it also has a community, and a good space for posting updates like this one.

I had been using LinkedIn passively for years, but decided to ramp up my activity on there. Not that much later, I already had my following to 430. Interestingly, while on Twitter/X most of that following consisted of ecologists, on LinkedIn I was connected to the whole spectrum of professional society, largely thanks to the many people I met along the way all the way back from primary school, and through our citizen science projects.

So, it is time for numbers now! For a few months, I decided to promote each and every story on http://www.the3dlab.org on all three of these websites in the same way, and collect the numbers. The output is in that table above, for a various set of posts, ranging from an introduction of myself, a story with pictures from the field, a fascinating microclimate paper, the start of our citizen science project on sound, and the call for data to our growing SoilTemp database.

The conclusion is clear: both for interactions (here I looked at Likes) and impressions, X is still overpowering the others, for almost any kind of content that I want to bring. Despite my efforts, Mastodon has remained a social desert: my posts simply don’t reach anyone who cares (note that Mastodon isn’t showing me the impressions, but even if lots of people would have seen the posts, they did not interact with them).

LinkedIn is a decent second, however. What’s interesting: for the launch of that new project, which is largely in a new scientific field for me and thus less interesting to the ‘crowd’ I have build up on Twitter, LinkedIn even worked better! In general, LinkedIn is at least not that much of a wasteland as Mastodon is.

So, what to conclude:

  1. Although everyone has been saying Twitter is dead and buried, it’s still the best place to reach a wide audience for me. Some of my most viral tweets even happened after Twitter’s informal burier (not in the table above).
  2. LinkedIn is the only option of many that actually has given me the idea that my story gets heard, and picked up by relevant people, even outside of academia. That makes it to me a more exciting platform now than Twitter/X.
  3. Getting a new social media platform off the ground is super hard, even when everyone agrees that they want to get rid of the old establishment. Mastodon is simply not worth the effort for me, and I will abandon it again.
  4. What about Facebook/Instagram/Tiktok? Facebook is too much focused on personal news for me to regularly post on my scientific findings – it bores the audience there too quickly. Instagram and Tiktok are no platforms for sharing links to this blog, they would require me to rework my communication strategy too drastically.
  5. So please, everyone, join me on LinkedIn! I think we could make it into one of the most interesting platforms for science communication, if you all join in!
Posted in General | Tagged , , | 4 Comments