
Those bioclimatic variables that we ecologists all love so much, but at a higher resolution and from right there where your study organisms are living? Wouldn’t that be a dream come true?
Time to pinch yourself, as we now released ‘ForestClim’, a dataset of all the familiar temperature-related bioclimatic variables, at a 25 x 25 m resolution. These bioclimatic variables are representative of conditions at 15 cm above the ground under all of Europe’s’ forest canopies, making them the perfect tool for anyone studying forest understory plants.
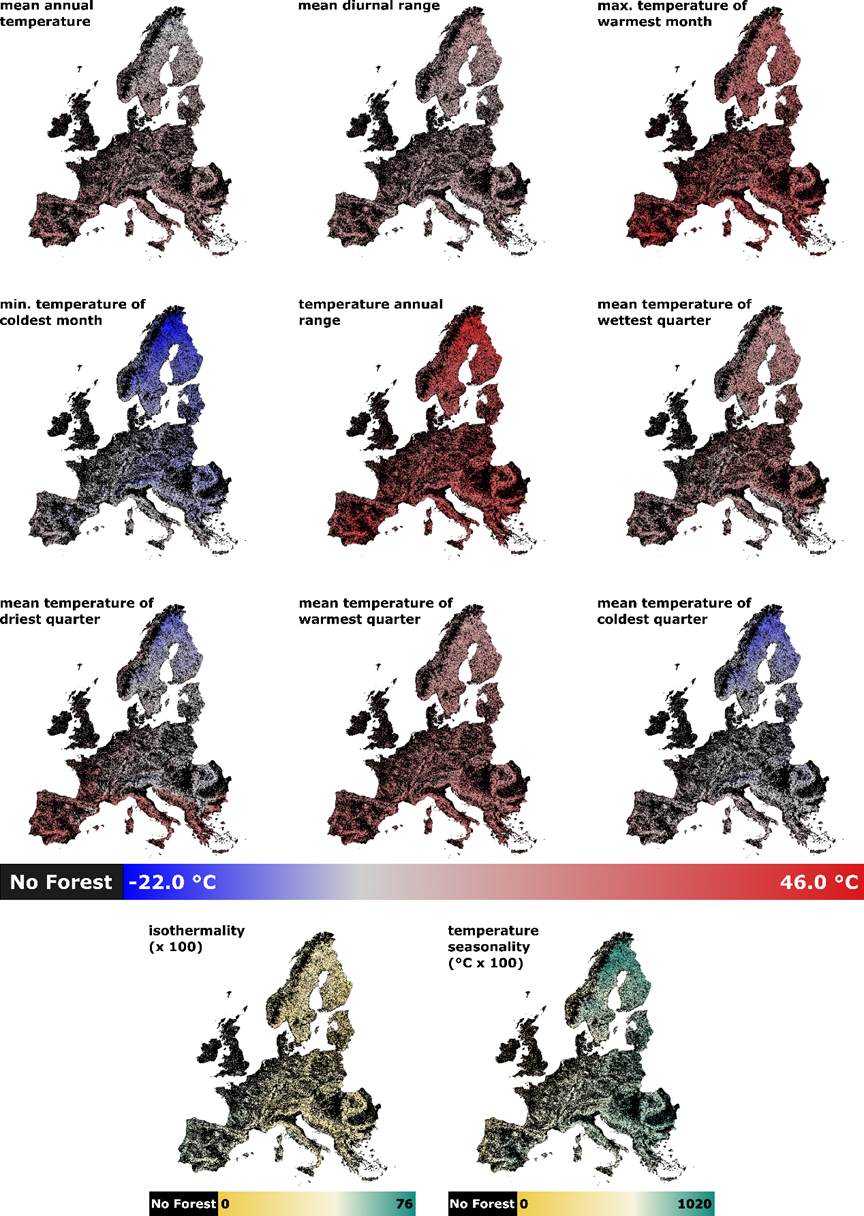
Now, for the attentive follower, these maps might look familiar. And, indeed, you might have seen at least one of them before: the underlying maps are building further on an earlier publication – by the same amazing PhD candidate Stef Haesen – where we showed a proof-of-concept for these forest microclimate models, based on data from the beloved – at least by me – SoilTemp microclimate database. In that first paper, the model was used to calculate mean annual temperature, but quite some more computer power needed to be consumed before we could create the other bioclimatic layers as well.
Now they arrived, and they are free for all to use, as it should be. So, off you go, go model some forest plant distributions using this neat new toy!


")


")
")


")


")


")


")


")


