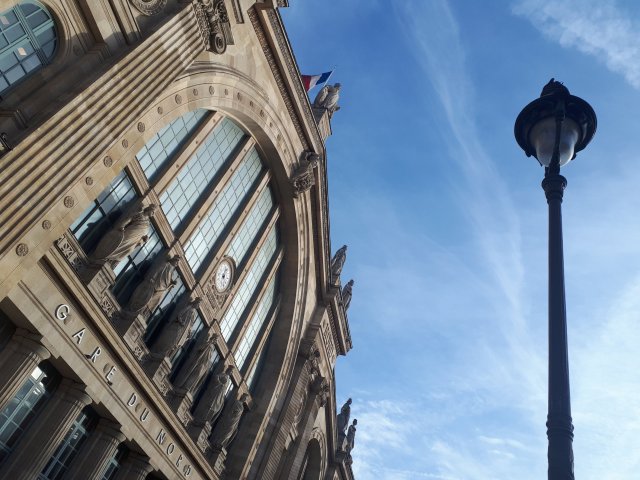
Passing through Paris today on my way to Amiens for a meet-up with colleagues. Looking forward to great science!

Paris, so close to home, yet it feels so different from Belgium!
Passing through Paris today on my way to Amiens for a meet-up with colleagues. Looking forward to great science!
Paris, so close to home, yet it feels so different from Belgium!
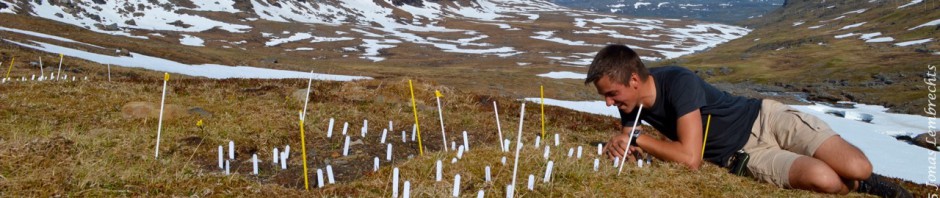
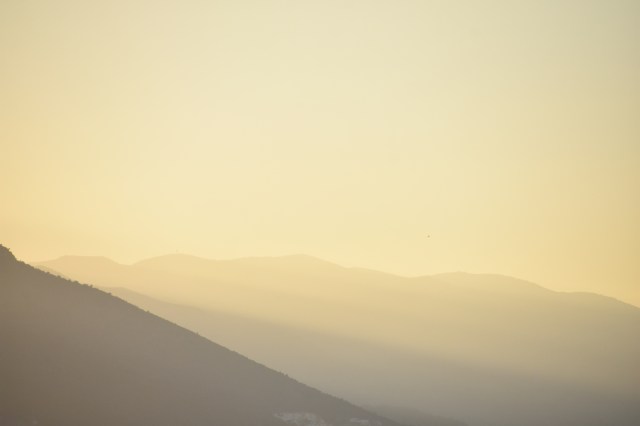
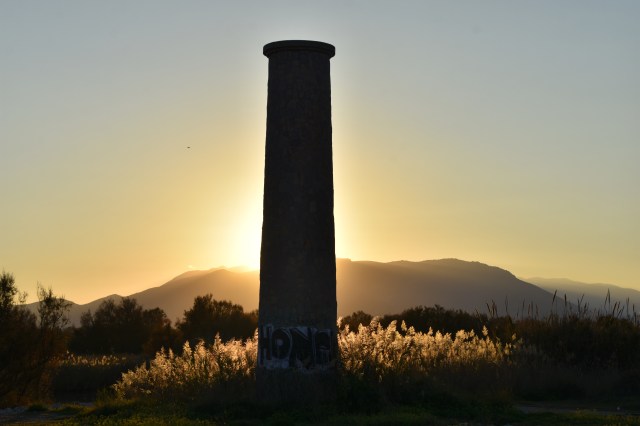
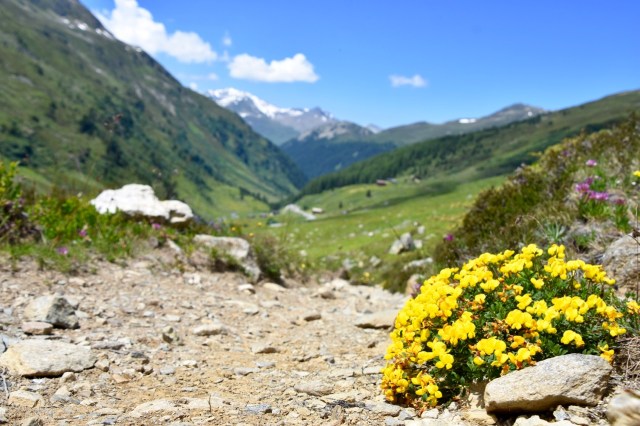
The yearly meetings of the International Biogeographical Society (IBS) provide the perfect opportunity to learn the latest about what is happening in this fascinating field (which focusses on the distribution of species on our planet, in past, present and future). Here, I would like to give you a short impression of what a brief visit to Malaga thought me in that regard, brightened up with some pictures of a short evening walk in the area.
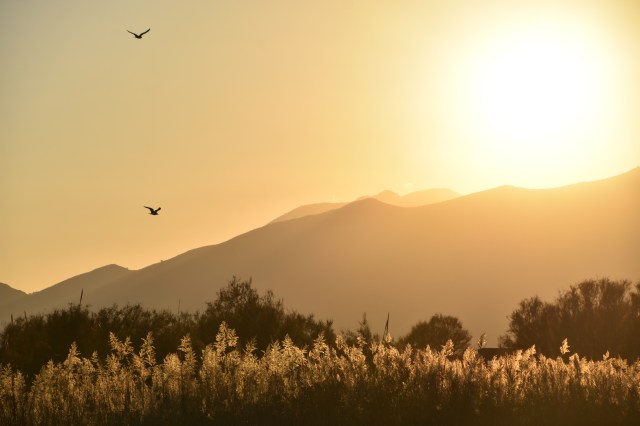
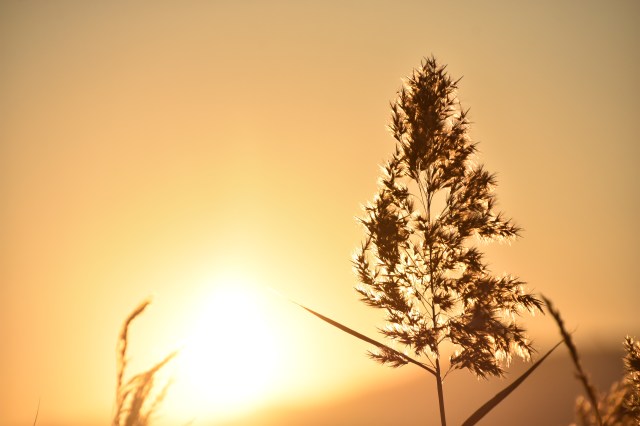
All pictures taken in Parque del Guadalhorce, Malaga
First of all: biogeography is more alive than ever! This old discipline (dated back to some of histories finest biologists) seems to have been revamped recently, as the accelerating changes on our planet triggered new questions and a frantic search for solutions for our biodiversity before it is too late. The problem of global change needs biogeography to be solved, period. Yet it is not only these new and fascinating questions that triggered this revival, it is also the new tools that are currently at hand to answer these questions. And the meeting of the IBS in Malaga provided some fascinating examples of those, many of whom got me very excited to apply them in our own research.

There is the data (oh, the data, so much data!), with nowadays a flurry of global databases, and datasets happily being shared between collaborators all over the globe. Our own SoilTemp-database and the MIREN-network are only two examples of those, and I was humbled to see some of the other major efforts that are out there. Data might seem boring to some, yet good and plentiful data is the basis of any conclusive answer to any scientific question.
With these datasets becoming increasingly more complex, and the answering of ever-more fascinating questions thus within reach, there is a need for good models to process all of that. Luckily, practical statistical packages, freely available, are popping up everywhere, and the community of statistical enthusiasts on the internet happy to help others is bigger than ever. Caution is needed, however, as biogeography is a field where it is easy to get beautiful yet untrustworthy results if one is a bit careless with his statistics. Again, statistics might not seem so attractive to the casual reader of this blog, but I promise you: good statistical models might be saving the world!
Finally, an observation which is key for any science communication: the visuals are improving rapidly. Maps, graphs, animations, even cartoons; quality of them is clearly on the rise, as scientists are getting more and more aware that a clear and attractive figure is the best way to convince the rest of the world of the importance of their work. And this communication is reaching beyond the simple gatherings of like-minded scientists: many biogeographers realize they have something important to say to the world, and are not too shy to say it.
So, as usual I am heading home from the IBS-meeting with a suitcase full of great ideas and a pile of positivity, and most of all the feeling that biogeography is answering some of our times most critical questions. The world is changing rapidly – perhaps even faster than scientists can study it – but the whole community is dedicated to improve our understanding of these changes, and come up with solutions.
Next week will bring me to Malaga, Spain, to a conference of the International Biogeography Society (IBS), a network of ecologists interested in the distribution of species.
I will go there as a representative of my two favourite global networks: MIREN, the Mountain Invasion Research Network, and SoilTemp, our network for the use of soil temperature data in distribution modelling. Both have broadly the same goal: improving our understanding of where species are living, and how the changing climate and human land use affect these distributions.
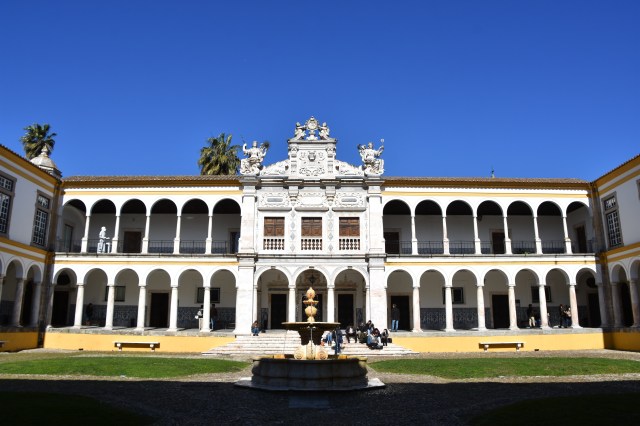
Last year’s meeting of the IBS was in Évora, Portugal, where we hosted a session on what the strong climatic gradients in mountains can teach us about current species distributions
Such questions are well-appreciated at the IBS, where biodiversity and where it is occurring is the main topic of discussion. To me, the main goal of the conference will be to find collaborators for our SoilTemp-project: people who collected soil temperature in the framework of their own studies, and that are willing to join forces with me.
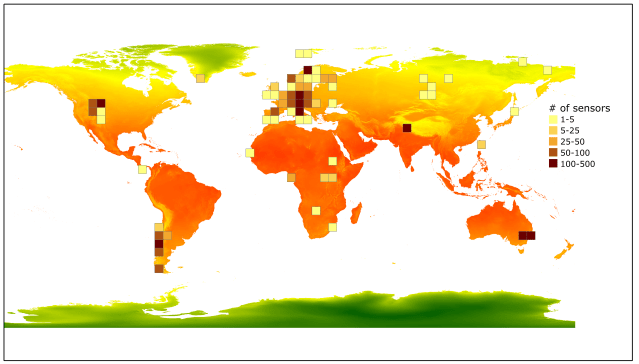
The SoilTemp-network keeps expanding, but there are still a lot of gaps to fill on the world map. We are hoping to fill some of these empty voids at the upcoming IBS-meeting in Malaga.
I will keep you updated about my Spanish adventures, and will hopefully return home with a lot of great new science!
Following good-old traditions, we end the year with an overview of the most viewed posts on this blog from the past 12 months. In a previous post, we started our overview of 2018 with the 5 most viewed posts of the first half of the year. Now, I bring you part 2 of ‘2018 in stories’, with more species on the move, mountain roads and trails, and a lot of microclimate!
Summer brought a long-anticipated paper from the MIREN-network: we knew a lot about non-native species using mountain roads to hitchhike their way to high elevations, but very little was known if they could then subsequently start invading the natural vegetation from there. This story gives the much-needed answer.

Perhaps the biggest story of the year, and one that will cause major waves into 2019 and far beyond, was the launch of our SoilTemp-database project back in August. With this post, we first invited all scientists to submit their soil temperatures and associated ecological data to our database. Now, by the end of the year, we already incorporated data from over 3200 loggers from 24 different countries, with no sign of submissions slowing down yet! Check out the website here.

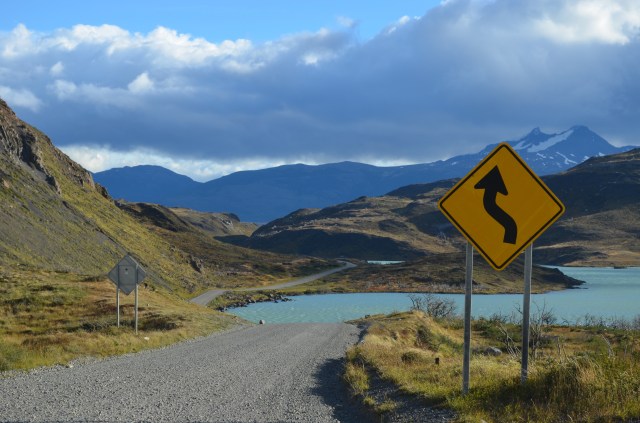
Our MIREN Trail Survey again enters this list in the second part of the year. In this post, we gave a first visual overview of all the data that had been submitted to our trail project by all participants from all over the world by the end of last summer. At the same time, we launched a new call for people from the southern hemisphere to keep an eye out on the mountain trails for our focal species, as their summer was only starting.
9) The climate the organism feels

Another major accomplishment this year was the publication of our review on the use of microclimate in species distribution models. We brought together all knowledge the scientific community has so far in that regard, and designed a way forward for the field towards the future. We strongly believe all the necessary tools and knowledge are in place now to model the distribution of species based on the climate as they experience it, instead of some rough average from weather huts. You can read our argumentation here.
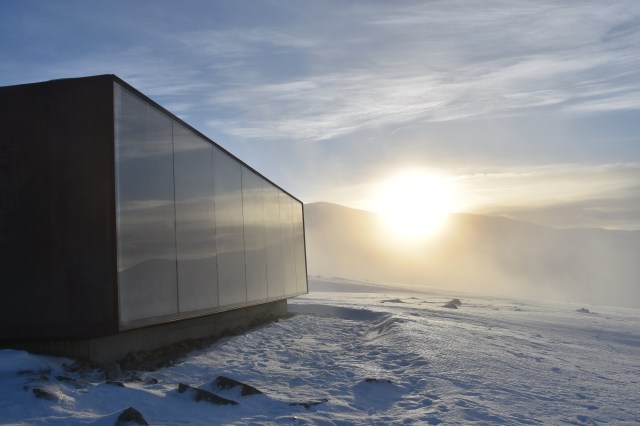
The last major story of this year covered our meeting in Dovre, Norway, in a snowy November. Another story that mostly looks at the future: we came together to officially kick-off the PhD-trajectory of Ronja, who will be studying the role of mountain trails as drivers of vegetation change in the years to come. This post summarizes our plans, generously spiced up with pictures of the beautiful fieldwork region.
Here on ‘On top of the world’, we have the tradition to end the year with a ‘best of’, a list of the most read stories on this blog from the last year. This list helps us to wrap up everything that happened here in the last 12 months. And that is a lot of big things, as you will see.
12 months ago, our situation was indeed very different from where we are standing now. At the beginning of the year, I was still full-on working on the defence of my PhD, yet since then, this website – and I – have rapidly evolved. Now, this site is a true reflection of the team of people we are, all working together to answer our scientific questions.
Here is part 1 of ‘2018 in stories’, with our growing knowledge on how species are on the move due to global change running as a thread through the year:
1) Species distributions in a messy world

We kick off the year with an important meeting we had early February in Zürich, Switzerland. The Global Mountain Biodiversity Assessment (GMBA) brought together experts on species distribution modelling and remote sensing. The goal, supported by the European Space Agency (ESA), was to brainstorm around how the future of distribution modelling will look, thanks to the rapid evolvement of remote sensing tools like satellites. The conclusion of this workshop will hopefully be published in the next year, but the blogpost already lifts a tip of the veil.
2) Climate change biogeography
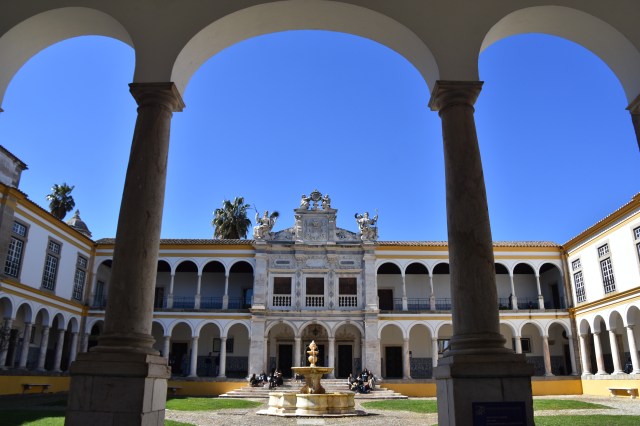
Our second meeting of the year, in Évora, Portugal, brought together hundreds of biogeographers, scientists studying the distribution of species, and how they change. At this conference, we discussed another fundamental question: how does climate change affect species distributions, in the past, the present, and the future? This blogpost summarizes shortly what we all know so far.
3) Matching the plant with the environment

In april, we published a paper on what makes invasive plant species so successful. The perfect match between plants and the environment, so turns out. And that match can even change dramatically between local populations of the same species within our little Flanders, as you can read here.
4) Plant species are on the move, and it is us humans who move them
April also brought the biggest milestone of the year: my PhD defense! In this post, I summarize the story I wanted to bring to the world after 5 years of scientific inquiry: plant species are on the move, and our human behaviour is speeding up that process, due to the way in which we use the land. Roadsides are a good example of that, with countless plant species travelling up and down mountain roads.
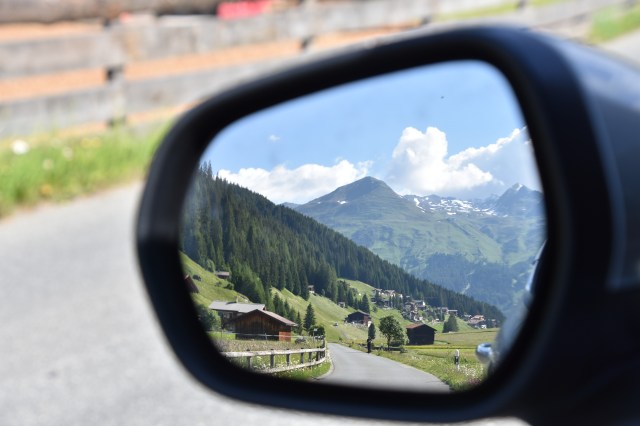
We end this first half of the year with trail adventures: in June, I spent a few days in Davos, Switzerland to talk about polar ecology, and to hit the trails for science. I used this splendid opportunity in the heart of the Swiss Alps to collect data for our global trail survey. This post summarizes how that endeavour went, as a teaser and an example for any other mountain lover willing to spend a day hiking mountain trails and collecting data for us.
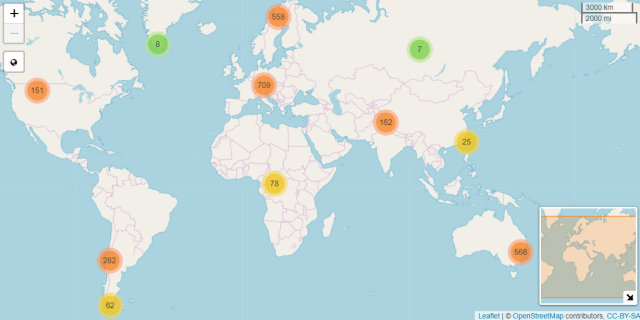
We have been receiving a lot of early Christmas gifts lately. 2608 in total, more precisely, from a mind-boggling 22 different countries across the world. That is the current status of our SoilTemp-database: 2608 unique temperature loggers, many of them with data from several years, and no clear sign of submissions slowing down just yet.
Click on the map below to explore the metadata of the database in detail, or visit our SoilTemp-website.
Next up will be 2019, in which we will start processing these vast amounts of data (while continuously adding new datasets) and try to make sense of what we see. Stay tuned!


")


")
")


")


")


")


")


")


