An anticipated package

Last week brought a fantastic and long-anticipated present from the Czech Republic in my mail: two heavy boxes with over a hundred TOMST TMS-4s. That name is a code for something that I would call without exaggeration a new era in microclimate monitoring.

DSC_6654

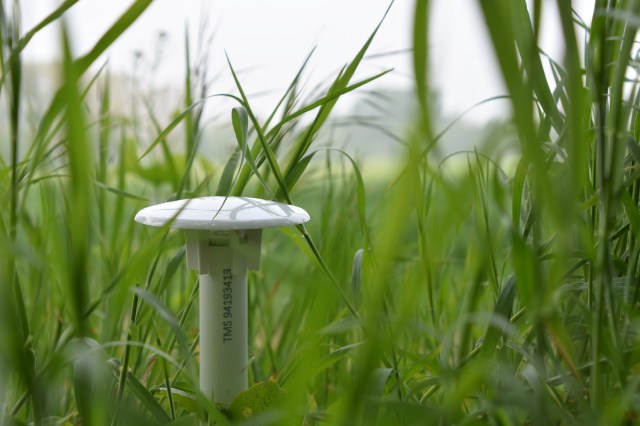
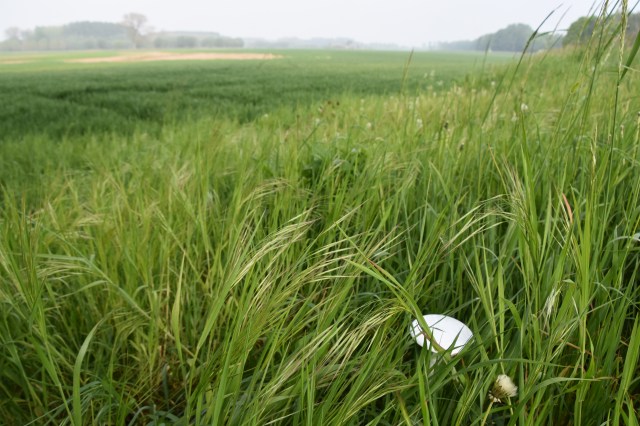
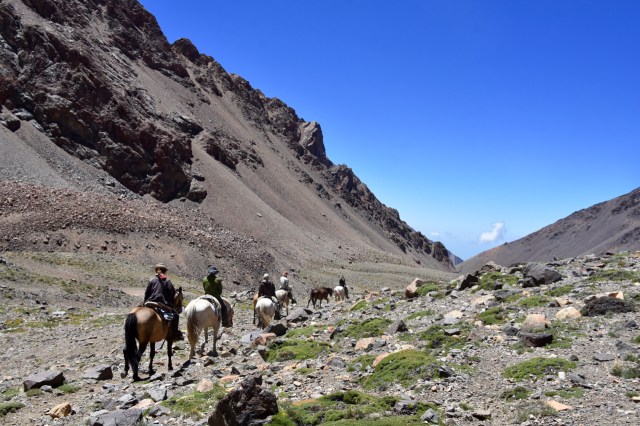
Testing our new TMS4s in the field, before shipping them off to Scandinavia for their real duties

Faithful followers of this blog should by now know that I am a strong advocate for measuring climatic conditions right where it matters for plants and other organisms. I want us all to get away from the coarse-scaled decennial climate averages based on weather station data, as for most organisms, these climatic values are strongly decoupled from the conditions they actually experience.

DSC_6650

I have been pushing a lot for the measurement of topsoil temperature (with our recent SoilTemp-initiative as a good example), as these temperatures are close to the core of the environment for many organisms and allow to take into account the strong mismatch between air and surface temperatures (e.g. under the snow or on the forest floor).

DSC_6638

Yet we can – and should – do better! Soil temperature is a huge improvement over air temperature, but there is a lot more relevant parameters to measure. Our colleagues at TOMST and the Institute of Botany of the Czech Republic developed, tested and commercialized a major step forward in that regard: the TMS Temperature and Moisture Sensor. These little white mushrooms not only measure soil temperature, but also surface ànd air temperature close to the soil surface. Moreover, they measure soil moisture, a crucial driver of plant life (and soil climate). As such, the sensor simulates a small plant, measuring the main climatic conditions that plant would experience.

DSC_6633

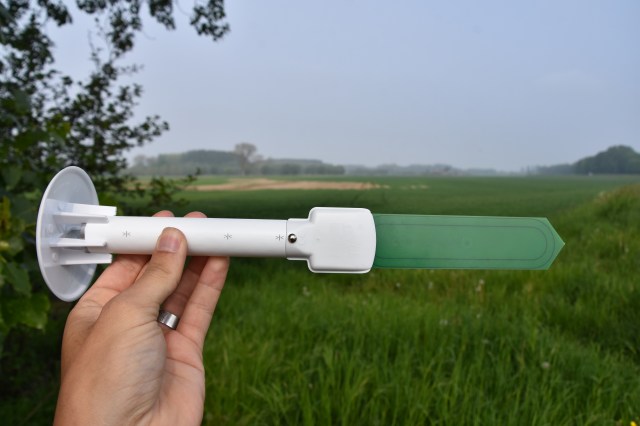
The TMS4, with the mushroom head to protect against the sun (left), and the soil moisture sensor (in green, on the right)

To anybody in need of accurate microclimatic conditions for organisms living close to the soil surface, I highly recommend these, especially because they sound very promising regarding battery life and memory size. And if you do buy them, consider submitting the resulting observations to our growing SoilTemp-database!

If you want to read more about these loggers, I can recommend you the new paper from Wild et al. (2019), describing them in detail. Now please excuse me, I have to go write project proposals to buy a ton more of these gems!

Posted in Belgium, General | Tagged , , , , , , , | 2 Comments

iNaturalist

Natural history – the science of nature observation – has taken a rocket into the 21st century, and I love it. The ‘rocket’ I am talking about is called iNaturalist, and it is an app that allows anybody in the world to take pictures of the living world around them and upload them on the website. Yes, dusty old herbaria and insects on alcohol are still a thing, but observing species has become a lot easier and faster lately.

40681920803_cd53a9a9c7_o

Wood anemone

Once you have taken a picture of a living thing and uploaded it to the app, a deep learning method – based on the huge database of correctly identified organism pictures – gives you a suggestion of which species you have observed. Such apps are popping up like mushrooms in the last years (I positively reviewed Pl@ntnet here earlier), but iNaturalist, which celebrated its 10th anniversary last year, is different in a crucial way.

28064204007_32352f792a_o

The alpenrose

iNaturalist is more than a robot recognizing plants and animals. It’s a community. It’s a social network of naturalists and nature enthusiasts, as of today (it’s a busy week at iNaturalist) 130 thousand (!) strong across the globe. If you upload a picture and give it a name, either with the help of the robot or based on your own knowledge, the community will check your observation and verify the ID. If the community agrees, your observation becomes ‘research grade’. And that is particularly awesome.

40095438973_27d702d71b_o

Two observations at once! A skipper on a thistle, in the Chilean Andes

Research grade means that the identification is sufficiently trustworthy for it to be used for research. That is, people like me, ecologist, biogeographers, scientists interested in the distribution of species, get another data point to work with. The data gets automatically fed in into GBIF, the Global Biodiversity Information Facility, the huge database of species distribution data that is used by countless ecologists in their research.

DSC_6907

iNaturalist is especially well suited to map biodiversity in our cities

And you know what? For so many of our questions, all we scientists need to know is where a species occurs. The coordinates of its location. It is as simple as that. So if you see a species – boring or cool, common or rare, snap a picture of it and upload it to iNaturalist, you are basically giving us a datapoint to work with. And that is just awesome. You should try it out! I promise you, we ecologists will make good use of your input. It can be crucial in our ongoing job to save as much biodiversity as we can, in a world with rapidly changing climate and land use. As all is changing so fast, every observation may count.

Even yours.

40693816123_052f6184bf_o

Allium ursinum, wild garlic, an easy one to identify for the iNaturalist robot

Posted in General, Science | Tagged , , , , , , , | 4 Comments

City life

32555647887_62d7ee0c66_o

Take this proudly walking pigeon in the port of Barcelona as an announcement for next week’s talk about life in the city, which I’ll be giving for the biologist students at the University of Antwerp.

In a session in a series of after-hour events on fauna and flora in our region, I will be introducing them to how climate and land use change together create novel ecosystems, with an unseen combination of climatic, environmental and biotic conditions. A novel ecosystem that requires a lot of flexibility of species trying to survive there.

No better example of that city environment than the built-up mess that is Flanders, where we are studying the effect of the Urban Heat Island on newly introduced species. Tbe students are lucky enough to get a sneak peak on some of our newest results in that regard, on how plant species from a warm origin prefer this city climate and use cities as a gateway to the rest of the country. More on that soon!

Posted in Belgium, General | Tagged , , , , , , , , , , | Leave a comment

Manzano

Please allow me some nostalgic feelings today. If I show you the pictures I was browsing through, you’ll immediately realize why:

32118590927_873e3186b2_o

It is nostalgia for that fabulous day on the steep mountain road heading out of el Manzano up to the slopes of the dry Argentinian Andes, and it was fieldwork with such stunning views that they will forever remain in my memories.

32118592847_be96b471f0_o

Scouting for plants on the slopes of the Andes around Mendoza, Argentina

It was our one but last fieldwork day in South America, beginning of February, and we were determined to get the most out of it. In the morning, it was up, up, up to the top of the road, thanks to the skilled mountain road driving of Agustina, one of our amazing hosts in Mendoza.

33185088868_93a4eda4b2_o

Travellers on horseback on their way down from the Chilean border

The road took us to the rocky world at close to 4000 meters above sea level. Only a bit higher, the road eventually stopped dead, limiting travel over the pass to the Chilean border to  sure-fooded horses only.

46324415524_2dcf4c3941_o

Amazing succulent Viola (was it ‘atropurpurea’?) in the high Andes. Not the best season to see them, but you can still see remnants of the cute circle of Viola flowers surrounding the rosette

This rocky high-elevation environment not only brought stunning views, yet also some of the most intriguing plant species I have ever seen. Oh, alpine vegetation is stunning everywhere, but the high Andes in Mendoza has some wonders that you would have to see for yourself to share my excitement.

33185086108_bd2ef4a8fa_o

Fluffy grass waving its little horsetail-like flowers in the wind

33185085808_aca6656eae_o

The spiky branches of Mulinum spinosum

33185086778_1ea97e7661_o

Large cushion plants of Adesmia subterranea scattered the rocky slopes

One could never get enough of this stunning environment, I promise you. We worked our way down along the road back to the valley, studying the impact of the road on the alpine vegetation all along the way.

32118588567_d208a800fc_o

Road building uprooted a centuries-old cushion plant

Another of the roads from our global MIREN-network that I could now add to the list of study areas I visited. Another unique environment so different from the other mountain roads I have seen all over the world. Yet interestingly, many of the road effects are comparable in all of them, a fact that hits home a lot harder when you see all these unique places in real life.

46336499624_b35c29b2f9_o

When evening came, after a long day of sampling, the light deepened and the shadows of the mountains lenghtened. Another beautiful summer evening arrived, and wildlife slowly emerged.

46146740425_c5900292f0_o

A curious fox circled around our fieldsite for a while

46146741025_d45cfc4ccf_o

The wonderful ‘torrent duck’, playfully rafting in the strong currents of mountain streams

Better times to remember on this ‘Throwback Thursday’ might be hard to find. And all of that thanks to the fantastic scientists from the MIREN Mendoza-team, without whom nothing like this would have been possible!

46336499904_f0a2728b6a_o

Our fieldwork team in the evening sun, after an unforgettable fieldwork day

46336501394_7f4df0bf40_o

The footlands of the Andes, flat as a biljart table, just after sunset

Posted in Argentina, General | Tagged , , , , , , , , | 1 Comment

Linguistic wonders

So, I had a little question: did my English vocabulary improve after 5 years of paper writing? Good question, I thought, and nothing our good friend R could not help me answer! So I dove into the data, read in all 10 of my first-author publications (8 published, 2 in the review stage) into R (after cleaning away references and figures), and asked R boldly: is there more unique words in my more recent work? I went for the easy answer at first: I took a sample of 2000 words (to unify the length of each paper) from every paper and calculated how many unique words could be found in each one of them. The results were… disappointing (Fig. 1):

Figure 1 (1)

Figure 1: The number of unique words in a standardized sample of 2000 words (app. 3/4 of most papers) for each of my first-author publications, chronologically ordered (paper 1 published in 2014, paper 9 and 10 currently in the review stage).

A linear model on that data was far from significant: no trend at all could observed here. Perhaps I was not getting more eloquent after all?

But then my wife pointed out that, yes, sampling 2000 words is an attempt to standardize between papers, but the length of each paper will still strongly affect the amount of words used, with longer papers allowing for a more variable word use.

Could that be true?

Figure 2

Figure 2: The number of unique words in the same standardized sample of 2000 words, yet now as a function of the total length of the paper

Oh, yes, it was true! Longer papers indeed – perhaps obviously so – allowed for a higher diversity in words, even within that sample of 2000 words!

So what to do next? I still wanted to know if, if corrected for that bias, my vocabulary was increasing. After a brief over-dinner consult with my linguistically trained sister-in-law, I came up with the following:

Figure 3

Figure 3: cumulative unique word count throughout each paper (gray/reddish is old, greener is new, black is the most recent paper)

This graph wonderfully solves the issue, in my opinion. By plotting the cumulative unique word count in the order of the paper, I neatly take into account changes in structure in the writing, as per linguistic advice, while correcting for the length of the paper. Steeper curves would suggest a more elaborate use of the English language, even when they stopped earlier due to shorter paper length.

And indeed: my more recent papers (in green in Fig. 3) all but one (paper 6) show a steeper curve compared to the older papers. Especially paper 10 (the black line) is an interesting case, as it was a clear low outlier in Fig. 1. This time, it revealed a steep curve, together with the other recent papers, showing a great variety in word use despite its shorter length.

The trend is perhaps not too shocking, but of course none of these papers are ever written by me alone. There is a whole team of professionals behind each of them, giving me advice along the way, and likely suggesting new vocabulary to use, especially early on in my career.

So my vocabulary improved (a bit) over time. But how did the use of specific words change? Can we visualise changes in my topics of interests from the early stages of my PhD to my time as a postdoc now? As I now I had all this papers elegantly read in into R, this could easily be done. Check out the following:

Figure 4

Figure 4: Frequency of words in my 3 most recent papers (from my postdoc, so to speak), compared to word frequency in my 3 first papers (2014-2016). Colors indicate overall frequency of the word in question, the dashed line indicates a constant use in both datasets. Not all words are visualised.

And oh, is that interesting! There seems to be a constant interest in ‘change’, ‘anthropogenic’ and ‘conditions’ (as these are close to the dashed line). But my overal interest clearly shifted from a focus on ‘survival’ (of plants), ‘gaps’ (caused by disturbance), ‘native’ (and ‘non-native’ species) and ‘alpine’ and ‘elevational’-related questions to ‘soil’, ‘air’ and ‘microclimate’, and ‘temporal’ and ‘spatial’ patterns in ‘distributions’ at the ‘local’ ‘scale’.

Take this last one as a ‘spoiler’: from this recent papers, only one is currently published, so you can expect some more cool things about microclimate in the near future, as we are finally opening the black box that is the soil. Please stay tuned if you like those words above the dashed lines, cause you will see a lot more of them! If you are more of a fan of what happens below the dashed lines: don’t worry, there will be more of those as well, yet perhaps less often with me as a first author. That’s why we have students on board now!

Want to answer similar questions? The ‘Text mining in R‘-book from Julia Silge and David Robinson is a great source of code!

Posted in General, Science | Tagged , , , , , , | Leave a comment

Dark diversity

Spring finally arrived here in Belgium, and with that spring the  fieldwork vibe inevitably starts blossoming as well.

Kalmthout - 3

The ‘Kalmthoutse Heide’, north of Antwerp, on a grey day just before the start of spring

To get that fieldwork vibe up to speed, we headed north of Antwerp, to the ‘Kalmthoutse Heide’, a large swath of semi-natural heathland on the border with the Netherlands, and – in my opinion – the jewel on nature’s crown around Antwerp. There, we had a meeting with a forester of the Agency of Nature and Forest (ANB) to scout for plots for a new and exciting experiment for this summer, with a fascinating name: Dark Diversity.

Kalmthout - 2

A sandy road through typical heathland vegetation

No, we will not be monitoring orcs, trolls and other dark spawn, dark diversity simply refers to those species that are NOT present in a certain place, although they theoretically could be there. The absent biodiversity, so to speak. To get a formal idea of which species are not present in a certain area, we joined the global DarkDivNet Network, who will be monitoring this absent diversity all over the world.

Kalmthout - 7

Some colour on that grey day: a garden variety of Erica tetralix, with Narcissus in the background

The idea is to monitor the vegetation in a typical natural or semi-natural ecosystem in your region, and compare that with the total plant species diversity in the whole are. That should show that only a subset of all species in a region can tolerate the ecological conditions of a given site. Of those, not all are realized in local communities. The absent part of the species pool forms the dark diversity of a community.

It is for this reason that we drove north to the heathland area in Kalmthout, a fascinating ecosystem with high conservation interest. Including this vegetation type as flagship of our Flemish nature into the global network sounded like a great decision.

Kalmthout - 6

Dramatic landscape where recently a forest has been cut, aiming for heathland recovery

To study those processes that influence the dark diversity, we will compare the typical  heathland vegetation with a side that has seen recent anthropogenic disturbance. We went for a drastical disturbance: the complete removal of a pine forest – complete with invasive shrubs and all – for heathland restoration.

Kalmthout - 5

This site is still far from the target heathland vegetation, yet will over time hopefully slowly converge. This should reveal some cool dynamics in the dark diversity as well.

Kalmthout - 1

For now, we stuck to a short scouting mission. We will return in summer for the real deal: vegetation surveys and soil sampling, hopefully under a sunny summer sky! Stay tuned!

Posted in Belgium, General | Tagged , , , , , , , , | Leave a comment