The impact of extreme weather on the cultivation of potatoes

Blogpost written by Bart Deronde, and originally published (in a much prettier shape) on the blog of VITO.

In spring 2021, the largest citizen science campaign ever on the impact of heat and drought in Flanders’ gardens & fields ‘CurieuzeNeuzen in de Tuin’ took off, assuming that we would again suffer from heat waves and long dry spells as we got used to in the past years. But, weather isn’t predictable over a whole season and hence it turned out differently …

In this blog we dig into the meteorological observations, the measurements by the CurieuzeNeuzen sensors installed on the potato fields, the impact of the extreme weather on the cultivation of potatoes, and we give an outlook on the analyses planned.

CITIZEN SCIENCE ON DROUGHT! WAIT, WHAT?

In spring 2021, ‘CurieuzeNeuzen in de Tuin’ was kicked off. Led by the University of Antwerp and De Standaard, this massive citizen science project wants to gain insight in the microclimate and measures to which extent our gardens, public green spaces, and agricultural fields are susceptible to heat and drought. Expecting again a dry and hot summer season, 5000 “gazondolken” or “lawn daggers” were installed to measure the temperature and soil moisture between April and October 2021. But … the summer of 2021 will be remembered as the wettest summer ever in Belgium. What does this mean for a citizen science campaign on heat & drought?

Sentinel-1 satellite images of 9 and 15 July 2021 clearly show the effects of the exceptional rainfall.

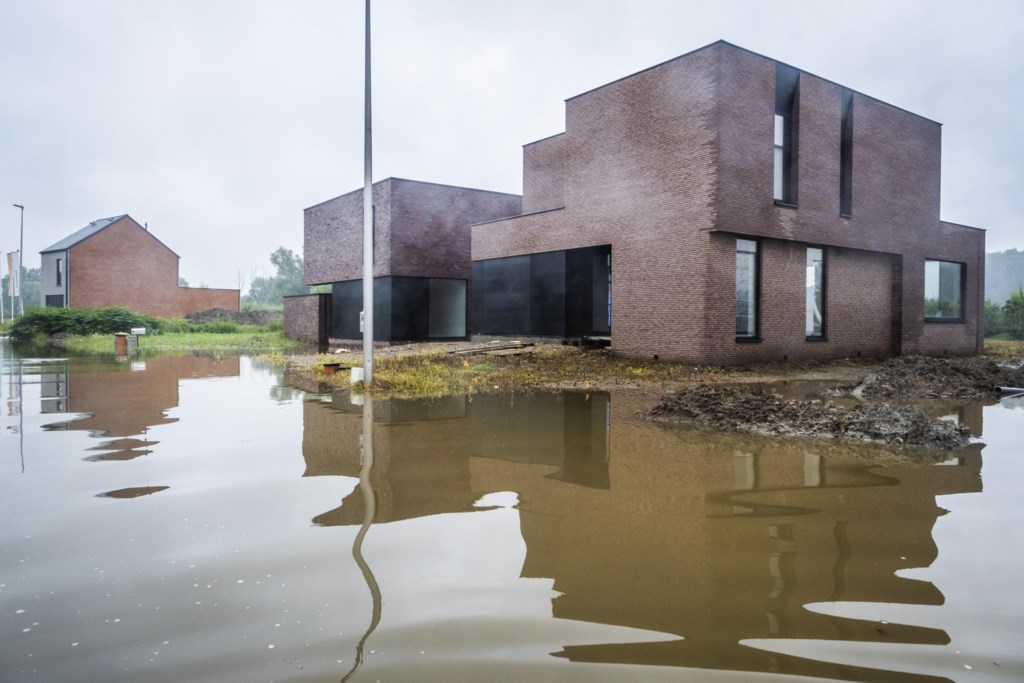
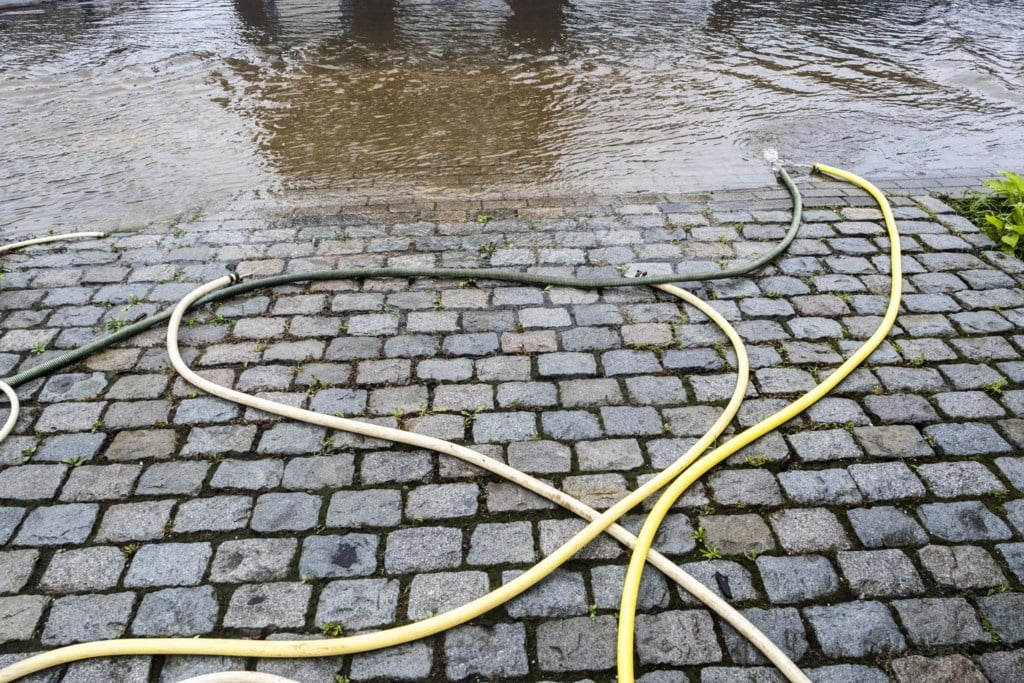
The meteorological observations tell the story of this summer. We had to cope with intense and heavy rainfall. After a warm and dry onset during the first two weeks of June, the weather pattern drastically changed. Pouring rain was on the menu almost every week, with regularly days of more than 15 mm. In Brussels, the Royal Meteorological Institute recorded 410 mm of rain during the meteorological summer (June-Aug) while the average is only 234 mm. But there were also major regional differences. As we all know, the South-east of Belgium suffered from extreme rainfall, leading to catastrophic floods, while the North of Belgium experienced rather normal weather conditions.

115_Agro-CNIDT_FigKMI_ENG

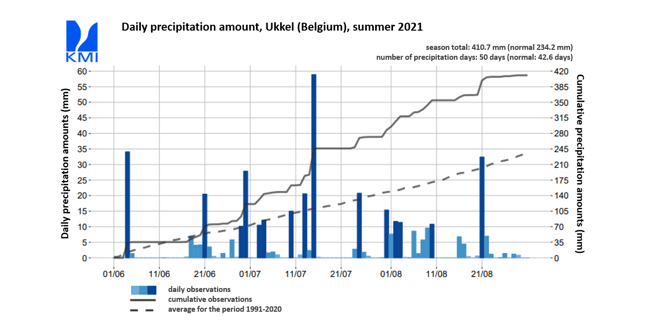
Daily amount of rain in Brussels during the summer of 2021.

500 SOIL AND TEMPERATURE SENSORS IN VARIOUS FIELDS

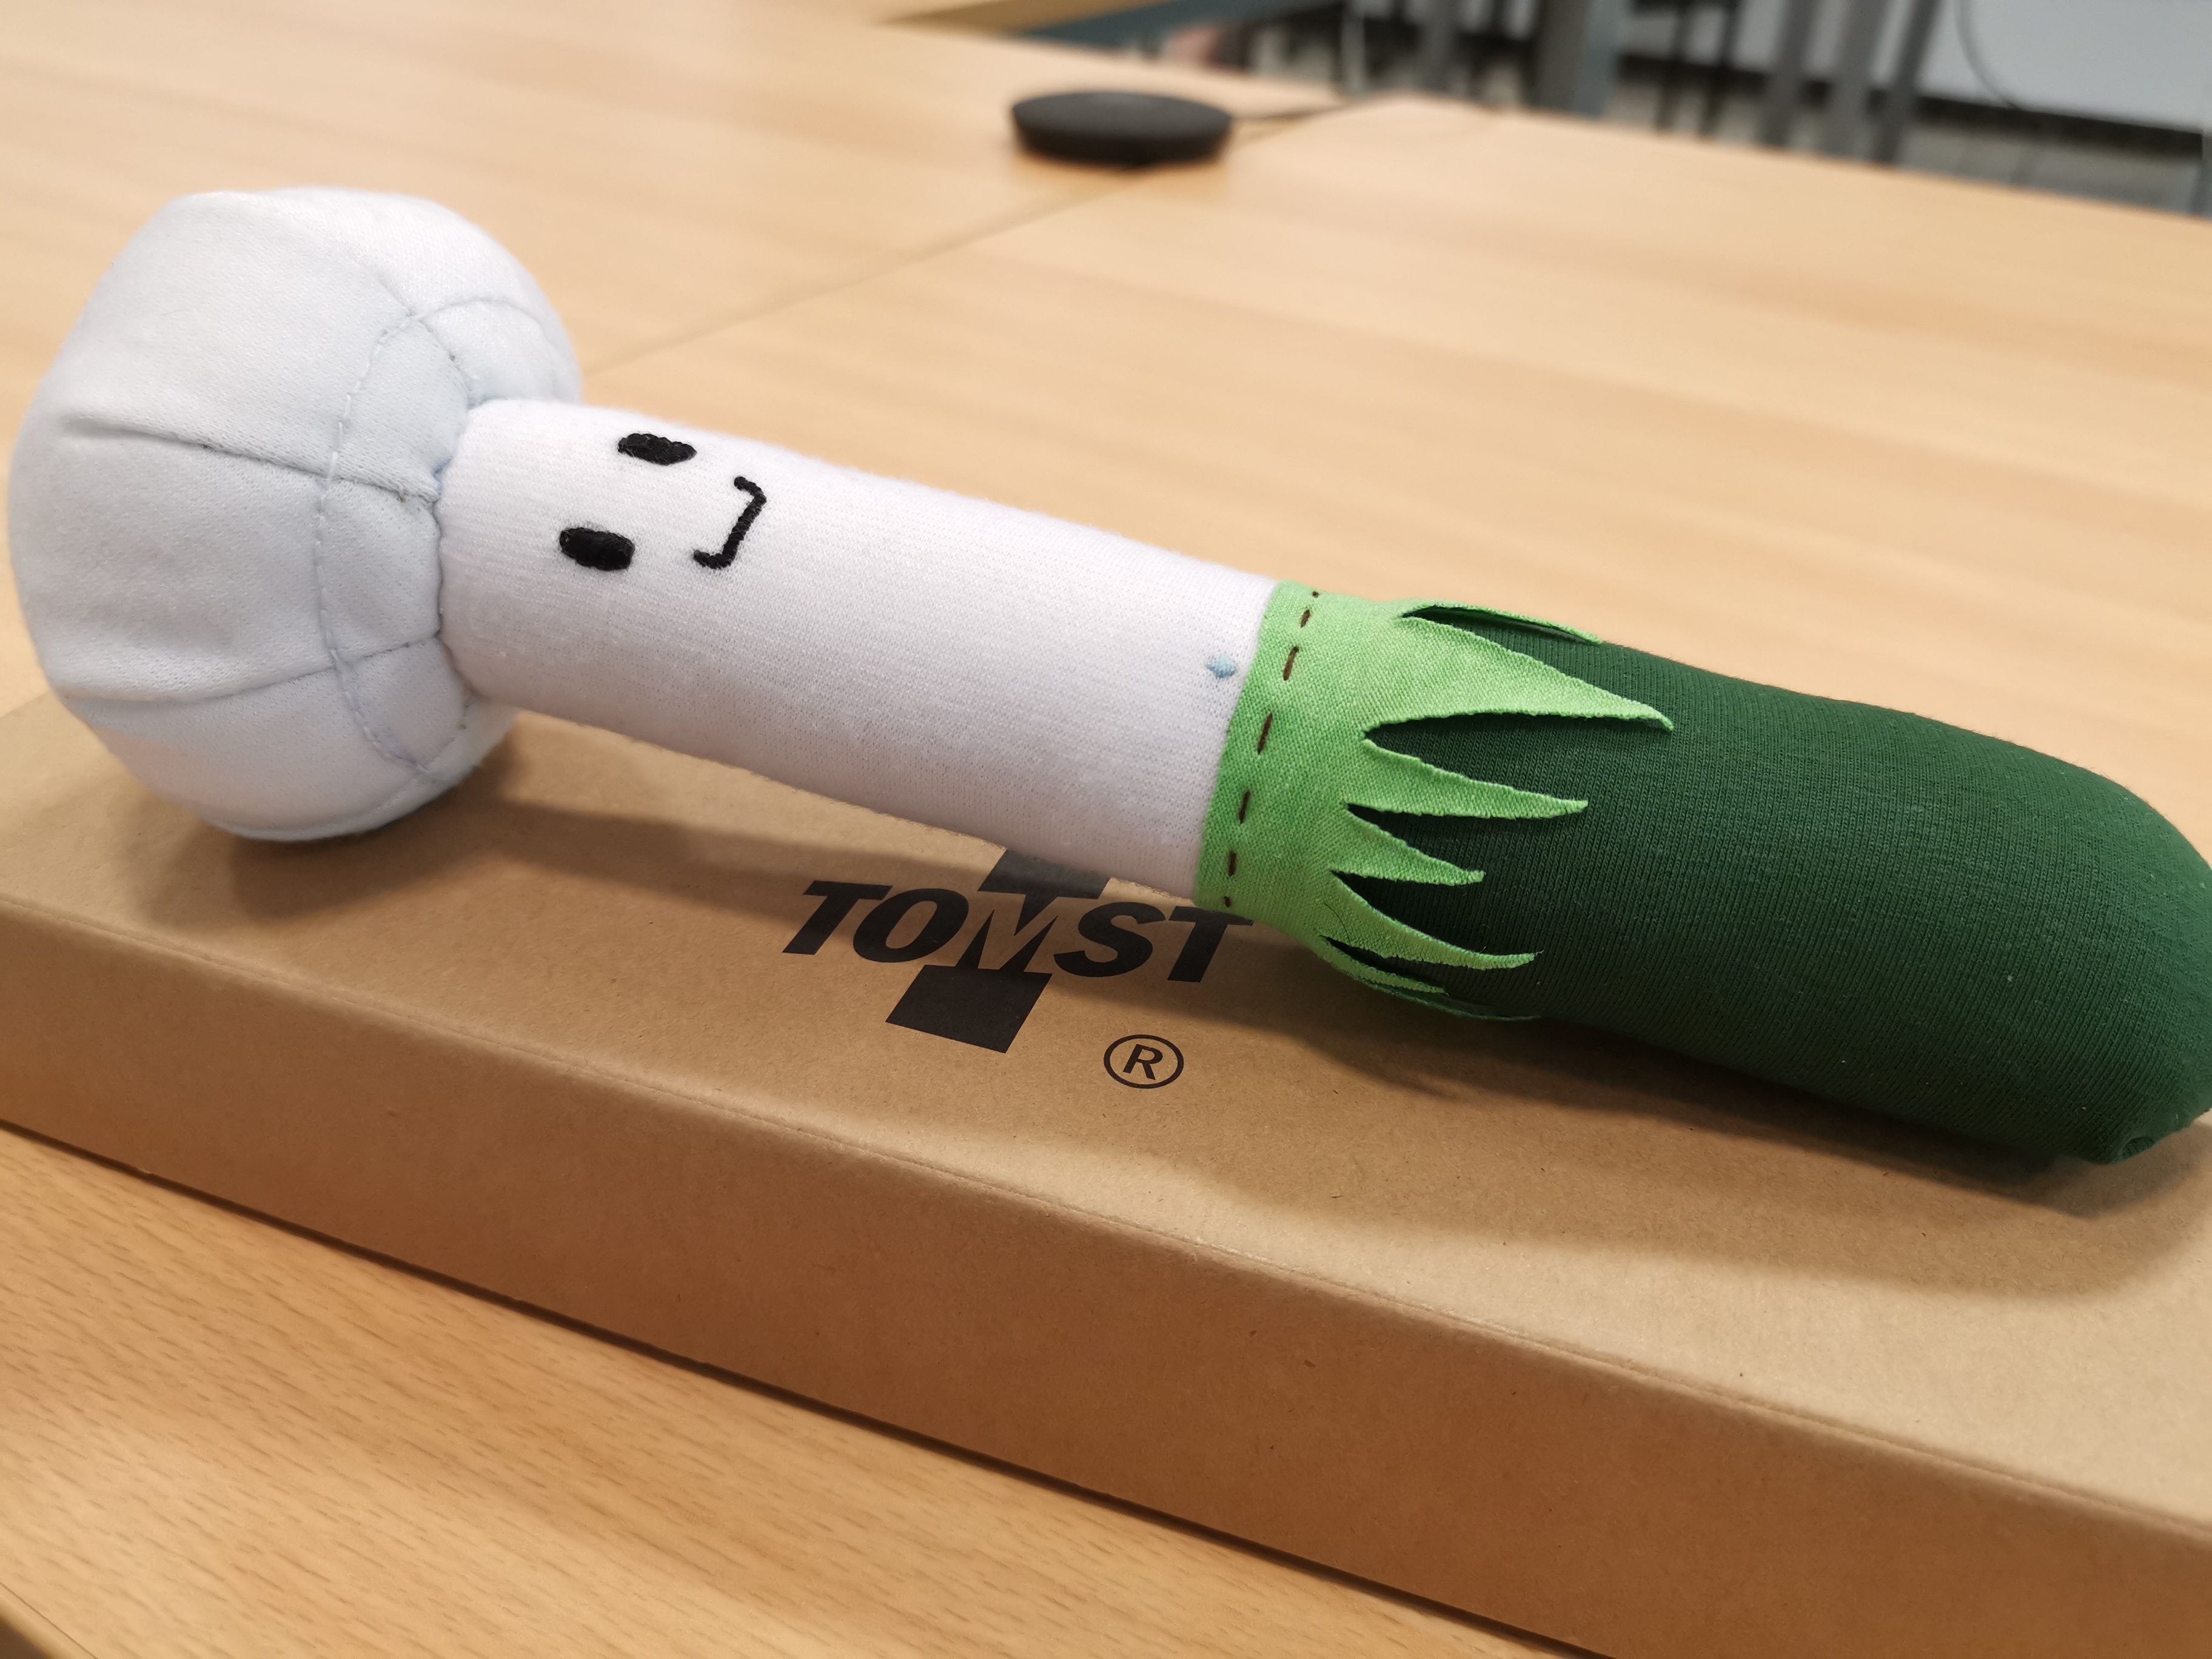
Within the CurieuzeNeuzen project we’re not only looking to private gardens and public green spaces, we’re also gathering data on fields to learn more about the impact of extreme weather, either dry or wet, on our agriculture. In June 2021, at the start of the growing season, we installed almost 500 sensors in 295 potato fields spread over Flanders. Additionally, we installed 30 sensors in orchards (pear, strawberry, blueberry and vineyard) as a side experiment.

IMG_20210603_134023
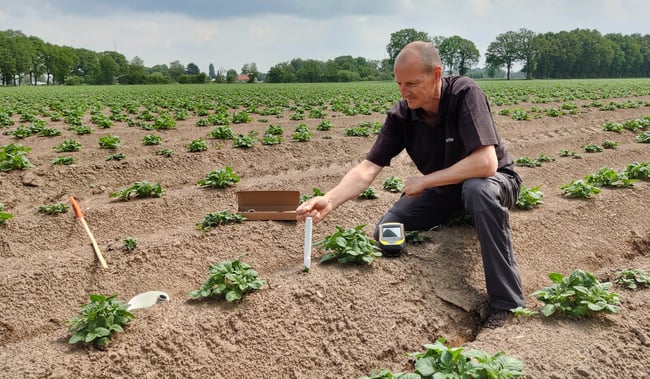
Installation of 500 soil and temperature sensors in several potato fields spread over Flanders.

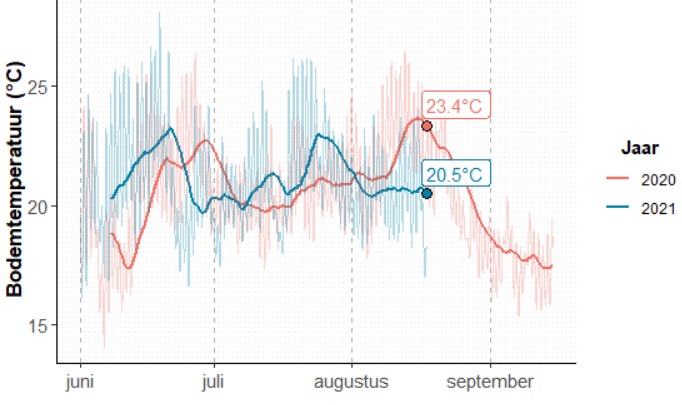
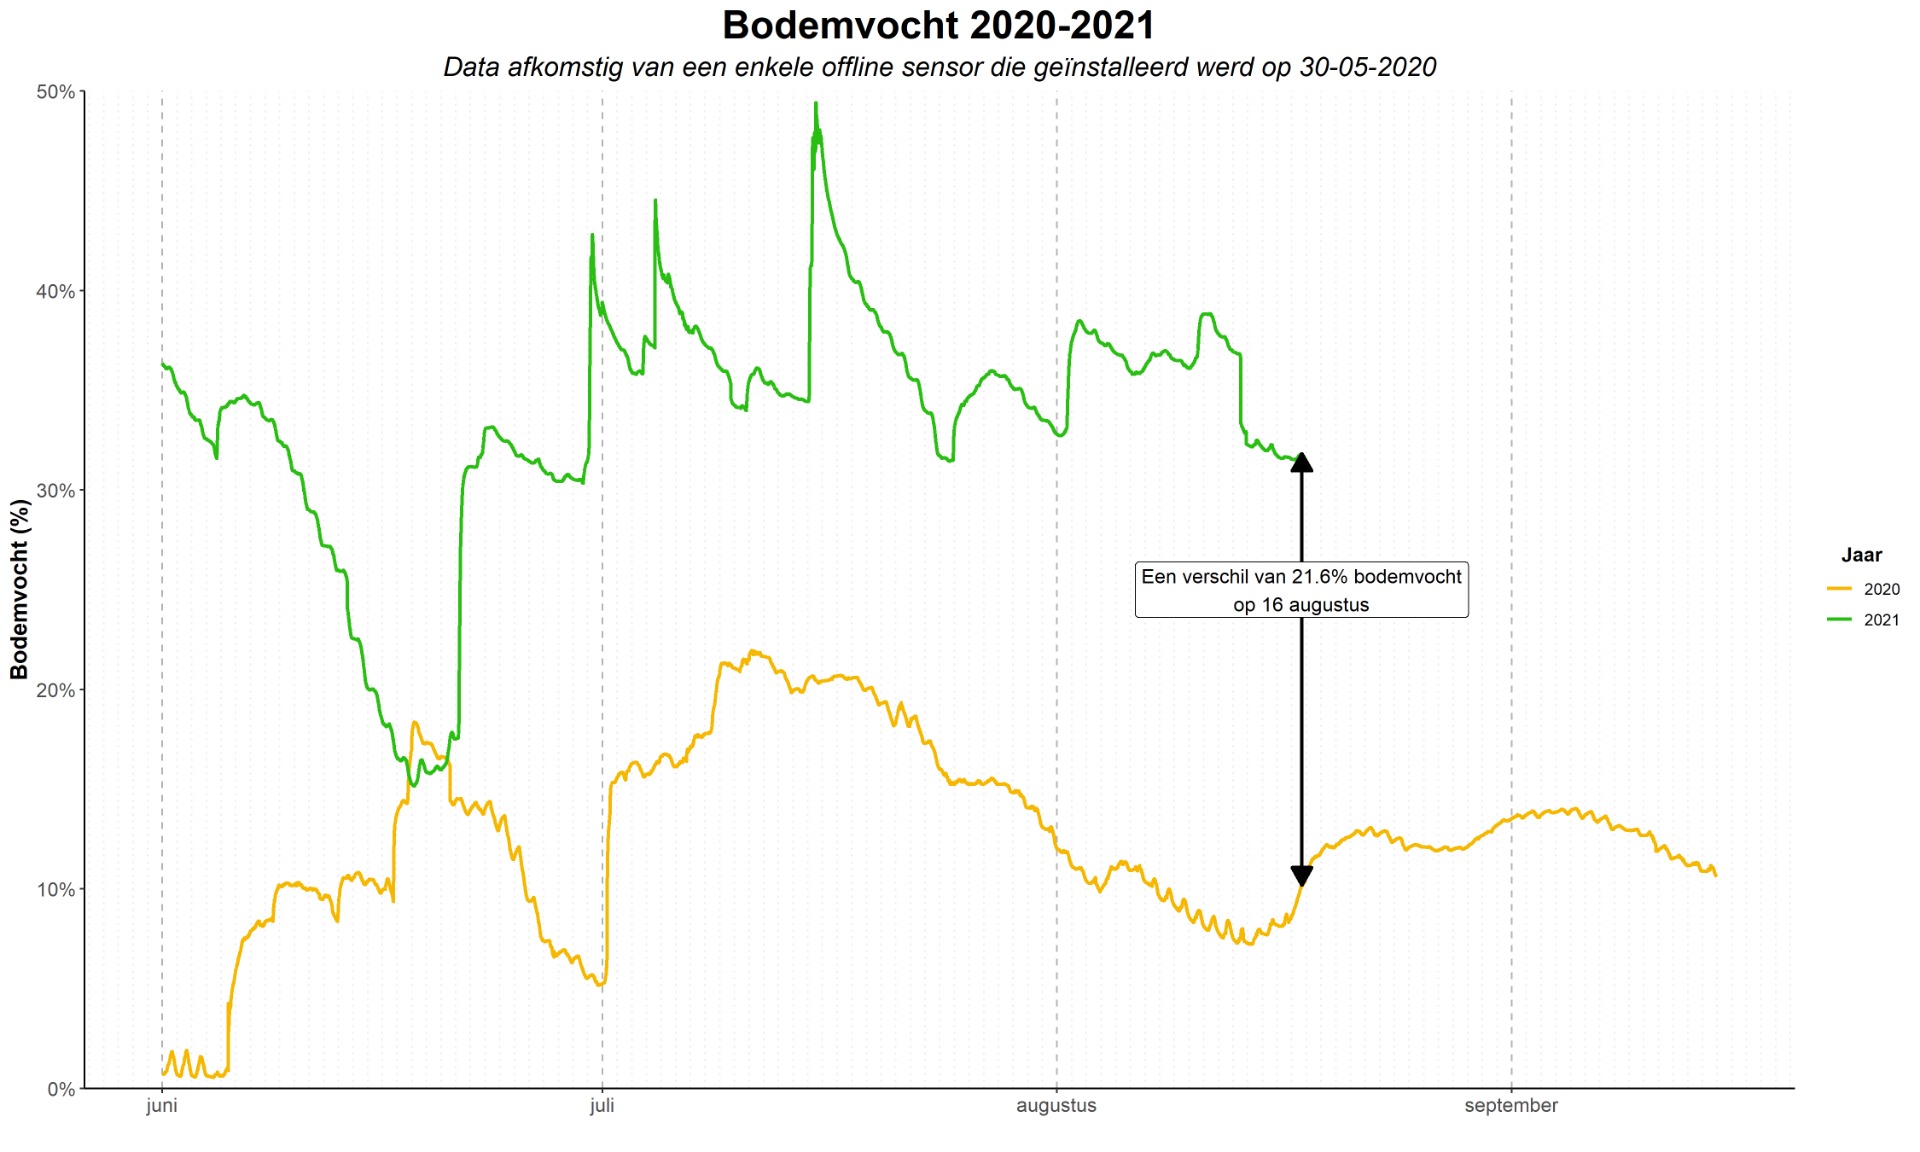
Why do we focus on potatoes? Not only because it’s the favourite crop of many Belgians. The potato plant is also highly susceptible to extreme weather. Most potato varieties cultivated in western Europe prefer air temperatures between 20-25°C and soil (root) temperatures between 15-20°C, while the soil is preferably moist but not too wet. On average, Flanders is blessed with these moderate weather conditions. However, periods of drought, heat waves, or excessive rainfall, can all impact the quality and quantity of the yield.
Thanks to the highly professional know-how throughout the entire chain, constant innovation and a detailed quality system to ensure excellent potato quality, the Belgian potato industry plays a significant role in the Belgian economy. Belgium is for example the largest exporter of processed frozen potato products in the world. Being able to anticipate and to respond to changing weather conditions in order to guarantee the availability of potatoes is therefore utmost important.

THE EFFECT ON THE CULTIVATION OF POTATOES

This summer the major threat for the potato cultivation was the combination of persistent high humidity and moderate temperatures, resulting in severe disease stress. Late blight, Phytophthora and Alternaria were widely observed. Erosion gullies and difficulties to access the field with heavy machinery were other problems farmers faced. However, regular precipitation and moderate temperatures result also in favourable growing conditions. After a cold start in the spring with initially low yield predictions, a period of rapid growth followed in June and July. As a result, the expected potato yields are still more or less at the level of the multi-year average, as shown by samples taken by FIWAP / Carah in Wallonia and Inagro / PCA in Flanders between 6 and 8 September 2021 for the storage varieties like Fontane and Challenger.

But high quantity doesn’t always mean good quality. On the contrary, the quality will be inferior on many fields this year. The large amount of precipitation, often in combination with the presence of a lot of nitrogen in the soil, caused an explosive growth of the tubers, resulting in growth cracks and hollowness, mainly with Fontane. Some Fontane plots even started to flower again indicating new leaf and tuber growth. This will result in immature tubers. Where the ridges were washed away by runoff we see lots of green tubers. Quality checks during storage will be extremely important to timely detect rotten tubers and avoid losing large quantities.

READY TO ANALYZE THE SENSOR DATA

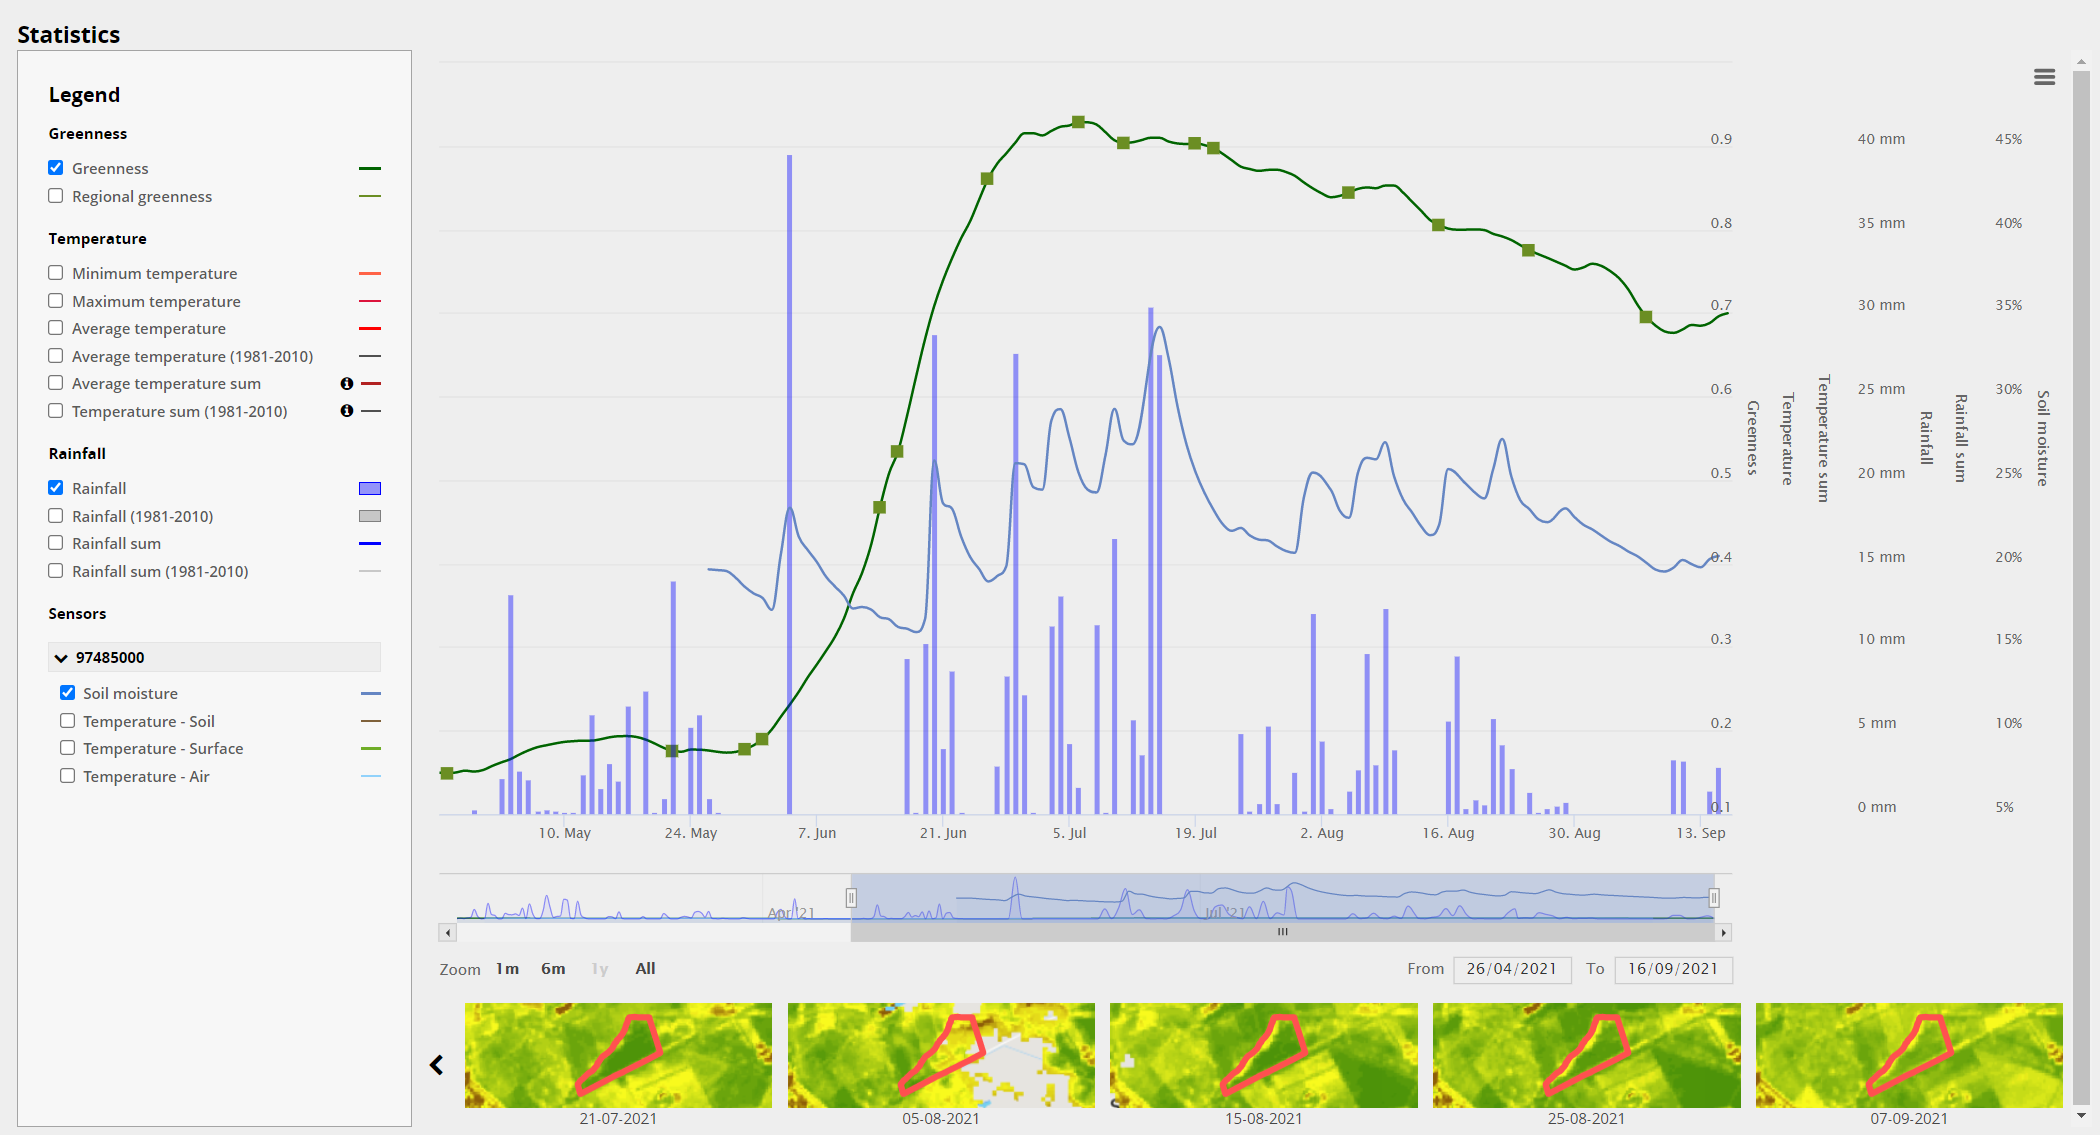
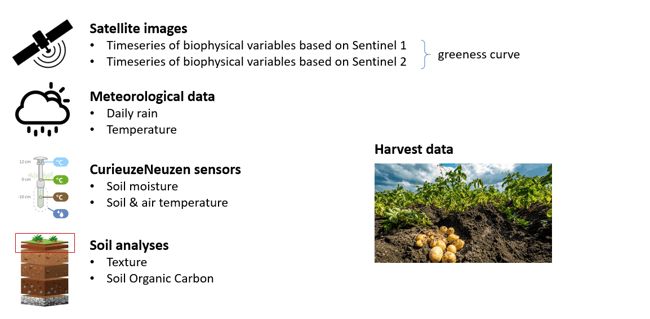
Unlike the measurements of the sensors in private gardens and public green spaces, which are collected and visualized in a personal dashboard, the measurements in the potato fields are stored in WatchITgrow, our online platform supporting growers to monitor their crops in view of increasing yields in a sustainable way. WatchITgrow allows combining remote sensing data with in-situ data using big data analytics and machine learning to provide growers with more timely and personalized advice.

Looking at the sensor measurements we already see that these low-cost devices were able to capture very precise and accurate measurements. Growers can easily access the soil moisture and soil temperature data, next to already available satellite images, greenness derived from Sentinel data, rainfall and temperature data.

Evolution of the greenness (fAPAR based on Sentinel 1 & 2 > CROPSAR technology) of a potato field in the North of Belgium, indicated in green. Daily amount of rainfall shown in blue bars, and the soil moisture as measured by the CurieuzeNeuzen sensors indicated with a blue line.

Once the harvest is over we will collect all sensors and start a detailed analysis of all measurements. Our remote sensing experts will combine all sensor data and link the soil sensor time series and soil properties measured in the field with:

  • meteorological observations
  • the greenness of the vegetation derived from satellite images
  • soil properties derived through soil sampling

Time series analyses of satellite derived greenness and soil sensor measurements will elucidate factors contributing to crop development and performance during the season. Machine learning methods will be applied to realize multivariate time series forecasting in aid of yield estimation.

115_Agro-CNIDT_FigANALYSES
The temperature and soil moisture data captured by the CurieuzeNeuzen sensors will be combined with satellite data, meteorological observations and soil analyses to assess crop performance and harvest.

This will yield insight in the crop development and crop quality during the extreme weather conditions we experienced. Although the prime objective of CurieuzeNeuzen was to measure the impact of heat and drought on the cultivation of potatoes, also the impact of extreme precipitation is very relevant as projected to occur more often in the future. First results of this analysis will be shared in December 2021. Stay tuned!

Posted in Belgium | Tagged , , , , , | Leave a comment

Another year of microclimate citizen science!

‘CurieuzeNeuzen in de Tuin’ (CNidT), the large-scale citizen science project on drought, heat and moisture in gardens is playing extensions. After a summer that was exceptionally wet, the project hopes to collect additional data on heat and drought. Find out all in the original story in De Standaard (here a shortened translation).

An ailing summer that never really got off the ground, with extreme flooding in large parts of Flanders in July. It was not the ideal setting for ‘the largest citizen survey on drought and heat ever’ in Flanders. Nevertheless, CuriousNoses in the Garden, a project by De Universiteit Antwerpen, De Standaard and many partners, was an unexpected success. We collected unique information on temperature differences between gardens, with data from cold freezing nights in April to insights into urban heat islands. The wettest summer in 200 years came as an unexpected godsend: the 5,000 sensors in garden soils give us a unique insight into the role of gardens as sponges during extreme rainfall, which will be reported in detail in October.

The one of a kind pluche ‘garden dagger’

Drier and wetter

But to live up to the baseline of research on heat and drought, more information is needed. The researchers at the University of Antwerp are curious about the interaction between drought and heat, want to find out how gardens work as air conditioners during heat waves and how long gardens retain water during drought. That’s why the citizen research with the ‘garden daggers’ is being extended for a year. There is a real chance that we will have a drier and hotter summer next year. In that case, the questions above can be answered, and we can compare data: how do gardens experience a warm day in a wet year versus a warm day in a dry year?

With climate change, scientists predict that we will get more of both: longer periods of drought and heat, interspersed with periods of heavy rainfall. This trend has already manifested itself in recent years. The extension of the citizen survey provides a unique opportunity to cover the whole picture and map the effects of both drought and flooding on a large scale and in fine detail. But even if 2022 has another ailing summer in store, it would provide relevant insights, for example about rain infiltration and groundwater.

1,000 candidates

The extension of the citizen survey provides a unique opportunity to map the effects of drought and flooding on a large scale and in a detailed manner.
To obtain this data, the researchers are looking for at least 1,000 participants who want to continue the climate survey in their garden.

Posted in Belgium | Tagged , , , , , , , | Leave a comment

ME&B conference in Antwerp

One of my dreams since the start of the SoilTemp project: bringing all microclimate enthusiasts together at their own dedicated conference…

Now, this dream will become a reality with #MEB2022, an international conference on Microclimate Ecology & Biogeography which we will host here at the University of Antwerp.

Today, we launched the website (www.meb2022.com) and abstract submission, hoping to attract up to 100 international experts to Antwerp.

Now crossing fingers on this exciting ride to March 28th, 2022.

Posted in Belgium | Tagged , , | Leave a comment

The TMS-Pluche

Consider development of microclimate sensors a closed and finished field: the ultimate product is now on the market!

Thanks to the partner of our colleague Stijn, I got the most beautiful pluche version of a TMS-version, which we immediately bombarded to the mascotte of our citizen science project.

Look what an absolute cutie!

The youngest microclimate ecologist here at home is in any case a big fan of the new ‘mushroom’, although she still really loves those funny ones with the blue blinking light that daddy distributes all through the garden.

Posted in General | Tagged , , , , , , | 1 Comment

Nights with a baby: is it all about perception?

EDIT: baby 2 wants me to publicly apologies as I made a mistake in the calculations with her data (for the R-people, as.POSIXct got me). Post now updated!

This summer, we doubled the sample size of our offspring experiment. We now have a sample size of n=2, so data analyses are really gearing up now!

The two test subjects interacting

First up, that crucial question: how are the nights? Are you getting some sleep? And most importantly, is baby 2 giving you a harder time than baby 1?

I’ll tell you our hypothesis first: we are feeling much better. Baby 2 seems to be giving us much more solid blocks of sleep than baby 1 did. We have vague memories of these first weeks with the first one, where we were bouncing a child through the living room in the middle of the night, trying in vain to get her screams to stop.

Baby 2 also has some issues (reflux is a bitch, I’ll tell you), but overall crying feels much lower, and sleep patterns more consistent. But does the data agree with our analysis? Let’s dive in!

Proxy of how much sleep we have been getting at night over time, using the hours between the two main night feedings (evening and early morning). Data for two different babies relative to their respective birth date. Note that we started tracking much earlier for baby 2, yet that she is obviously much younger at the moment.

After a first erroneous analysis which seemed to prove our hypothesis wrong, we can now proudly say that baby 2 indeed seems more parent-friendly! With things rapidly improving during the first few weeks (note that we were too flabbergasted to track those with baby 1), baby 2s performance has at first been more than an hour and now still on average more than 15 minutes above the one from baby 1.

Of course there is more to the night than the time between the two main feedings. While baby 1 always had a lot of trouble in the morning (so after that nightly feed), baby 2 also seems to be struggling through these hours a lot more independently. As a result, I now often find myself in bed at 6h30 in the morning, a rare sight with baby 1! So yes, life with baby 2 is a lot more livable than it was with baby 1.

Life with 2 is in any case much better than with 1!

Posted in Belgium | Tagged , , , | 3 Comments

A story of collective responsibility

The wettest summer in two centuries is an unexpected windfall for our citizen science project ‘CurieuzeNeuzen in de Tuin’ (CNidT). Our garden sensors fill a black hole in our knowledge: how can gardens act like sponges and buffer extreme rainfall?

Check out the original article from De Standaard, in Dutch, by Ine Renson!

Every liter of water sucked up by a garden results in less inconvenience during extreme rainfall. Copyright Dieter Telemans for De Standaard

An unexpectedly wet spring, which cumulated in the extreme precipitation of mid-July with a hopeless string of crappy days in August: for a large-scale citizen science project on heat and drought in gardens and parks, it seems like a worst-case scenario. But the climate researchers of the University of Antwerp who are responsible for the project show no sign of panic. On the contrary.

‘This is better than we could dream of,’ says Jonas Lembrechts, who is the scientific coordinator of the project. ‘With CNidT we are investigating how gardens can arm themselves against extreme weather conditions. Given the trend of recent summers, the focus was on heat and drought. But our soil sensor, which records moisture and temperature, can tell us as much about wet and cold. Because of this summer’s exceptional situation, we are therefore happily switching the focus to extreme precipitation. It’s just the other side of the same coin.

For scientists, this is a golden opportunity. This is the wettest summer in two centuries, and just now we have 5,000 sensors in the soil all over Flanders. We were unexpectedly handed a unique dataset,’ says Lembrechts. ‘With unprecedented accuracy, we can map out how our gardens are able to accommodate large amounts of precipitation.’

“Snertzomer”

Just how extreme this summer was can be seen from the graphs drawn by Stijn Van de Vondel. As a test case, the researcher had already installed a TOMST TMS-sensor in his Kempish garden last summer. This allows us to visually compare the wettest and one of the driest summers of the past century. ‘Except for a few June days, this summer was much wetter than the previous one,’ he says. According to the data from the Royal Meteorological Institute (RMI), June and July had exactly the same number of rainy days as the previous year. But when it did rain, a lot more fell from the sky. This is also evident from my soil sensor: the humidity level at the end of June shot up to 30 percent and has not dropped below that since, with peaks in July between 40 and 50 percent. Imagine a sandbox with half sand and half water in it: that’s a mud puddle. We were at the limit of what a soil can swallow in July.’

Soil temperature in a Flemish garden in 2020 (red) and 2021 (blue)

But contrary to popular belief, this summer was no cooler than the last. The temperature curves of 2020 and 2021 above are playing leapfrog. This pattern is also confirmed by the figures from the RMI. ‘Because of the rain, we have the idea that it is a thoroughly crappy summer,’ says Van de Vondel. But as far as the temperature is concerned, that’s not true: this drizzly summer was not colder than average. That too is relevant in the light of climate change: we won’t get really cold summers very often anymore.’

Pavement

Concerning that extreme wetness, CNidT brings fascinating insights. ‘The RMI data tell us where exactly how much precipitation has fallen,’ says Van de Vondel. ‘The Vlaamse Milieumaatschappij has accurate data on groundwater levels. But there is a blind spot in between: how much of the precipitation that has fallen is actually stored in the soil and transported to the deeper layers of the ground, e.g. via our gardens? And what proportion flows away via sewers, canals and rivers?’

Copyright Dieter Telemans for De Standaard

For the first time, we are going to be able to fill in the missing link in detail and on a large scale,’ nods Lembrechts. We can indicate which gardens store a lot of water and which do not. And, importantly, why. Because there are often large differences between two gardens in the same municipality. Insights into these dynamics is essential if we are to pursue a good water policy.

From previous ecological research we know that the same factors that protect our lawns from extreme drought are also decisive in the fight against flooding. One hypothesis is that the degree of hardening in a garden or its surroundings plays a crucial role. ‘The degree of paving seems essential to determine how much a garden can buffer, and thus to what extent you can avoid the risk of flooding,’ says Lembrechts. ‘It determines how hard a garden has to work to handle the falling water. For example, in a highly sealed region with small gardens, each garden will have to swallow more. We’re trying to put that into numbers now.’

Whereas in Wallonia it was mainly the topography that determined the consequences of the flooding (extreme precipitation running down the slopes and converging at the lowest point in the valley), in Flanders it is mainly the large and spread-out paved surfaces that are the Achilles’ heel, in addition to the fact that we continue to build in flood plains.

But vegetation also explains how well a garden can buffer water. Lembrechts: ‘Rain sticks to the leaves of trees and plants, it always takes a while for the drops to fall through. This causes a delay in the peak of the water flow, which can make a crucial difference during a cloudburst. Trees and plants therefore form an initial buffer. Moreover, through their roots they suck some of the water out of the soil, and evaporate it through their leaves.’

4,100 Olympic swimming pools

De-watering, greening: the measures to be taken against drought and heat will also protect us against the consequences of extreme precipitation. Next month, the researchers hope to come up with accurate figures and insights into the sponge effect of our green spaces. ‘But already it is clear how important they are as a lever in the fight against climate change,’ says Van de Vondel. ‘During the mid-July flood, the garden complex, along with the parks and natural areas, buffered 4,100 Olympic-sized swimming pools of water, according to an initial estimate. That’s huge. That volume would otherwise have run off and put extra pressure on our sewers and roads. Every gallon of water sucked up by a garden results in less inconvenience during extreme rain events.’

Soil moisture in a Flemish garden in 2020 (orange) and 2021 (green)

The defense against the consequences of severe weather or rising sea levels is therefore not only in ‘gray infrastructure’ such as dikes, dams and sewers, but increasingly also in ‘green infrastructure’ such as gardens, wetlands, wadis and flood plains. The realization is dawning that we no longer need to defend ourselves against water, but that we must learn to live with water and the opportunities it offers. The data from CuriousNoses provides insight into how we can do that more efficiently.

This is actually a story of collective responsibility’, says Lembrechts. The question is not so much which Flemish garden functions best as a sponge or air-conditioning system, but how we can use the garden complex as a whole to optimally store water or cool cities. Some gardens buffer more than others, but each contributes its own bit. We don’t always realize it, nor do you see it from the street. But together we have a big impact. If we were to pave over our gardens and green spaces en masse, the news would be even more dramatic in the next extreme rain event. If we do the opposite, we can mitigate its impact. The decisions you make in your garden thus make a huge difference in economic and ecological cost, and most importantly in the human suffering involved.

Posted in Belgium | Tagged , , , , , , | Leave a comment