
Even if you followed this webspace only occasionally, you should have gotten the idea of the fact that we are starting to get a good hold of microclimate across the globe. We know how much European forest understories differ from weather station temperatures, for example, or how much soils across the globe buffer temperature.
A very big black box, however, is how these microclimates will change in the future. When the climate warms, will forests buffer temperature more, or less? We now did a little first peek into that black box, in a paper just published in the STOTEN journal.
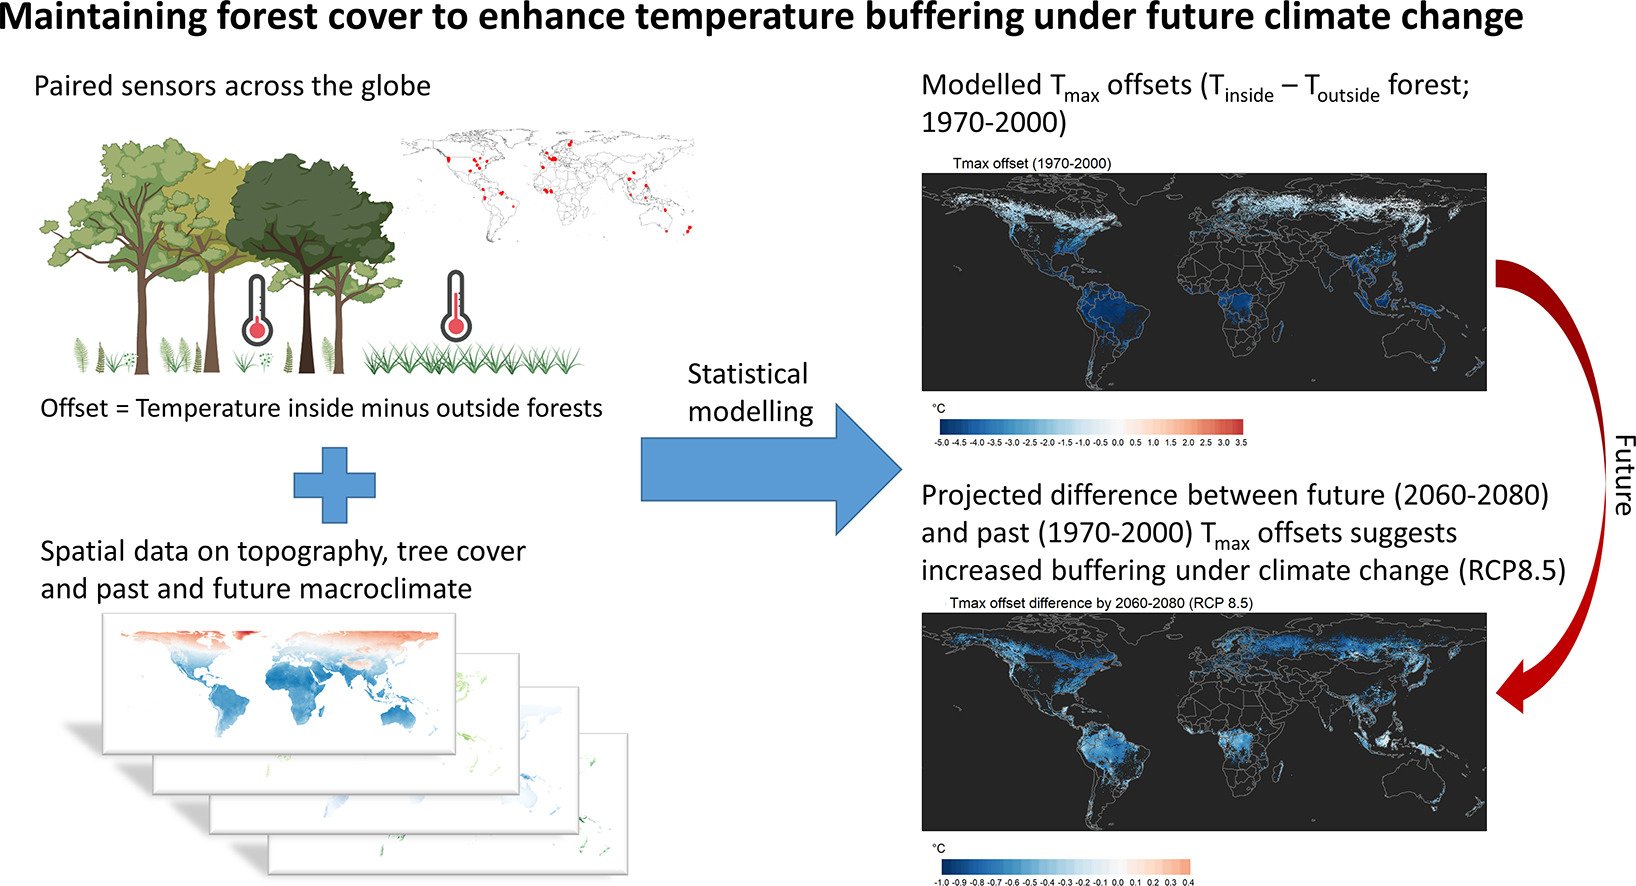
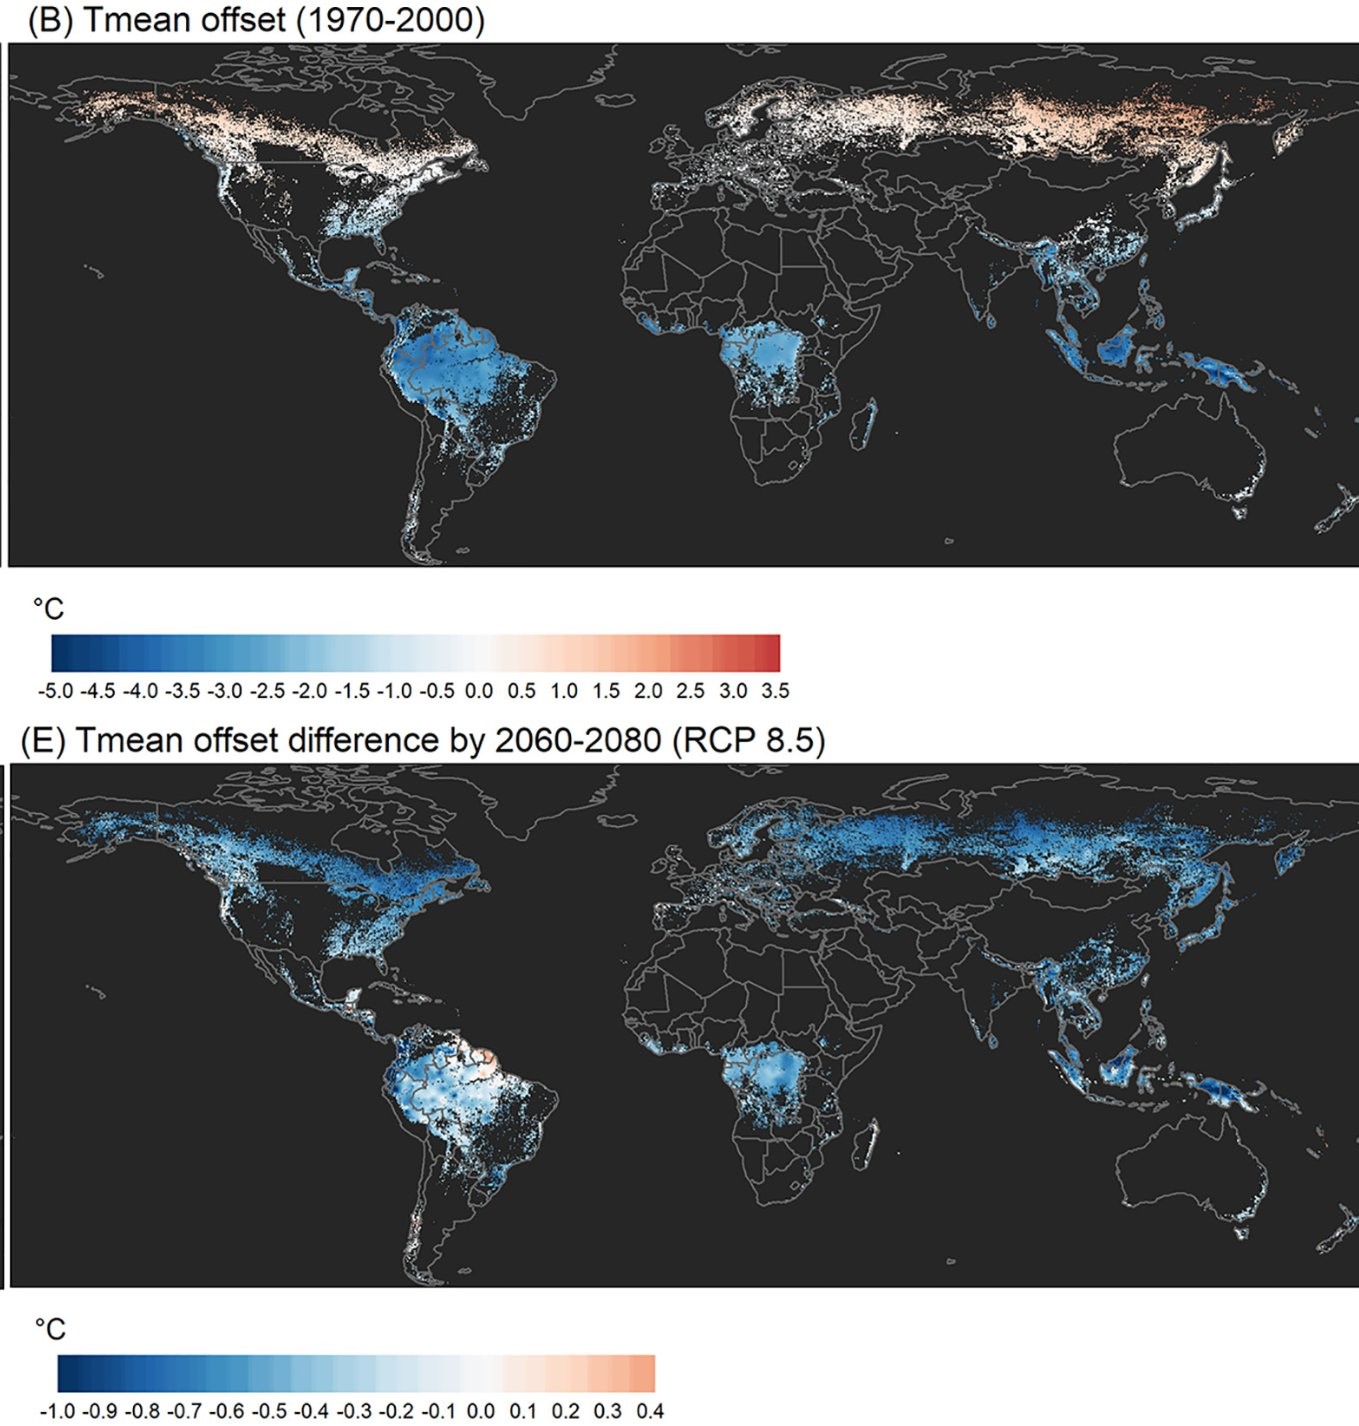
The result of the exercise as described above was pretty impressive: we project that temperatures within forests will warm slower by 0.3-0.6°C than outside forests by 2060-2080
To get to these results, we used a (freely available) global database of 714 paired temperature time series inside forests vs. in nearby open habitats. We then used past and future climate data, topography and forest cover, and height to model past and project future offsets between free-air temperature and sub-canopy microclimates.
Our projections have important implications for instance for forest management and the potential cooling of urban green areas and urban heat islands, as this suggests that forest microclimates will warm at a slower rate than open areas.
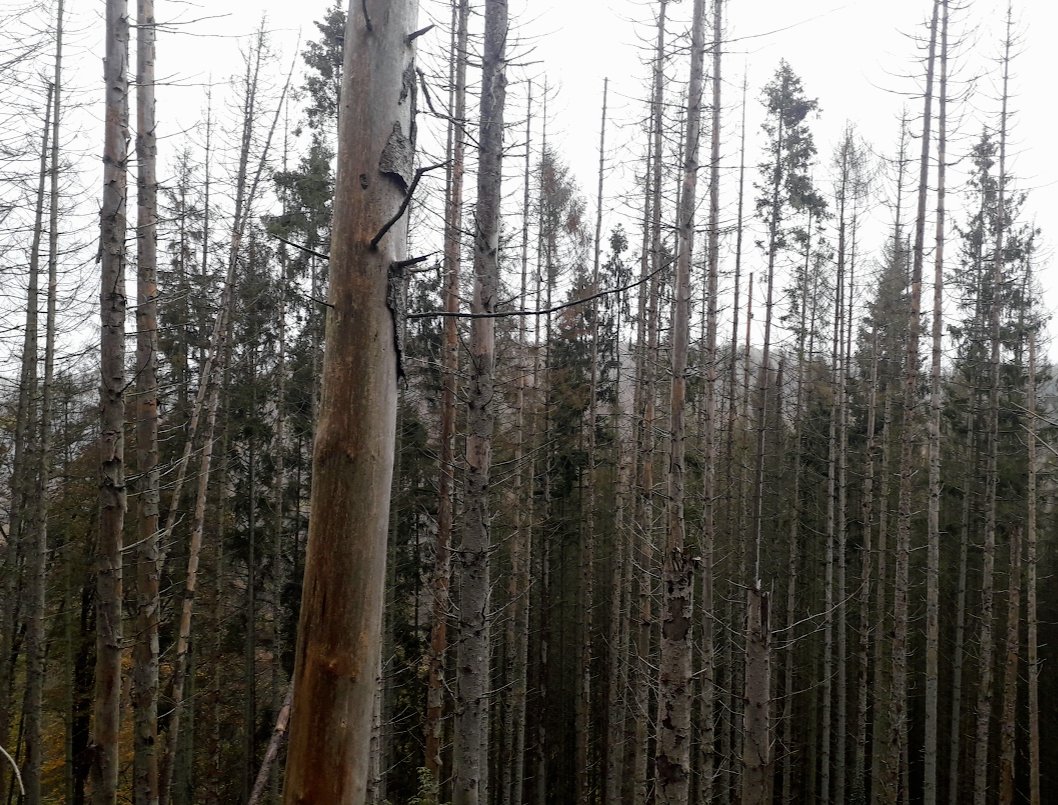
Important to note, however, is that we had to assume – for now – that forest cover remains the same over time. If large tree mortality would occur (as is already happening in many parts of the globe, among others due to climate change and drought), the buffering capacity of forests will decrease.
What happens to the microclimate in past and future if we take these land-use changes into account, that’s food for future research. But I promise you, we are not letting this rest, as getting the correct predictions of microclimate change are too important to ignore.


")


")
")


")


")


")


")


")


