
Now here is a little – and rather easy perhaps for most of those who follow me – botanical riddle: which tree has photobombed virtually all of my holiday pictures of Kotor, Montenegro?
Let me know in the comments if you know!

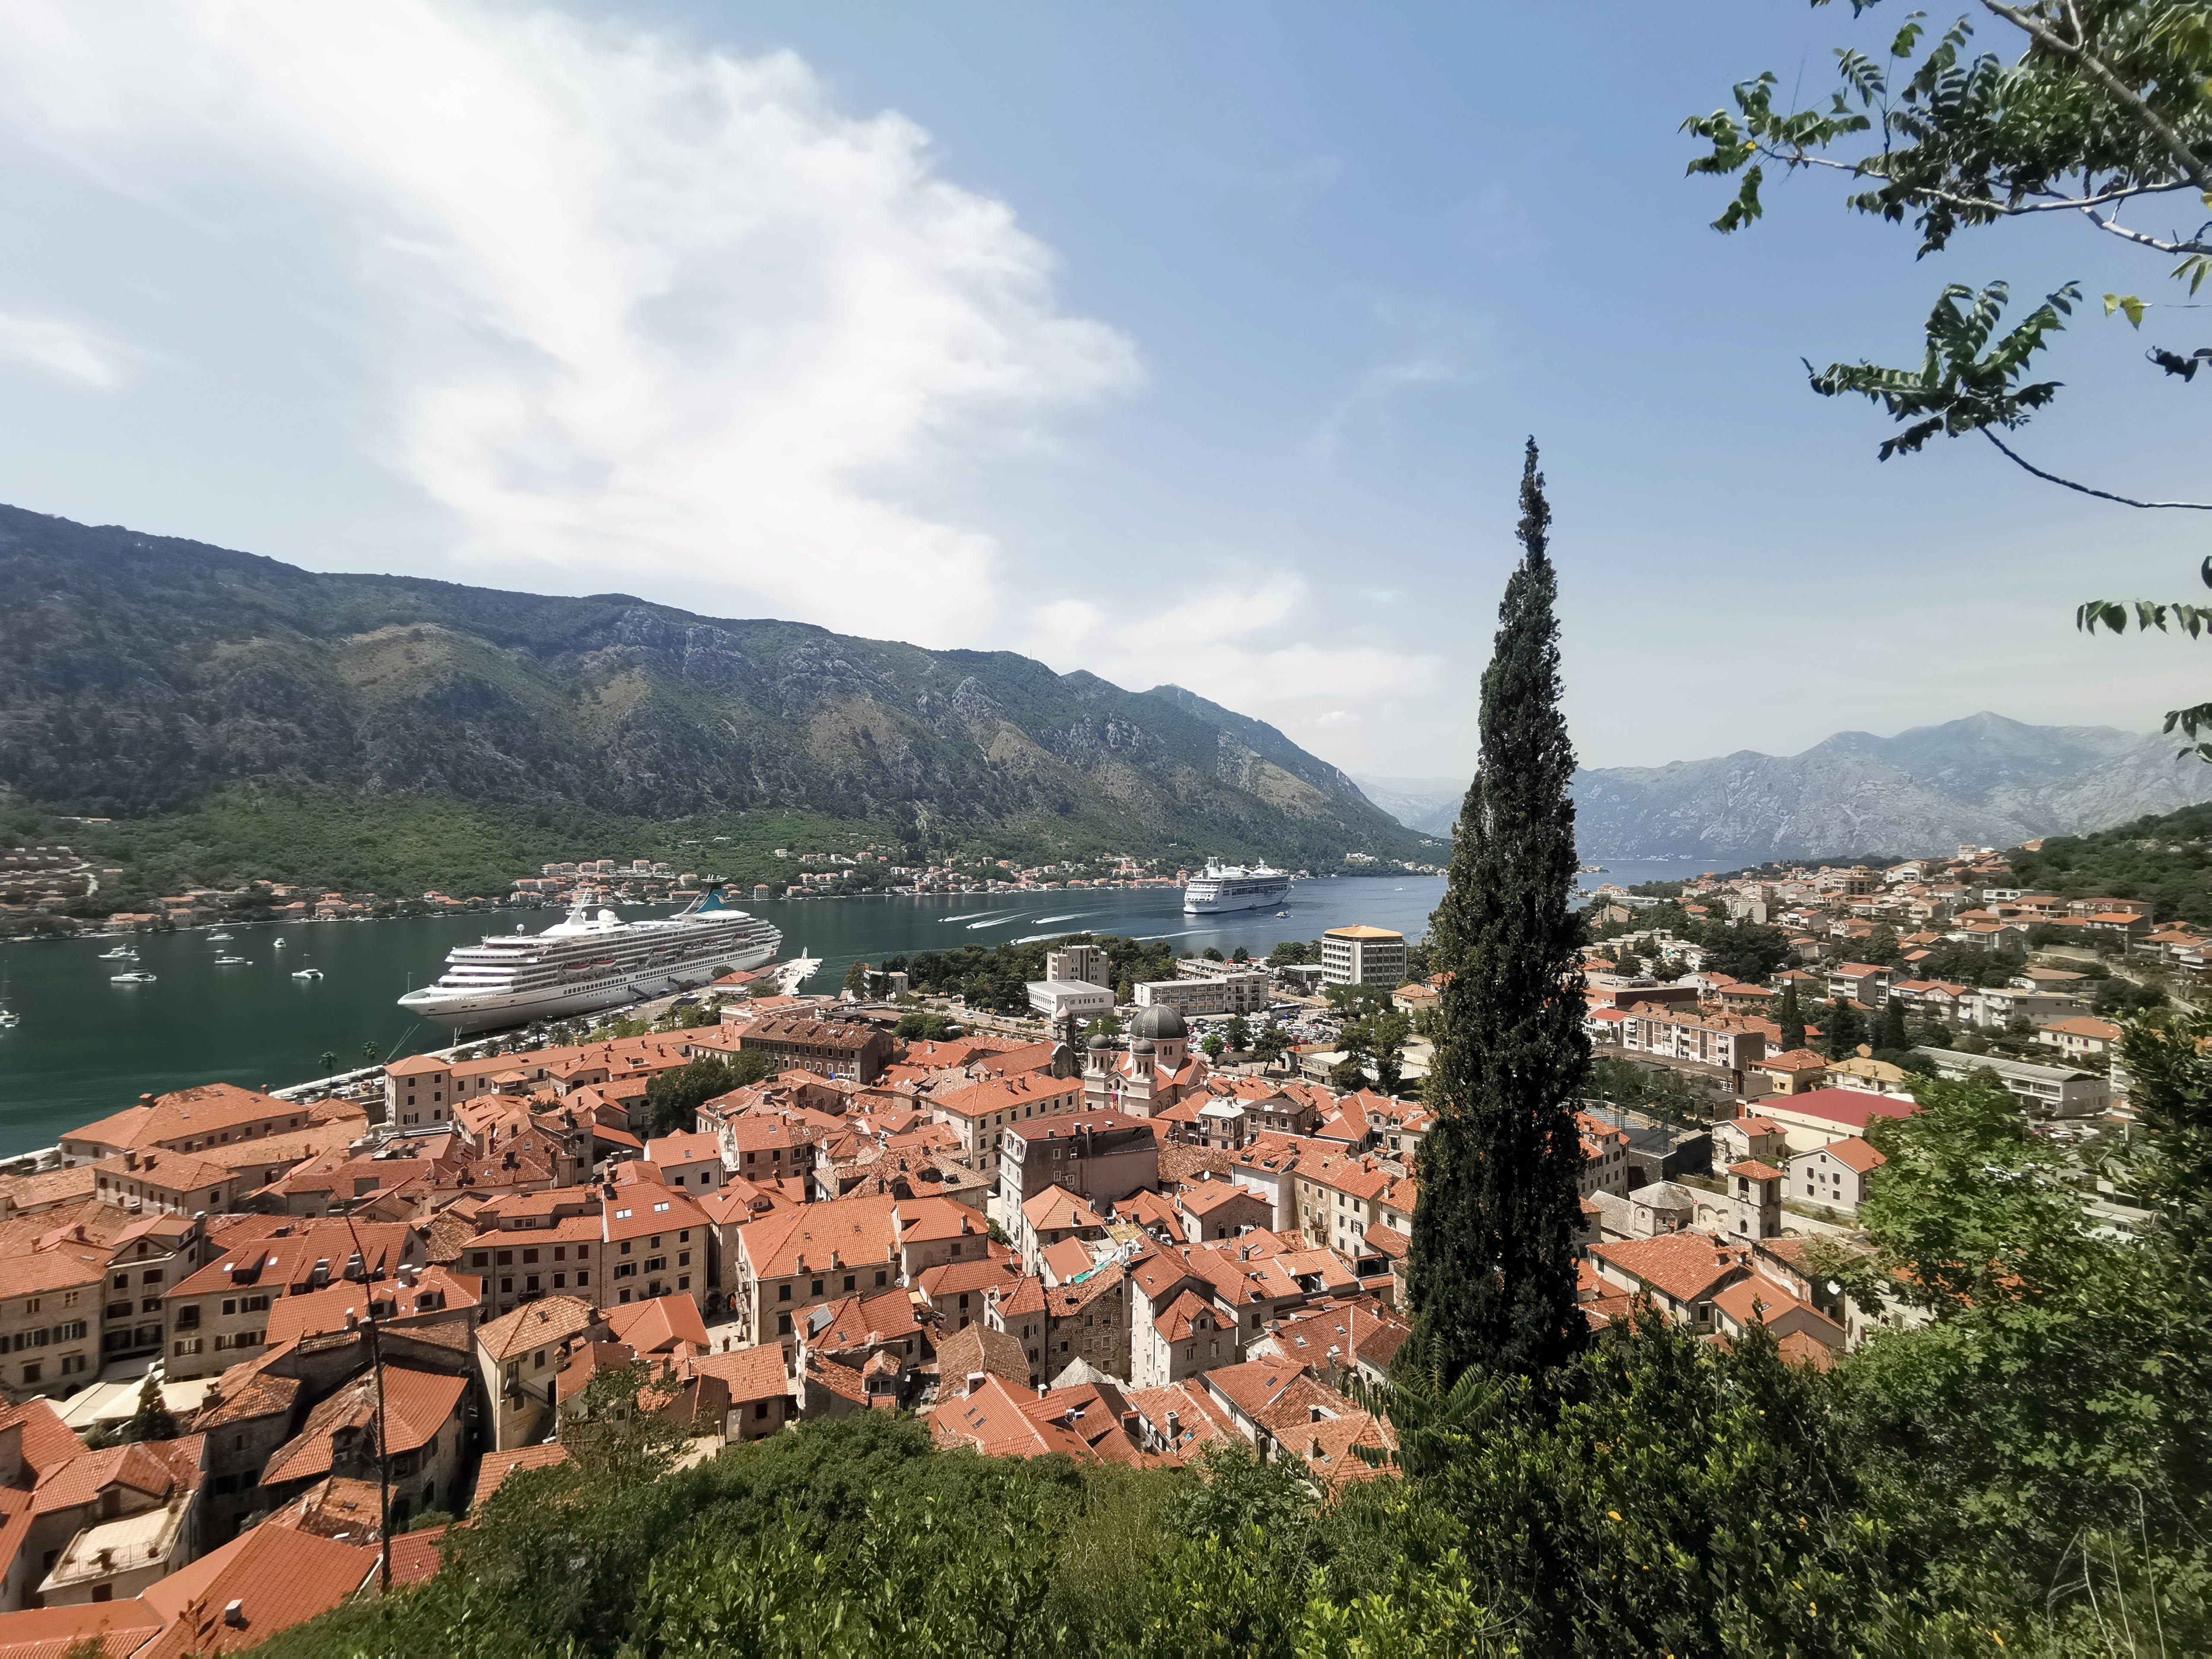
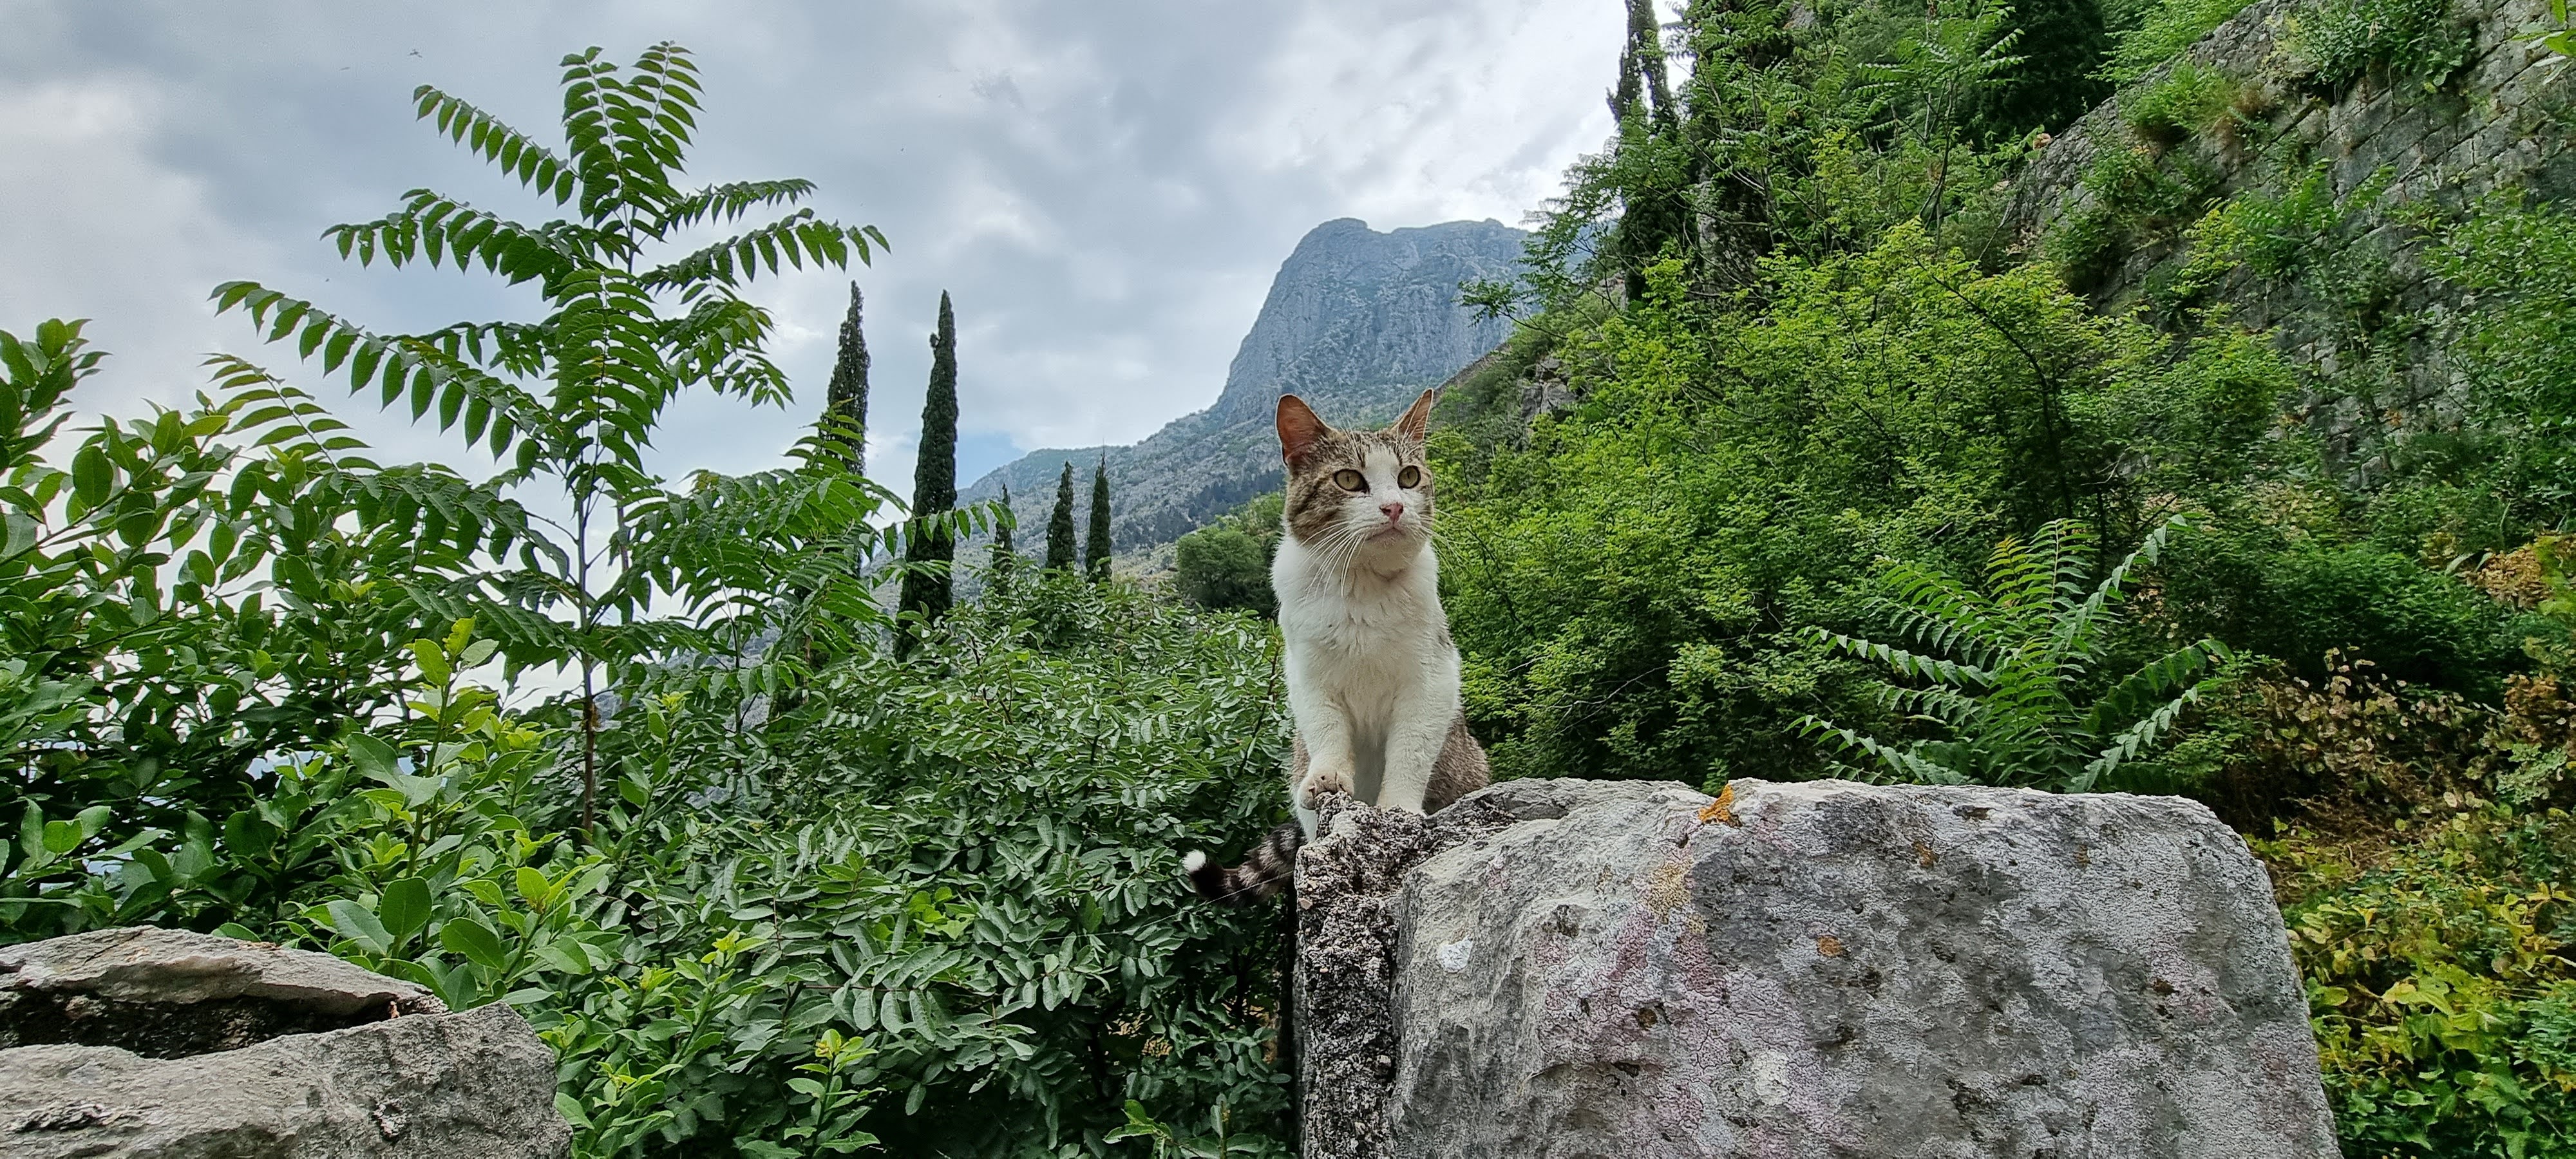
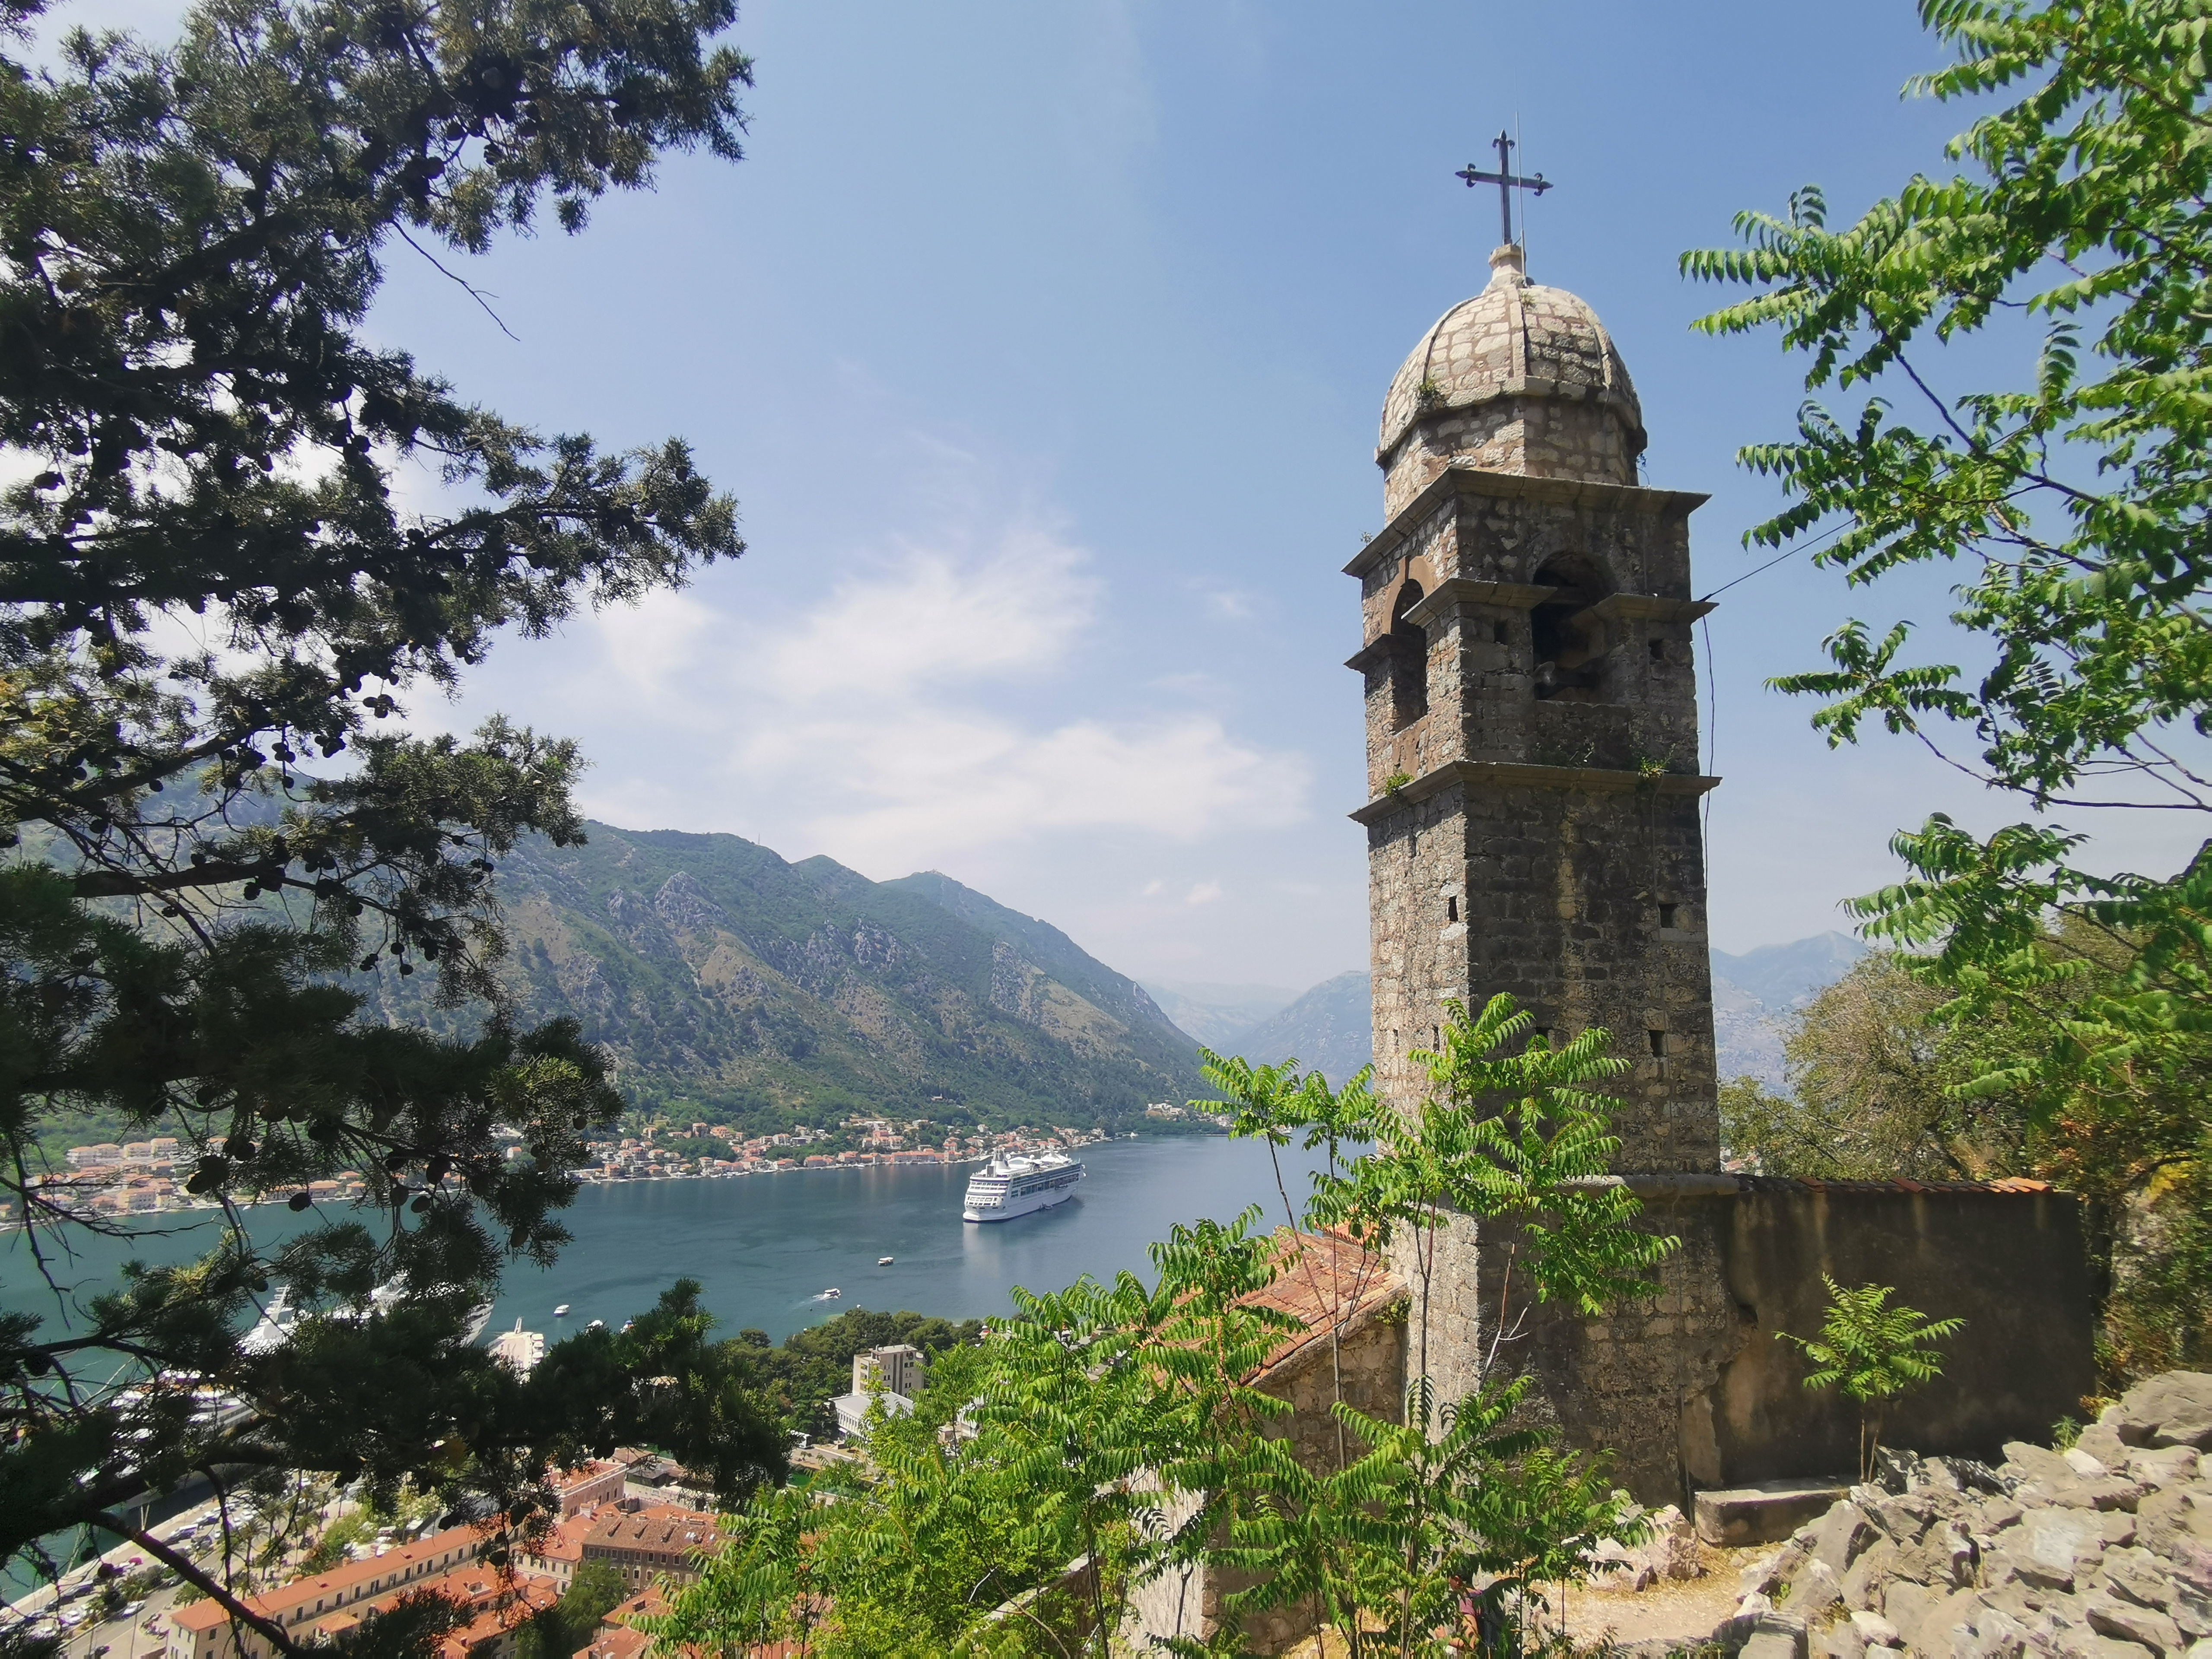
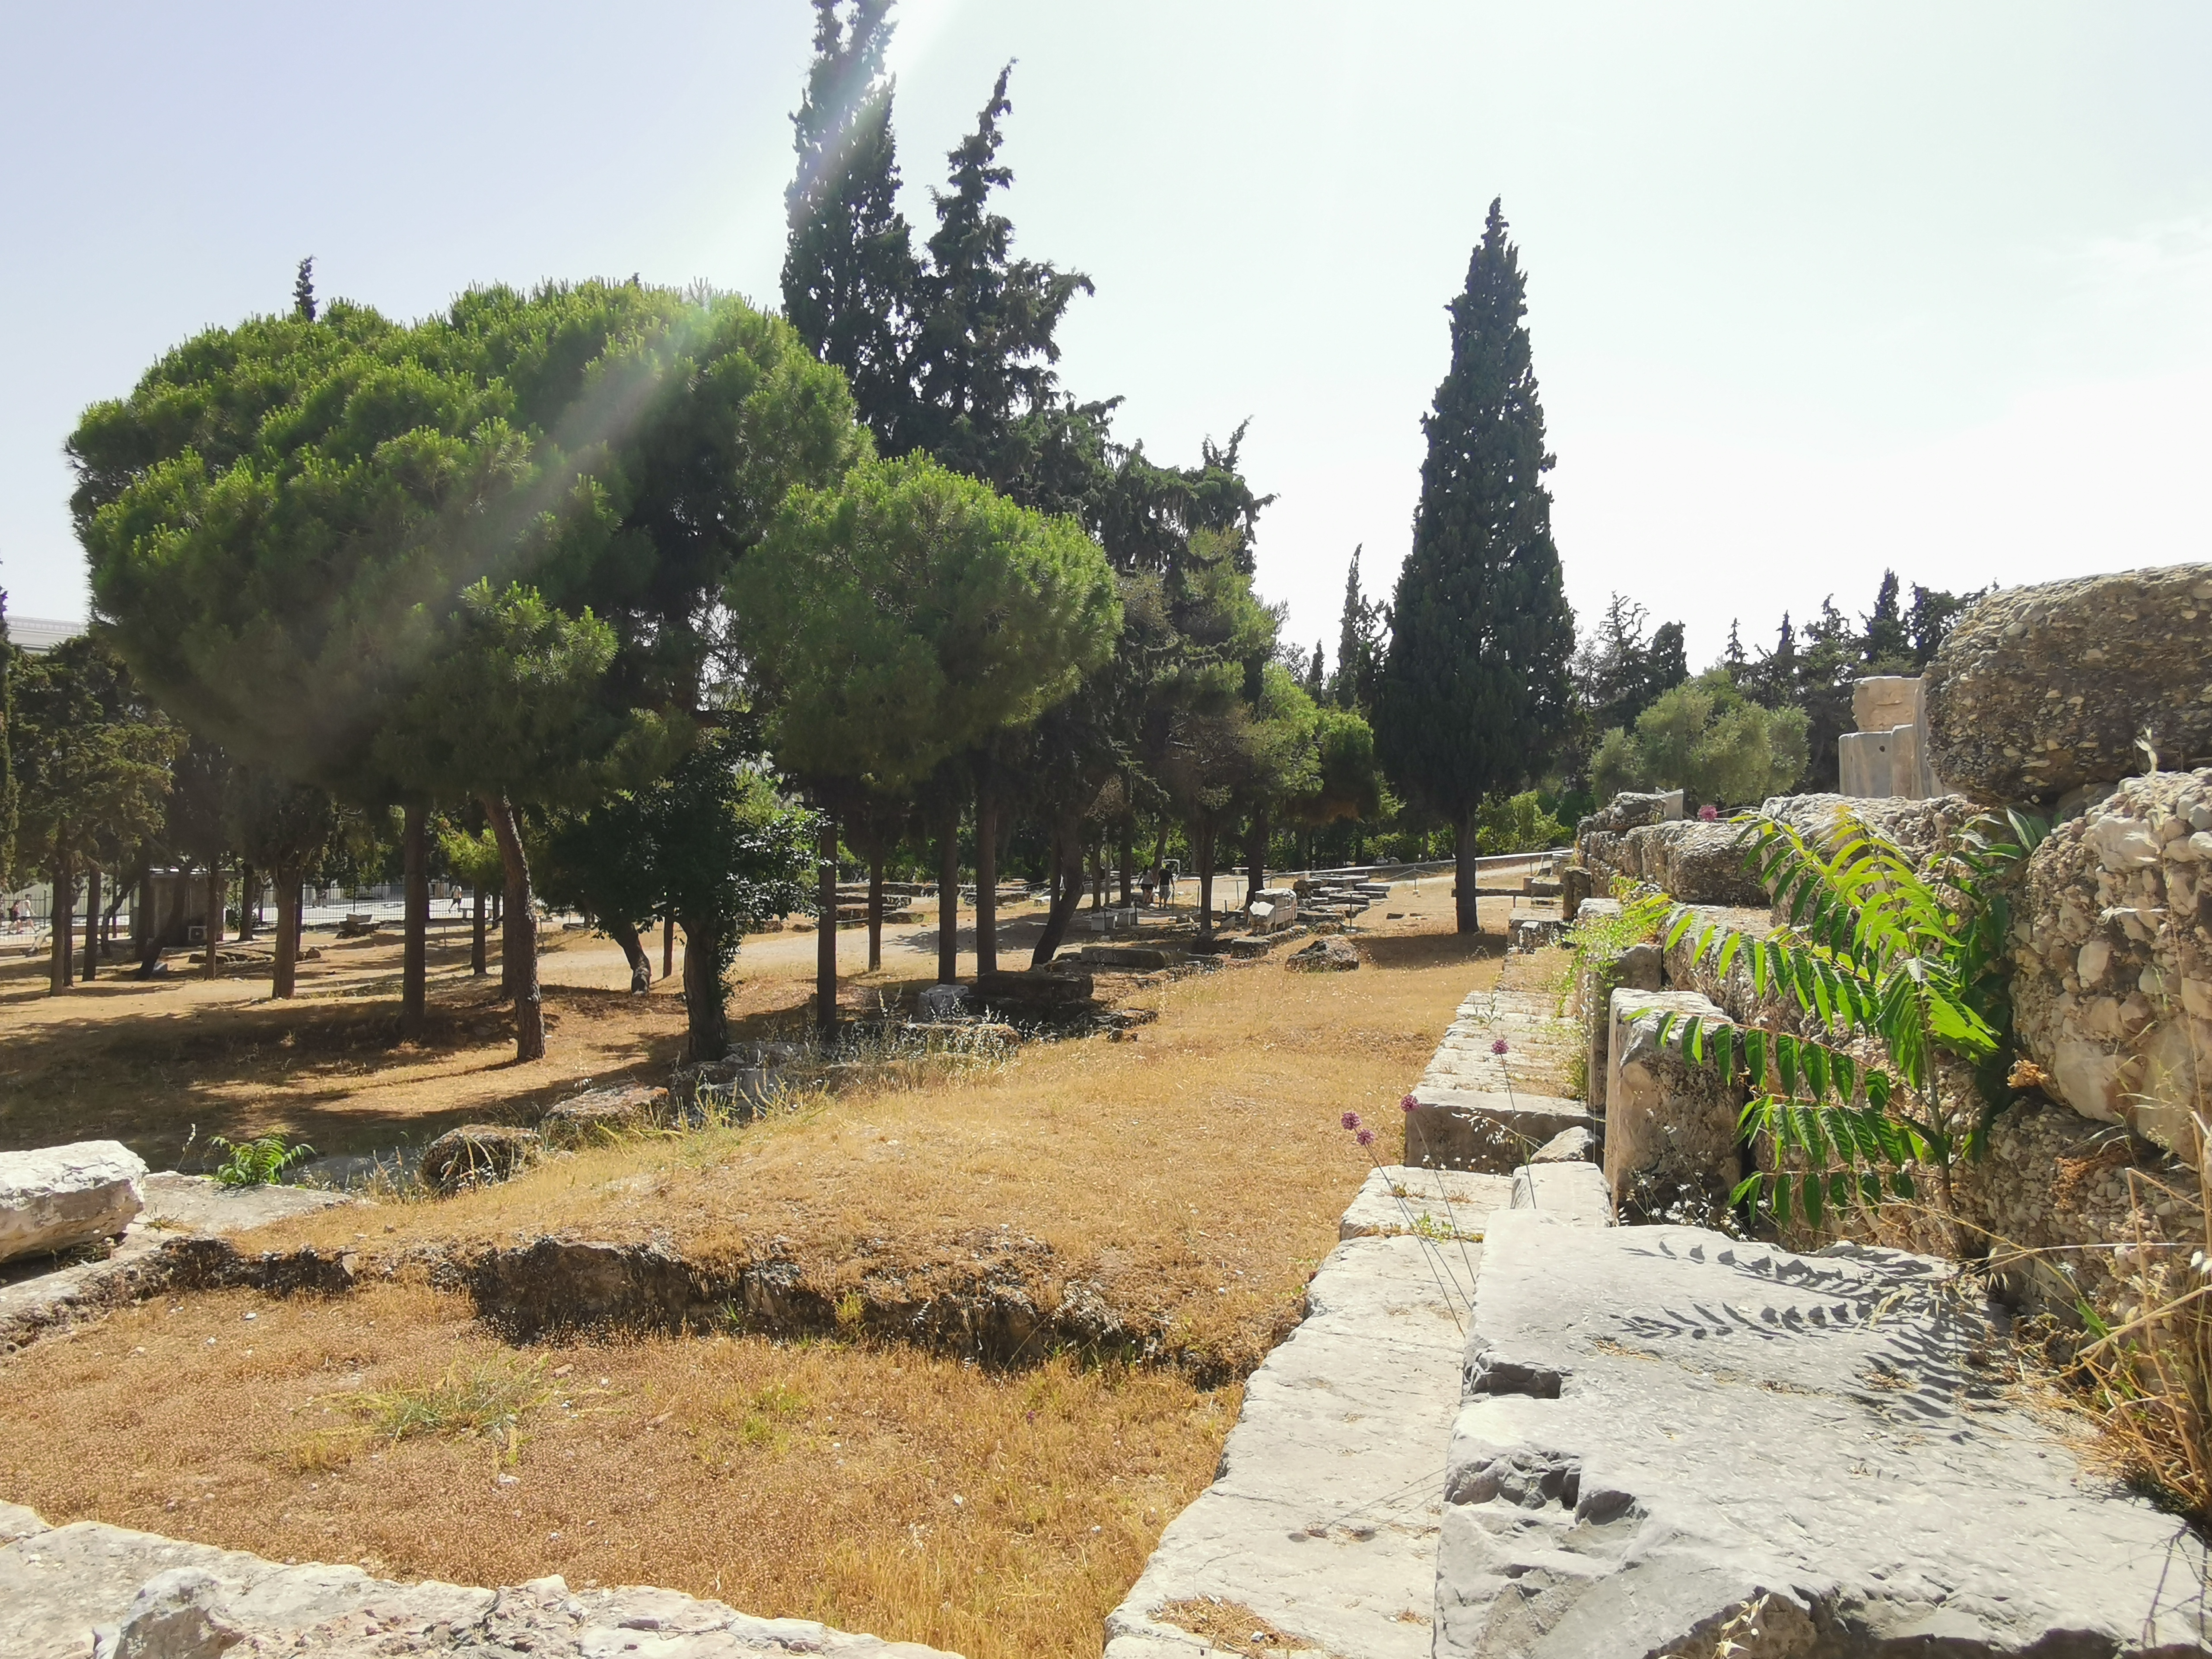
Now here is a little – and rather easy perhaps for most of those who follow me – botanical riddle: which tree has photobombed virtually all of my holiday pictures of Kotor, Montenegro?
Let me know in the comments if you know!
I am currently co-teaching the course on ‘environmental biophysics’ to our ecology masters, a largely theoretical course in which students get to know the physical equations behind ecology and the interaction between organisms and their environment. Besides this formula-juggling, the course contains a very nice little practicum which I inherited from my predecessors, which I wanted to share.
The goal is to calculate the full energy balance of a leaf: what kinds of energy are coming in, and which ones are going out again? Then, we go on an ‘excursion’ two meters out of the classroom door, take some real leaves and try to measure the necessary parameters to calculate that energy balance in real life.

This involves a lot of environmental measurements: students measure air temperature, soil temperature, temperatures of the sky, short-wave radiation, wind speed and relative humidity, all these parameters who define the environment of a leaf and thus how it will regulate its energy.
Then of course, pretty important, they also measure the temperature of the surface of the leaf, which in itself relates to all these parameters but also to how well the leaf can regulate its temperatures. That temperature regulation works through two processes: energy loss through transpiration (water loss), and heat loss related to differences in temperature between leaf and environment.

To get a good grip on those different parameters and how easy energy can be exchanged between a leaf and its environment (the so-called conductance of the leaf and its boundary layer), we did a little experiment: next to a control leaf, we had one leaf that we sprayed entirely wet. This situation greatly facilitates the transpiration of water, as now the air-water boundary is not inside the leave (forcing water vapour to go through the small stomata), yet on the outside of the leaf. The result? Significant multi-degree drop of temperature far below air temperature even (we had examples of air temperature at 23°C, and watered leaf temperature at 16°C!).
Additionally, we sprayed one leaf with ‘wilt-pruf’, a resin-based liquid that seals the stomata and thus effectively prevents any water loss. It’s traditionally used in horticulture when you want to prevent a vulnerable plant from loosing water, but here it served another purpose: sealing the stomata removes the transpiration process from the equation entirely. The result now? Take a second to think it through…

Indeed, the leaf should start heating up, as it can’t loose energy through water loss anymore! This turned out to be hard to replicate in the field, as it is strongly dependent on weather conditions, wind speed and the question if stomata were open in the first place. Nevertheless, we managed to heat up a leaf 1°C as compared to the control this way!

So what’s the take home message of all of this? To me, it is that, indeed, you can describe the living world with mathematical equations. Nevertheless, the real world gets rapidly too complex to keep track of the formulas in it, which is why ecology so often works by proxy (and so often has strong noise in the data). An important piece of fundamental knowledge for aspiring ecologists, I would say!
Have you ever noticed that trees seem to green up earlier in cities than in the countryside? If yes, it is not just a feeling. Urban areas have higher temperatures earlier during the spring. Moreover, it is already known that plants have the tendency to leaf out and bloom earlier in cities.
The phenology of plants refers to the timing of events important in the life cycle of plants such as the bud bursting, leaf development, or the opening of flowers. Phenological studies aim to better understand how the timing of such events is influenced by variations in environmental conditions. However, phenological studies in urban environments usually rely on measurements of temperature and soil moisture at regional scales.
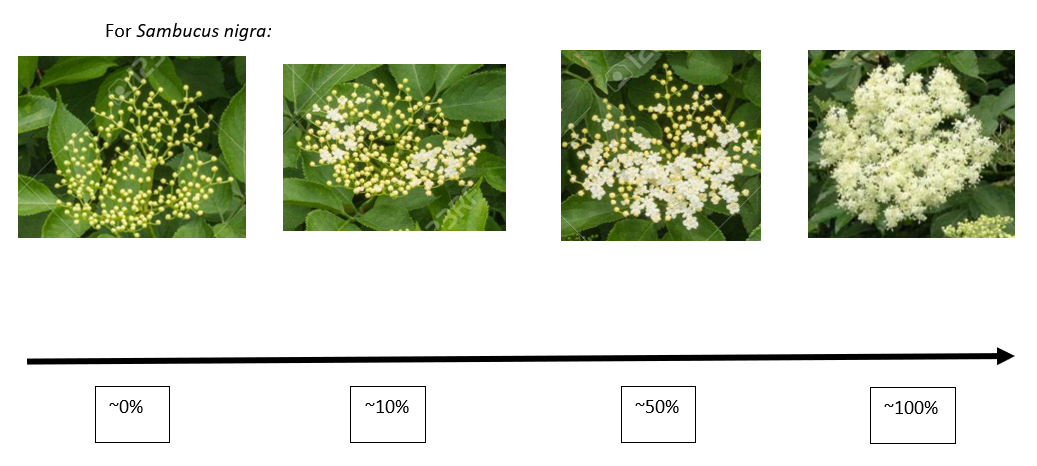
That’s a big limitation, but we realized that we were having a unique opportunity at hand: we could benefit from the incredible level of precision of the data acquired by the thousands of participants in the ‘CurieuzeNeuzen in de Tuin‘ citizen science project in Flanders and let them track phenology in their garden. This way, we can link the precise temperature and soil moisture data provided by the 3000 mini weather stations spread throughout Flanders to the exact timing of flowering of plants close to them.

The set-up is simple: participants with a mini weather station ánd an elderberry (Sambucus nigra) or butterfly bush (Buddleja davidii) in their garden are asked to report on the unfolding of the flowers of these shrubs every three days, until they are fully in bloom. This data on flowering time will then be linked to the actual temperatures in their garden.
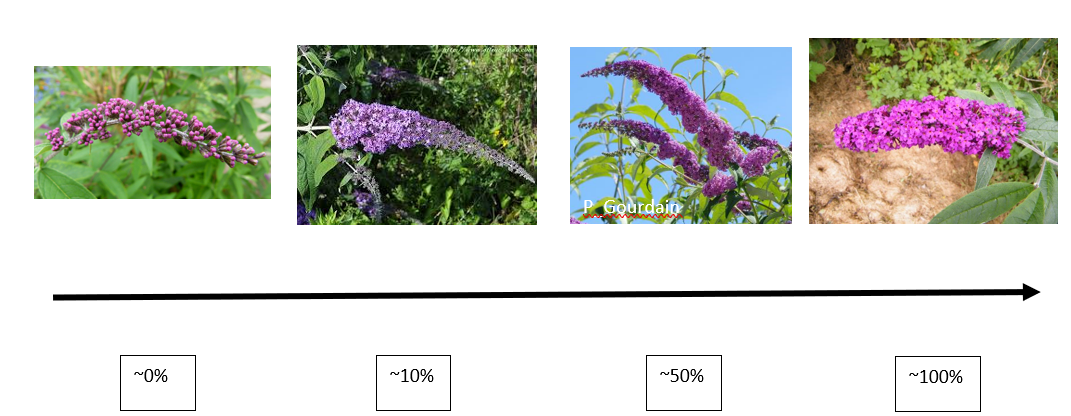
What we hope to find? For example, we want to determine at what degree the temperature differences between the city environment and the countryside become sufficient to trigger earlier blooms.
I often get the question what microclimate sensor I would recommend. To facilitate my answer to that, I decided to summarize my ideas on the matter here. Note that this is a far from exhaustive musing on the different factors to take into account. And most importantly: I would love to hear from YOU what worked and what didn’t, and would gladly update this information here with your insights!
In SoilTemp, we are not using one standard sensor type, we are accepting data from all different kinds of sensors, as long as they measure with 4 hour intervals or less. Most common brands are TOMST, iButton, HOBO and Lascar, yet there is a myriad of other sensors, for example those integrated in weather stations, flux towers, or other long-term monitoring. My personal recommendation is still the TOMST TMS4, a sensor designed by and for ecologists that solves many of the issues one could have.
Some features:
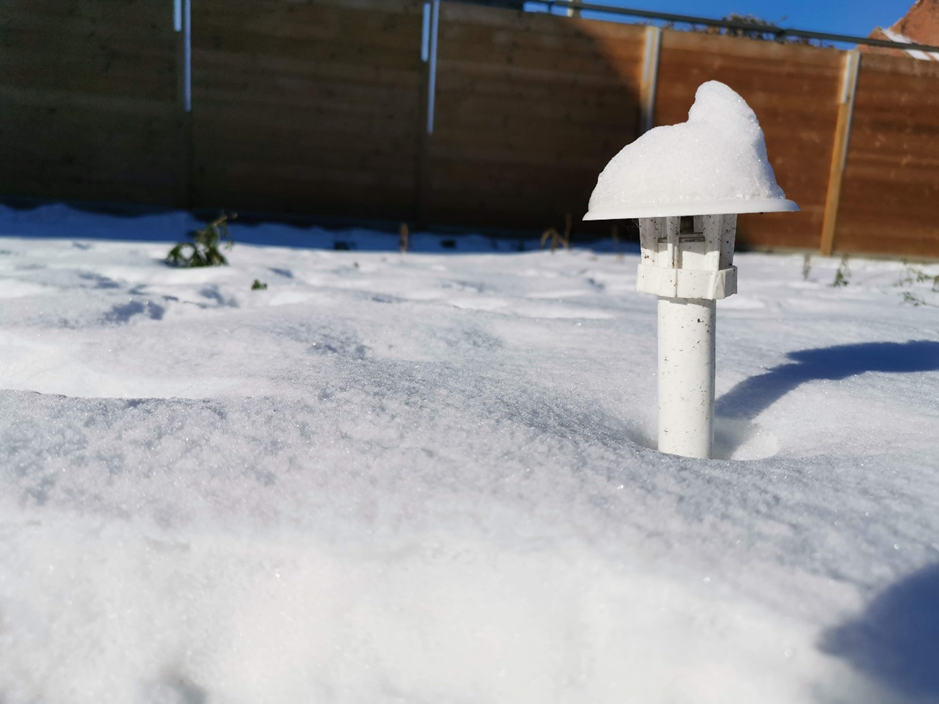
Some drawbacks, unavoidably:
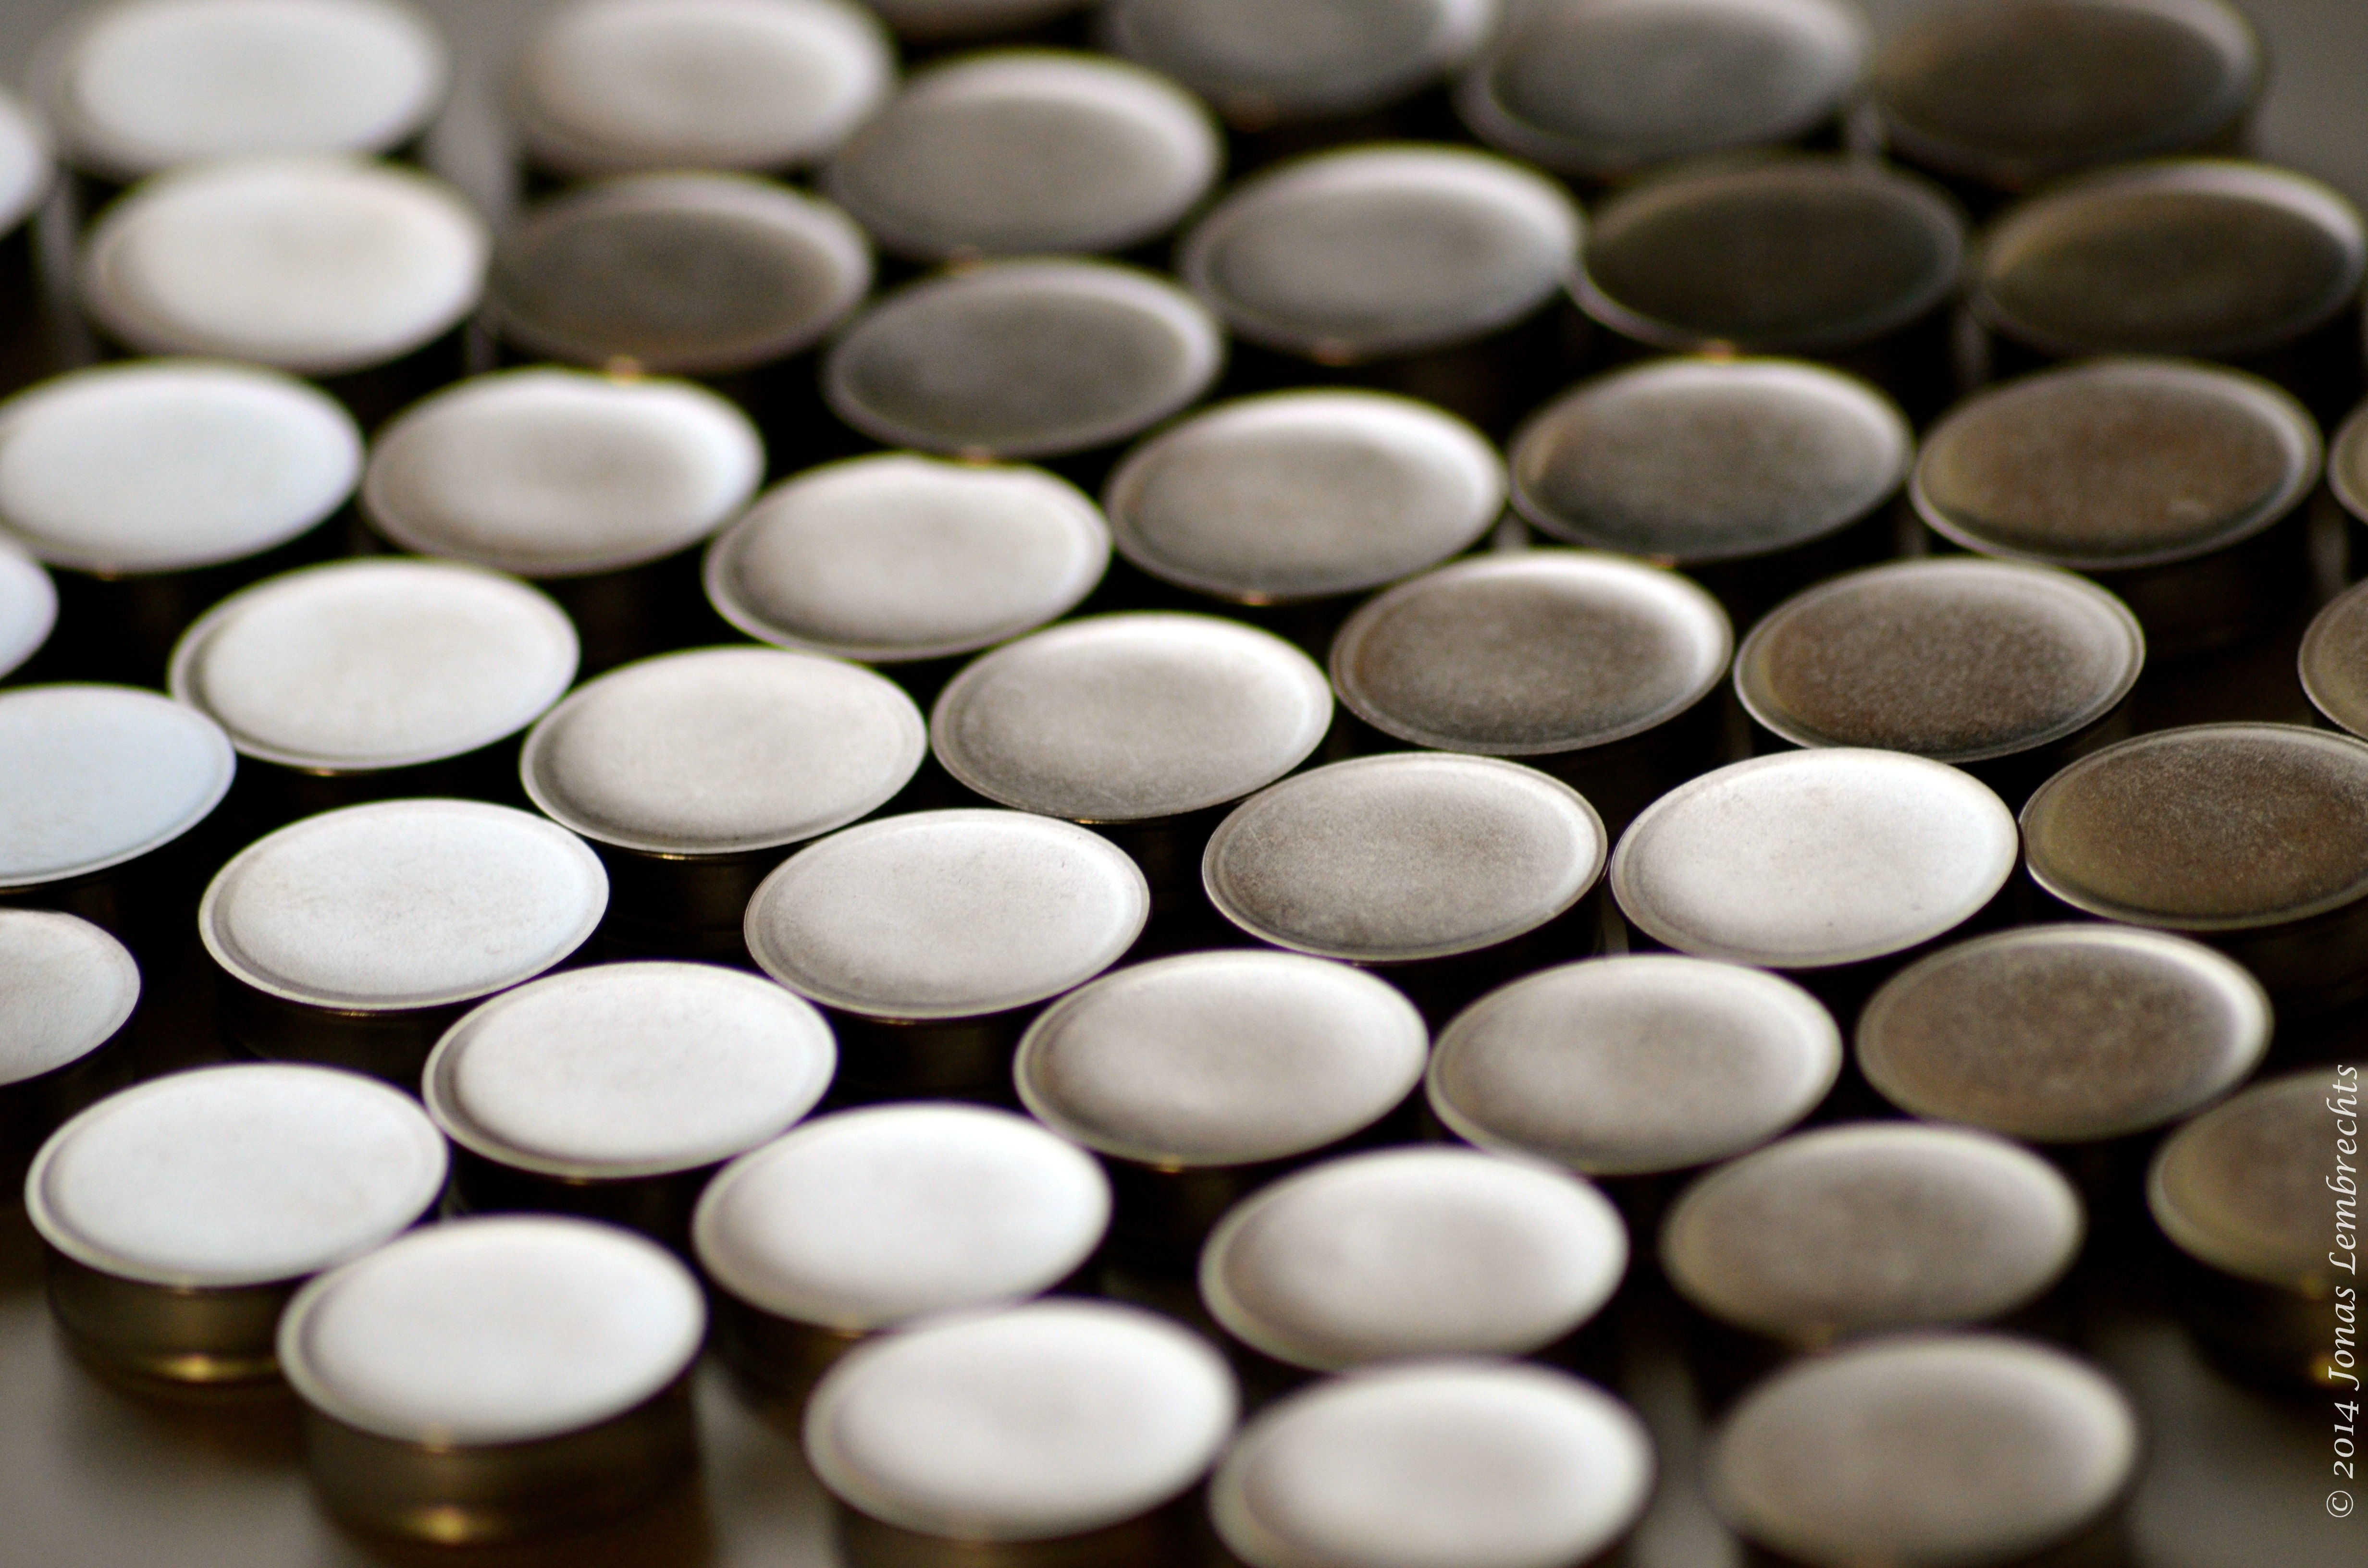
Some alternatives:
This week, we are kicking off season two of our citizen science campaign! 3000 die-hard participants (from the 4400 we had last year), will again install a garden dagger in their garden to monitor extreme weather events across summer.
So how is the weather looking at the start of this second season? For this, we can take a look at the sensor in the garden of CuriousNoses scientist Jonas Lembrechts, who keeps track of temperature and soil moisture in his backyard all year round (originally posted in Dutch on the website of the project).
‘This particular sensor works offline, which means that it has no connection to the Internet of Things but I have to go and read it periodically with a special device to retrieve the measurement data,’ Jonas said. ‘This kind of offline TMS-4 sensor is also used in the international SoilTemp network I am involved in. They collect climate data in the most remote places, from Congo to Antarctica. But also in my garden!
So during the past winter months, the sensor has been faithfully monitoring the temperature and soil moisture in his garden in Zemst. If we look back at the first three months of this year, we see that they were quite similar in terms of temperatures to what we got at the beginning of last year. Remarkable is the very warm New Year’s period at the beginning of 2022, where the soil temperature rose to as much as 9°C.

Despite the dry and sunny weather of recent weeks, soil moisture also still seems to be at a reasonable level for the season. This is largely due to the fact that our lawns do not yet consume much water in early spring, thus tapping much fewer of the resource. Nevertheless, the stubbornly declining green line does stand out in the figure: the soil has not received a solid rainfall for a few weeks now. No surprise: March was record-breakingly sunny in Belgium!
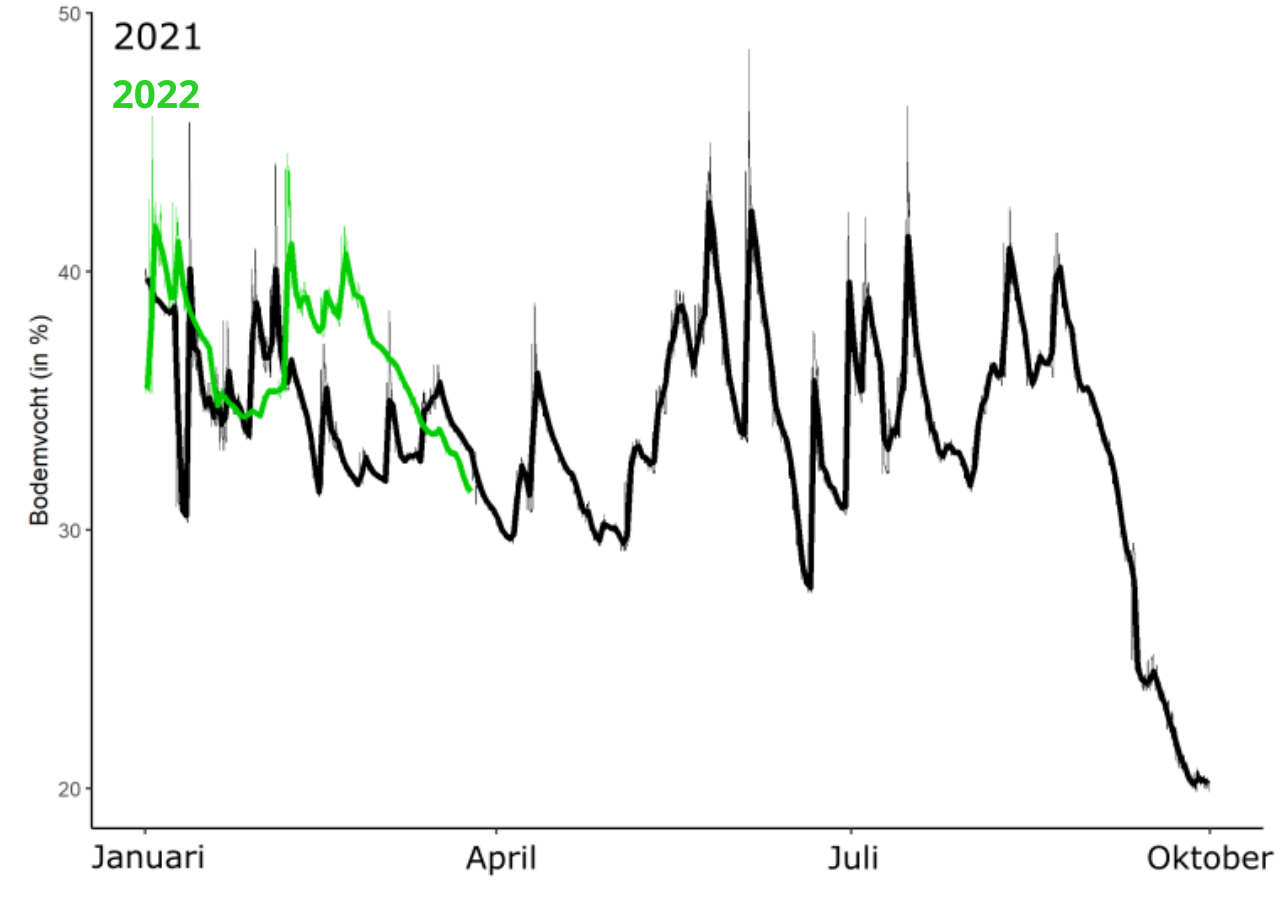
“We are thus starting this measuring season in my lawn with a healthy soil moisture,” Jonas explains. “But since we are measuring the moisture in the upper part of the soil here, these values can change very quickly in a hot, dry summer.” For the soil moisture in their own garden, participants will have to wait a little longer: the soil sensor always needs to settle for a few weeks to get good contact with the soil.
Heaps of soil in the sun, that is our view this week!

We are starting a little sensor calibration experiment, where we create a variety of soils as we find in our garden experiment across Flanders to test the soil moisture sensor of our garden dagger in.

The idea is to test how the raw measurements from the sensor (counting electromagnetic fluxes through the soil) can be converted into actual soil moisture measurements in different soil types.
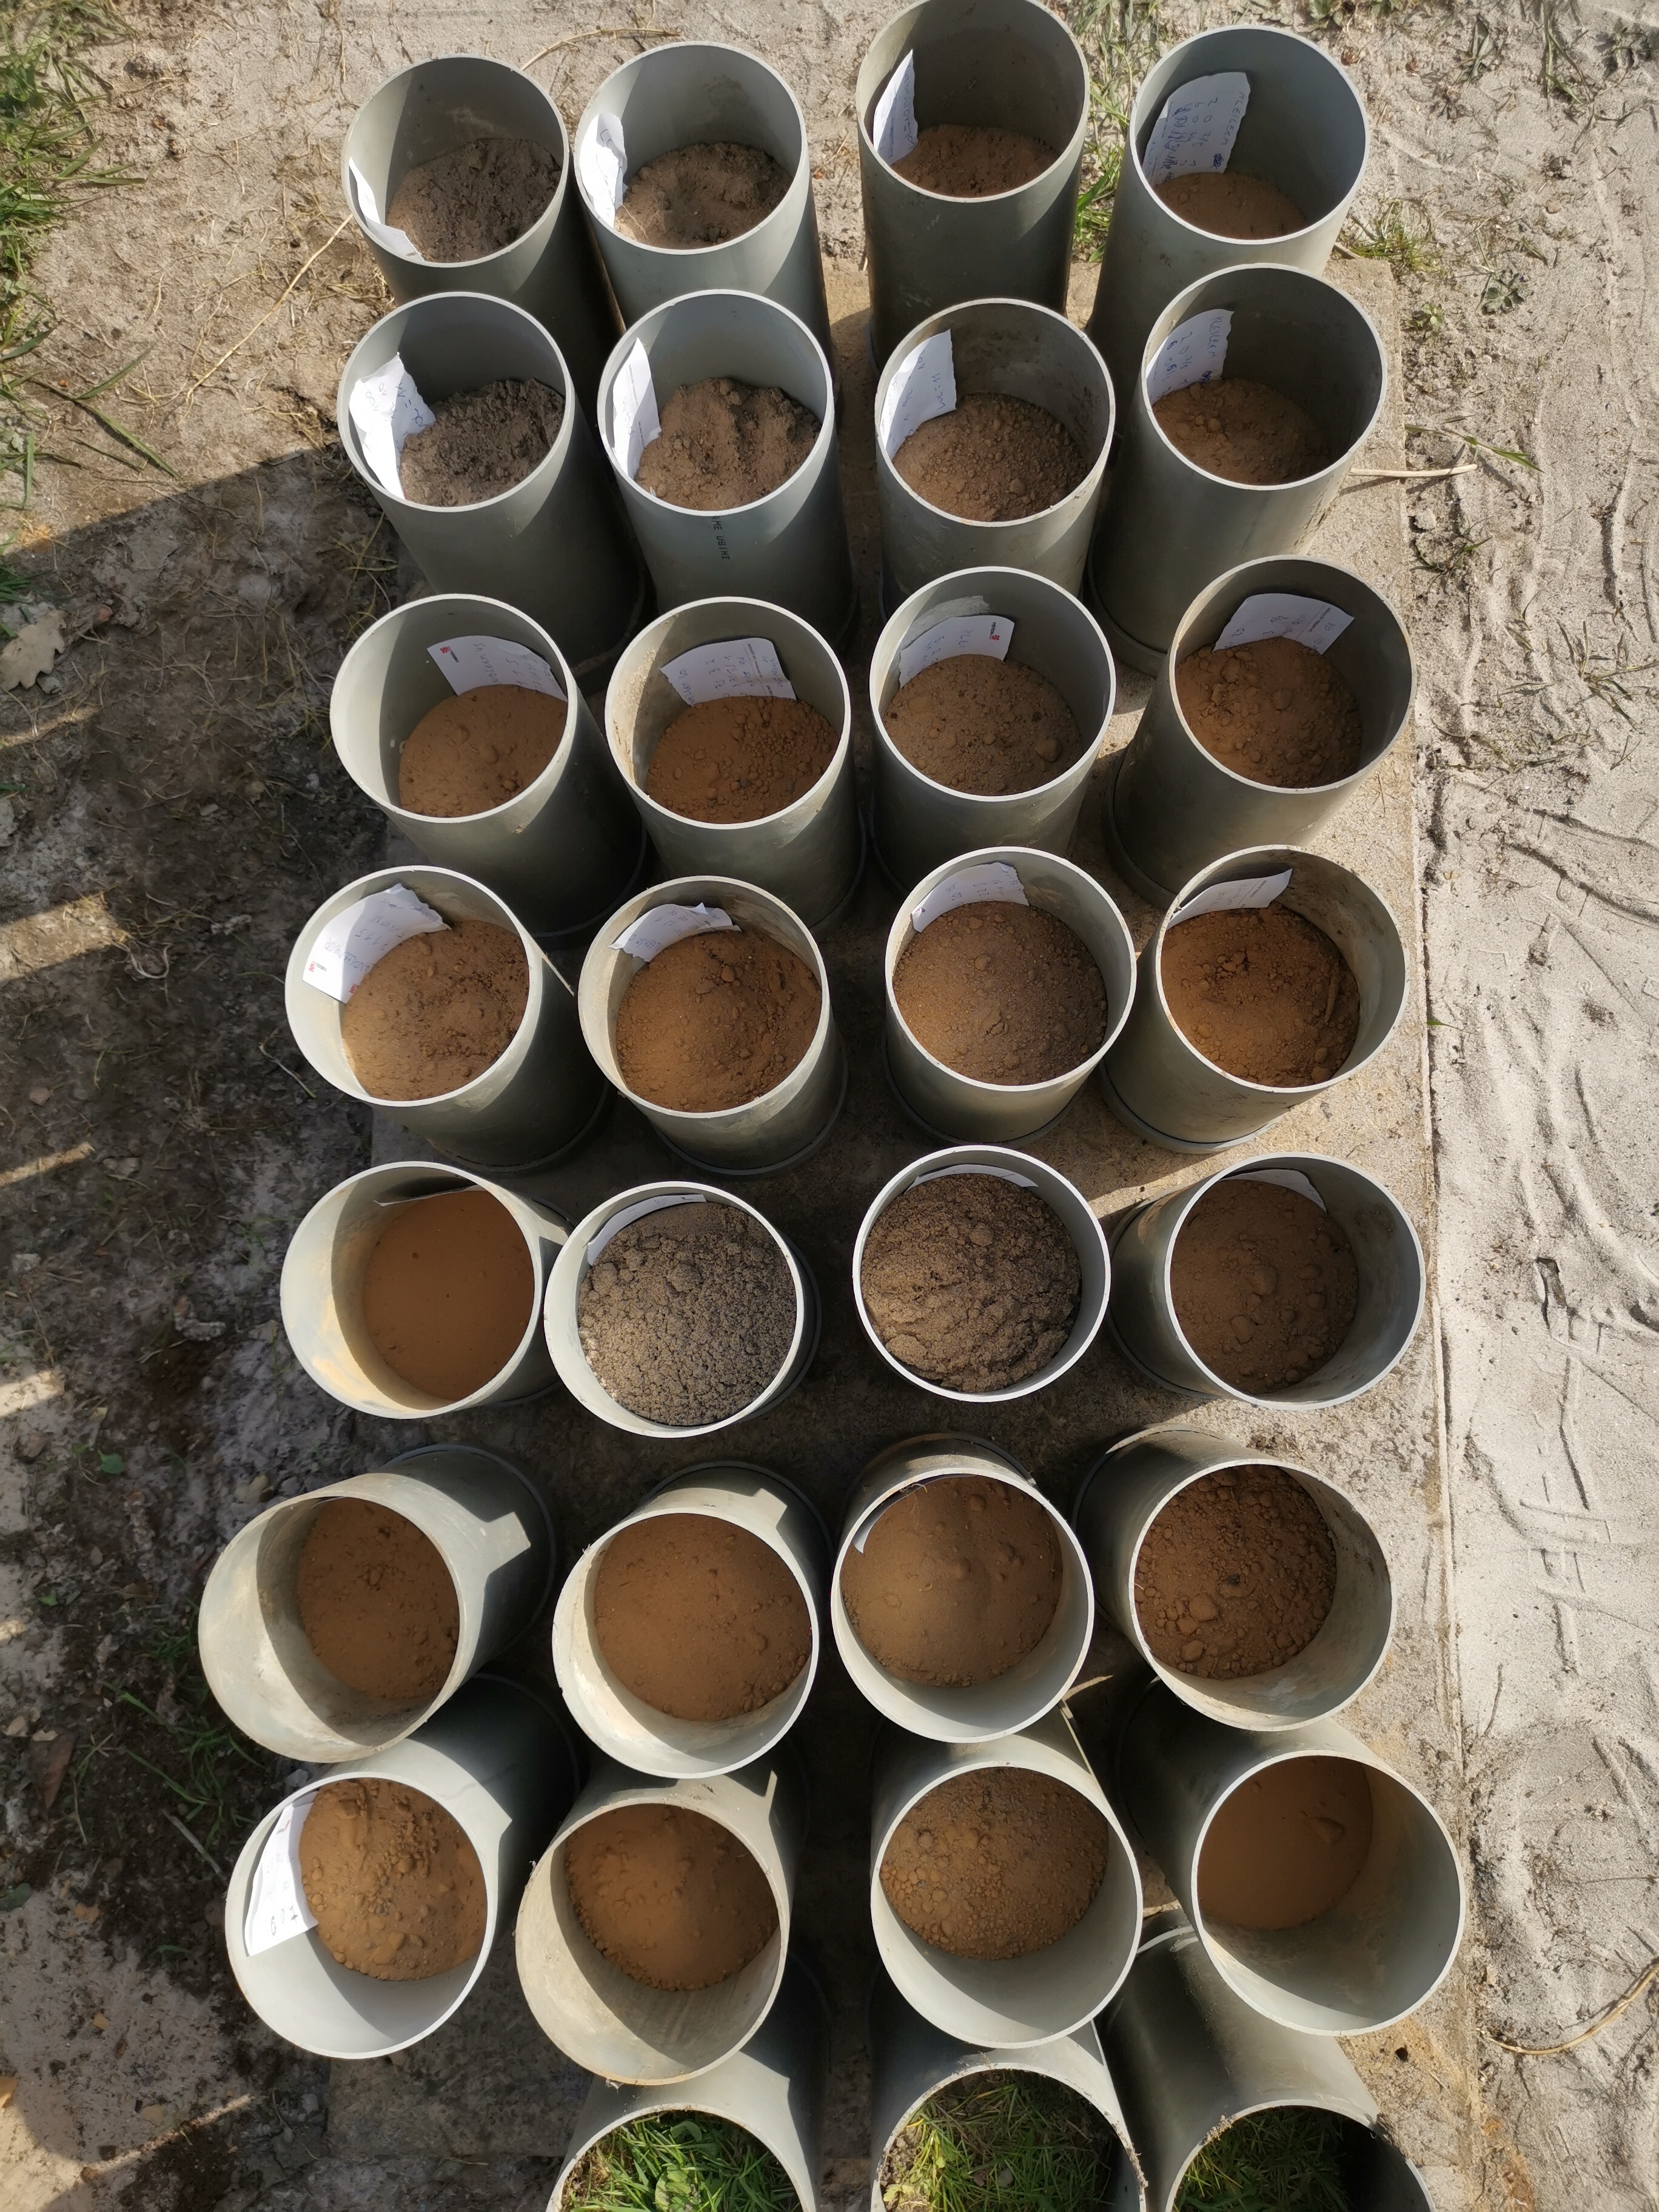
Such conversions exist and are provided by the developers of the sensor, but we were eager to test this for ourselves, to get a better understanding of how the sensor work, to get a calibration specifically for the range of conditions in our project, and to potentially contribute to that global classification.
Master student Jens will spend the coming weeks installing sensors in these pots, monitoring them and analyzing the soils.


