When the same data tells a different story

Scientific research often presents itself as a search for truth—rigorous, objective, and driven by data. But what if the same dataset, analyzed by different researchers, leads to different conclusions? That’s exactly what happened when a group of ecologists, including myself, took part in an ambitious experiment. An experiment in which we ourselves – the ecologists – were the test subjects. Our main goal? Testing the reproducibility of ecological data analysis. The results are now out in BMC Biology, and they are as fascinating as they were humbling.

A team effort in data exploration

I joined this project as an opportunity for my students to together learn how best to apply statistical models to real-world ecological datasets, taking it on as a collaborative activity with The 3D Lab. The premise was simple: multiple research teams around the world would analyze the same dataset, aiming to answer the same research question. It was an exciting challenge—what patterns would we uncover? How would our results compare to those of others?The hypothesis being, of course, that whoever analyzed the dataset should come to the same conclusion. There are scientific truths behind such data, right? Right?

The two datasets

The study focused on two different ecological questions:

  1. Blue tits – Does the number of young birds in a nest affect their growth?
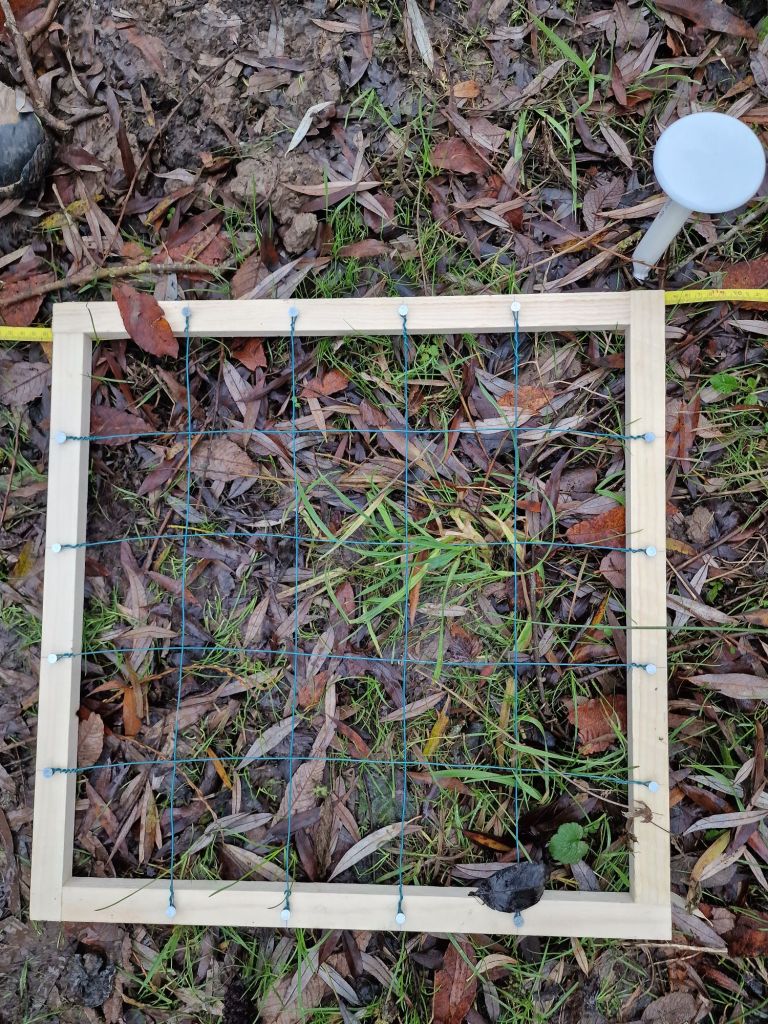
  2. Eucalyptus seedlings – Is there a relationship between the number of seedlings in a plot and the proportion of grass cover?

Our The 3D Lab-team dove into the dataset of the Eucalyptus seedlings – the trickiest one of the two. The blue tit dataset was relatively straightforward. Most researchers identified a negative correlation—young birds grew less when they had more siblings. However, here we had it already: there was significant variation in the strength of the correlation, and a few researchers even found a positive relationship!

The eucalyptus dataset was an even messier affair. While the overall pattern suggested only a weak relationship between seedlings and grass cover, a third of the researchers found either a positive or negative correlation. Some even identified strong relationships in opposite directions. These inconsistencies highlight a critical issue: the methods we choose can significantly shape the results we get.

Mindboggling graph if you wrap your head around it: an overview of the standardized effect sizes from all the analyses for the blue tit (left) and Eucalyptus (right) dataset. The blue tit dataset shows quite some agreement on the fact that the relationship was negative, yet with substantial variation towards the size of the effect, and even a few positive outliers. The Eucalyptus dataset on the right showed on average a slight, usually non-significant negative relationship, but with strong negative and positive outliers!

Why do results differ?

At first glance, these discrepancies might seem alarming. But they are not necessarily a sign that ecologists are bad at statistics – although that could contribute to it. Instead, they reflect the complexity of ecological data. Nature is noisy—environmental variables interact in intricate ways, making it difficult to draw clear-cut conclusions.

Importantly – in support of us statististicing ecologists, the study also found that researchers who reached unusual conclusions did not necessarily make methodological errors. We did indeed find substantial variation in the variable selection and random effects structures among analyses, as well as in the ratings of the analytical methods by independent peer reviewers, but we found no strong relationship between any of these and deviation from the meta-analytic mean (i.e., likely ‘wrongness’ of the analysis). This suggests that small choices—such as selecting a particular statistical test or data transformation—can have a big impact on the final conclusions.

Perhaps peer review isn’t the best approach to detect outliers in the statistical analyses? The peer review process (with a reviewer seeing somewhere between one and eleven studies) showed no significant correlation with how strongly of an outlier the reported effect size was.

What can we learn from this?

One of the biggest takeaways from this study is that statistics is not a magic wand. While it is a powerful tool, it does not eliminate uncertainty. This means that, as ecologists, I believe we should be more open about the limitations of our analyses and avoid blindly chasing statistical significance. The common threshold of p < 0.05 should not be treated as the sole indicator of truth.

Instead, robust research relies on multiple approaches:

  • Replication – The more times an effect is observed, the more confidence we can have in it.
  • Different methods – If different analytical techniques point in the same direction, the pattern is more likely to be real.
  • Transparency – Clearly documenting our choices helps others understand how we arrived at our conclusions.

Staying critical – even (or especially) of our own work

Personally for me, this study served as a reminder to stay critical of my own results. It’s easy to get excited when we find a nice correlation, but are we considering the full range of possible interpretations? Couldn’t we have made a series of equally-valid other methodological decisions, and what would have happened to our results then? Since participating in this project, I’ve made a habit of as much as possible explicitly acknowledging uncertainties in my papers. Perhaps more importantly, even, I now always use this example in my teaching, encouraging students to think about how different analyses can lead to different outcomes. Now there first statistical model they make as part of my team is one using the messy Eucalyptus dataset, showing them how we can in good consciousness report about the weak correlation in there.

Ecology is a science of patterns, processes, and probabilities. While we may never achieve absolute certainty, recognizing the sources of variability in our analyses makes us better scientists. And perhaps, a little more humble along the way.

Reference: Gould, E., Fraser, H.S., Parker, T.H. et al. Same data, different analysts: variation in effect sizes due to analytical decisions in ecology and evolutionary biology. BMC Biol 23, 35 (2025). https://doi.org/10.1186/s12915-024-02101-x

PS: note that this manuscript was published as a ‘registered report’, which means that it is a peer-reviewed research article from which study plans, including hypotheses and methods, were reviewed and accepted before the actual work was done, ensuring transparency and reducing publication bias. Pretty cool, huh!

Posted in Science | Tagged , , , , | Leave a comment

Sensors with a view

Not all fieldwork pictures are equally breathtaking. While part of our team waded through the muddy mud of De Driehoek – one of our university campus’s last patches of nature – another group embarked on a rather more inspiring mission: retrieving microclimate sensor data from the cliffs of Freyr, Belgium’s highest rock wall. The pictures I received from them, made by photographer Kobe Burdack, might just be what you needed to want to join the project…

Last summer, as part of our MIREN Rocks project, we – well, not me… – monitored plant biodiversity on these cliffs to study rock vegetation worldwide. Our research explores the impact of climbing, species diversity, and the role of rock microclimates in shaping these unique ecosystems.

Master student Sarane preparing to rappel down to the sensor. Pictures by Kobe Burdack.

To track temperature fluctuations, we use TOMST Thermologgers, securely mounted to the rock face. These sensors are read using a Juniper Systems Mesa 2 field computer—compact enough to be carried to heights of more than 100 meters! However, installing them was far from simple. Unlike in more accessible terrains, this task required rope access techniques, high-quality climbing gear, and a reliable mounting method—eventually, drilling a hole proved most effective.

Drilling a hole for secure sensor installation. Pictures by Kobe Burdack.
Reading out TOMST Thermologgers high above the river Meuse. Pictures by Kobe Burdack.

The MIREN Rocks project is always looking for new participants to expand our surveys to rock faces around the world. Do you have a background in ecology or botany, and are you comfortable climbing or working at heights? Join the survey! Visit our website for more details: https://www.mountaininvasions.org/miren-rocks

Pictures by Kobe Burdack.
Posted in Belgium | Tagged , , , , , , , , | Leave a comment

Temporal changes along mountain roads

In 2012, during my master’s thesis, we began monitoring vegetation along three Norwegian mountain roads with a clear goal: to track how these plant communities would change over time. Time, of course, is a relative concept, and nature operates on a much slower clock than we do. Now, over a decade later—after one PhD, two postdocs, and six months as an assistant professor—we’ve finally published the first temporal analysis of those roads, covering the initial decade of monitoring (Clavel et al. 2024 in Oikos, here).

Red clover in the roadside of one of our Norwegian roads, back in 2014.

Naturally, we were curious to see whether a decade would be enough to reveal significant changes, particularly in the spread of non-native species. After all, much of my PhD work revolved around the hypothesis that plant invasions in these Norwegian mountains were relatively recent, spurred by a warming climate and possibly increased human activity in the region. My experiments had shown that some key non-native species in the area, like Achillea millefolium and Trifolium repens (and pratense), could thrive hundreds of meters above their current elevational limits—provided they found nutrient-rich disturbed plots (Lembrechts et al. 2016). Furthermore, a global study from the Mountain Invasion Research Network (MIREN), which includes our region, indicated that a decade was often enough to detect increases in non-native species richness and elevational limits along mountain roads (Iseli et al. 2023).

Study design, showing the typical T-shape of the MIREN-transects, as well as the plant and mycorrhizal surveys we did in them.

So, what’s happening with these non-native species in northern Norway? First, the headline result: we found no evidence of an upward shift in their elevational limits or increased invasion into adjacent, undisturbed vegetation. This stability aligns with another study we published earlier (Wiegmans et al. 2024), which showed that non-native species in northern Sweden have been present since the early 20th century, coinciding with railroad construction, and that their presence has actually declined slightly over the last century. This raises an intriguing possibility: perhaps these species have already reached their elevational limits, finding equilibrium with the current climate. If that’s true, their upward expansion may proceed only slowly, in step with climate warming, rather than leaping ahead as non-native species do in the early phases of their introduction.

However, we did observe two clear signs of change: non-native species increased significantly in cover, and their richness rose from 17 to 23 species—a 35% increase! This could indicate that notable shifts are happening despite the lack of upward movement. But caution is warranted. These roads undergo periodic cycles of intensive roadside management, including the addition of fresh gravel, which resets succession along the roadsides. With only three time points over a decade, it’s too early to say whether these observed changes are part of a longer-term trend or simply a result of disturbance cycles. For now, the evidence suggests the area isn’t facing imminent danger from invasive species running rampant. Yet, if these species are currently at their climatic comfort zone, accelerating climate warming—as we fully expect—could quickly change the situation.

A significant increase in non-native cover in the roadsides (0-2 m from the road) over time (red = 2012, blue = 2022), yet not in the adjacent vegetation.

In earlier work, we also investigated whether the upward expansion of non-native species might be limited by a lack of suitable mycorrhizal fungi. We hypothesized that these species might be missing their underground partners, crucial for survival at higher elevations. Surprisingly, that wasn’t the case (Clavel et al. 2020). All the non-native species associate with arbuscular mycorrhizal fungi (AMF), which are present along the entire elevational gradient and flexible enough to pair with these plants. The native vegetation, however, is dominated by ericoid and ectomycorrhizal fungi, which seem to create a substantial barrier to non-native expansion away from the roadsides.

The heathland vegetation – with its ericoid mycorrhizal fungal community – remains highly resistant to non-native plant species in the system. Despite the increasing cover in the roadside, non-native presence in this type of vegetation remains virtually zero.

To delve deeper into this relationship, we conducted three surveys over five years to assess mycorrhizal diversity in plant roots along the roads. We wanted to tackle the chicken-and-egg question: do AMF facilitate non-native species expansion, or does non-native expansion drive AMF proliferation? Interestingly, we found an increase in AM fungal abundance at lower elevations along the roadsides over the past few years, which may correlate with the rise in non-native species cover. However, when we tested these relationships at the plot level, our results suggested that changes in non-native species cover didn’t drive AM fungal abundance. Instead, the shifts might rather be linked to changes in the native roadside community, which is itself more AMF-dominated than the surrounding natural vegetation.

And so, here we are, over a decade after my first tentative steps along these Norwegian mountain roads, with some initial conclusions: no rapid upward shifts in non-native species so far, but a clear expansion in their cover and richness. Whether this is due to rapid niche filling or simply interannual variations in disturbance is something we’ll need another decade of monitoring to unravel. For now, it seems unlikely that AM fungi are playing a leading role in this story.

Reference:

Clavel et al. (2025) Temporal effects of road disturbance on the spread of non-native plants and arbuscular mycorrhizal fungi in subarctic mountain ecosystems. Oikos https://doi.org/10.1111/oik.11075

Posted in Norway | Tagged , , , , , , , , | Leave a comment

Fostering growth in The 3D Lab: insights from our interactive sessions

The 3D Lab is a dynamic team of young scientists, brought together by their shared enthusiasm for exploring scientific topics under my guidance. Currently, the team comprises one postdoc, one PhD student, and several master and bachelor students. For many, this is their first real experience with science, and I am deeply committed to making it as inspiring and impactful as possible.

A key feature of our lab is a series of voluntary sessions—usually held weekly—that cover various topics essential for budding scientists. These sessions are designed to empower team members with practical skills and critical insights into the scientific process. They fall into three main categories:

  1. Teamwork: Sharing findings, participating in journal clubs, “shut up and write” sessions, expert talks, and collaborative brainstorming.
  2. Statistics and coding: From introductions to R and Python to advanced topics like the Tidyverse, linear mixed models, and data visualization in R.
  3. The scientific process: Career prospects, paper writing, peer review, research design, and even hands-on fieldwork sessions – everything that makes you a scientist.

Most sessions (apart from fieldwork, obviously) are conducted online to accommodate diverse schedules, with recordings made available afterwards for key topics like R tutorials that students might need at a later point in their work. Interactivity is a priority—students share their input, collaborate, and learn from each other.

What topics do students value most?

Twice a year, I survey lab members (both new and returning) to understand their preferences for upcoming sessions. While I don’t strictly follow the voting results—sometimes students aren’t aware of what they need, I must admit—it provides valuable insights into their priorities. I thought to share those insights with you as well, as there might be others interested to learn about what students want!

Here’s what stood out in our latest poll:

Summary of the topical votes for the latest round. Students can vote for as many as they want, and their top 3 gets double points. If you want to know more details about some of these sessions not discussed below, let me know!

1. Statistics & coding: practical tools they crave

Unsurprisingly, sessions on the Tidyverse, figure creation in R, and linear mixed models consistently top the list. These workshops address gaps in the curriculum and equip students to handle real-world research challenges, and are really aligned with the ecological research they’ll be doing with me:

  • Tidyverse: essential for cleaning messy data and merging datasets—tasks they frequently encounter in our projects. Our groups’ PhD researcher, Stijn, has developed an excellent tool to guide them through these processes.
  • Figure making: A collaborative, creative session where we refine their data visualization skills together.
  • Linear Mixed Models: Building confidence to transition from theory to application on real datasets.

2. The scientific process: navigating uncertainty

The most popular session this year in the wishlists was the discussion on career prospects, perhaps as a reflection of the concerns young scientists might have about the competitive academic job market and the need to explore non-academic opportunities – which remain often hard to find.

Other popular sessions in this category include how to write a paper and how to design a research question. I’m continuously enhancing these sessions to be more interactive, allowing students to exchange tips, insights, and experiences, which creates an engaging and collaborative learning environment.

Finally, my aspiring ecologists are always eager to get into the field, joining colleagues on projects to explore nature and gain hands-on experience. These fieldwork sessions not only immerse them in exciting research but also provide invaluable support for each other in collecting sometimes tedious or complex data. Students awaiting their summer expeditions to Scandinavia often jump at the chance to participate in local fieldwork projects in the Netherlands during spring, building both skills and camaraderie.

3. Teamwork

Students value sessions where we discuss the latest research in their field. While journal clubs and paper presentations (IRead) are less popular—likely due to time constraints or hesitation as early-career scientists to come up with strongly founded opinions—they’re highly enthusiastic for:

  • Expert talks: Learning from guest speakers.
  • SciUpdates: Hearing my latest updates on the research in the field, followed by lively discussions to inspire new perspectives.

Based on their feedback, I plan to expand our sessions further to include e.g., spatial data analysis in R. As a final note: these sessions remain entirely optional, supplementing our mandatory biweekly lab meetings where we discuss progress and shared concerns.

I’m curious to hear from others running young labs! What kinds of sessions have been successful in your teams? How do you balance student interests with essential skills they might not yet recognize as priorities? Are there ideas here that you’d like to adopt?

The northern Scandinavian part of last years’ team
Posted in Netherlands | Tagged , , , , , , , , | Leave a comment

Fieldwork time!

It’s fieldwork time again! We have started to enjoy some cold, grey and dark days in the Dutch mud the last weeks, for our new project on the scale at which biodiversity varies (more on that here).

Fieldwork in December, you might ask? Isn’t that by far the worst period to look at plant biodiversity? Oh, I can tell you, it is! The Dutch vegetation is looking pretty drabby at the moment – few hooray-moments about Dutch biodiversity, I must tell – and it’s also lacking quite a lot of its distinct features that facilitate identification.

First destination of our ambitious long-term biodiversity monitoring campaign tackles the biodiversity on the university campus itself: how much biodiversity manages to survive in between the buildings?

There are, however, two good reasons to go out into the field now. The first one is a very pragmatic one – I have a bunch of student interns for a short period of time that should do some fieldwork for their project.

The second one is a scientific one, though: we are interested not only in the spatial scale at which biodiversity varies, but also in the temporal scale: how much variation do you see in the same plot throughout the year and between years? How often should you monitor a plot to actually find all the species? What’s the period of highest diversity in a plot?

Biodiversity (and microclimate!) monitoring in the Netherlands during December may not be the most glamorous task, but what you see in the picture reflects the diversity we have—and that’s exactly why we monitor it!

Important questions with strong implications for the way we are tracking biodiversity changes, so you should be grateful for us braving the Dutch mud to find out!

Posted in General, Netherlands | Tagged , , , , , , , , , | Leave a comment

Ten practical guidelines

One of the biggest dreams when we started the SoilTemp project was not only to bring together all available microclimate data into a single, unified database but also to align how we think about and measure microclimate. Today, we are excited to share a major step toward achieving that goal: our new paper, Ten practical guidelines for microclimate research in terrestrial ecosystems, is now published in Methods in Ecology and Evolution.

This paper provides exactly what every graduate student and researcher in ecology and biogeography has been waiting for: a comprehensive guide on everything you need to consider when integrating microclimate monitoring into your research. From defining why you need microclimate data, to determining what and where to measure, and deciding on how and when to collect your data, this paper has it all. It doesn’t stop there either: it also walks you through compiling, analyzing, and publishing your microclimate data in ways that maximize impact and accessibility.

The why, what, how, when and where of microclimate monitoring, as well as site-specific characteristics to think about. A series of questions everyone has to go through when designing the microclimate component of their study, and the paper walks you through each and every one of them.

It’s quite the giant of a paper as well, trying to go sufficiently in depth with all these aspects of the question to have practical relevance, and to really put you on the road to a successful microclimate project.

Microclimate research is of course not done once the data comes in. Part two of the paper guides you through your selection of reference data, how to compile your microclimate time series, the basics of microclimate data analysis and the publication of your data open access and, of course, into the SoilTemp database!

Where to measure?

One of my favorite parts of the paper – to name just one – focuses on where to measure microclimate. This section emphasizes the importance of matching spatial resolution and extent to the scale at which your study organisms experience their environment. It highlights the nested, hierarchical nature of microclimates: locally measured conditions (temperature, moisture, wind) are shaped by a combination of local, regional, and global climatic signals.

The nested nature of microclimates. Locally measured microclimate (e.g. temperature, moisture, wind) always represents a combination of local, regional and global climate signals. At each scale from macro to micro, climatic gradients can be unfolded, just like replicated geometric shapes in a fractal.

That chapter explores the concept of proximal microclimate, which refers to how closely microclimate measurements represent the actual conditions experienced by organisms. Proximal microclimate goes beyond simply placing sensors: it considers both the spatial and temporal alignment of measurements with biological processes. By addressing this, researchers can better connect microclimate data to ecological responses.

Additionally, we introduce practical approaches like stratified random sampling to select logger locations. This technique helps ensure that you capture as much environmental variation as possible, maximizing the value and representativeness of your dataset.

No ‘one-size-fits-all’ solution—and that’s okay!

Importantly, the paper doesn’t promise a single ‘golden rule’ to every microclimate monitoring challenge. There’s no universal sensor, setup, or methodology that works for all studies—and that’s because each research question is unique. What the paper does offer is a clear framework to help you identify the best strategy for your specific case, taking into account the unique characteristics of your study system.

Building on the latest advances in microclimate research

In addition to its practical advice, the paper builds on the latest advances in microclimate science, making it an invaluable resource for both beginners and experts. It not only provides you with step-by-step guidance but also connects you to a carefully curated list of must-read references in the field.

As you can expect, we are incredibly excited about this paper finally seeing the light of day, and hope it will inspire and support researchers around the world in designing successful microclimate studies.


Read the full paper here

Key takeaway: Microclimate research is a complex but essential part of understanding terrestrial ecosystems. With these ten practical guidelines, you’ll be better equipped to design, execute, and share impactful microclimate research—and maybe even contribute your data to the SoilTemp database!

Posted in General | Tagged , , , , | Leave a comment