Draft

DSC_7953

There it is! The fruit of hard labour, the harvest of what has been sown 5 years ago: the draft of my PhD-thesis!

It is out of my hands now, while the jury is bowing their wise heads over it. But oh does it feel nice! To see these thoughts on paper, all neatly written down; the best thoughts of me and so many of my fine colleagues, on my favourite topic in the world.

DSC_7954

Now on to the next steps: the bullet list for my PhD is finally getting alarmingly much shorter than it ever was. Pre-defense, re-writing, finalizing and defending, that is all there is left. But do not panic, the bullet list for the future is already put in position, I am unlikely to end up bored!

Posted in Science | Tagged , , , , , , , , , | 1 Comment

Species distributions in a messy world

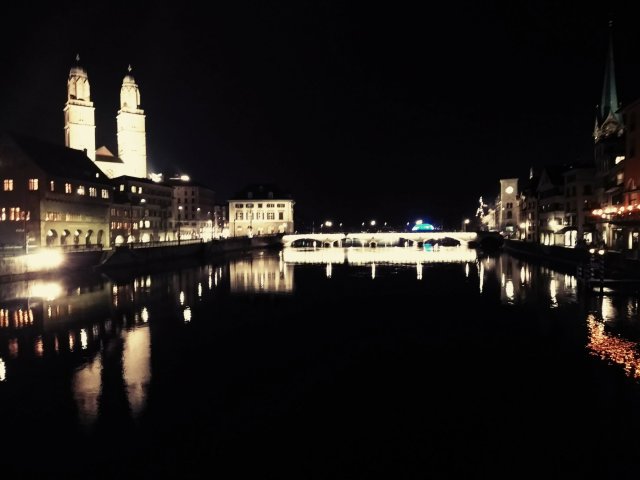
At the meeting in Zurich (introduced here for those who missed it), species distribution ecologists (like me) and people from the remote sensing community came together to meet. Troughout the discussions we had, an intriguing conclusion surfaced that I found worth mentioning here. To state it boldly: humans are making a mess of species distributions.

To take you back to the theory: where in the world we find a species, is to a large degree defined by its climatic niche, which is the set of environmental conditions in which the species can survive. Is a place too cold or too hot, too dry or too wet, then the species will not be there. Every species has different wishes in that regard, yet all of them have limits. That is what we call the fundamental niche.

There is however something else that defines where in the world will find our species in the end: other species. The interactions with other organisms will work on top of and in interaction with the environmental conditions in defining the so-called realized niche, which is usually only a part of the fundamental niche. For example, alpine plant species might be able to handle the milder climate of a valley, yet they are outcompeted there by other plant species that grow much faster and leave no space for these slow-growing little creatures. If you would give them a helping hand, by planting them in a rock garden, for example, they happily illustrate you how much broader their fundamental niche is.

35948684293_a7377e9749_o

An alpine species like this Saxifraga can survive and grow in harsh environments

Now there is one organism with a disproportionally huge influence on these realized niches: humans. Like no other species, we influence the landscape, change the land cover, disturb the environment. And inevitably, species are going to appear or disappear following these changes: they might avoid – or not – urban environments, benefit from the edges of fragmented forest patches, or a myriad of other negative ànd positive reactions to all these anthropogenic influences.

39416232315_97d4097226_o

Agricultural land looks in no regard like the natural environment that would have been here without human influence.

If one now wants to model where a species actually is (i.e. its realized distribution, an important goal of a lot of our work here on plants), it is obviously crucial to take that human component into account. This is however rarely done, expect for local, regional trials. Most large-scale assessments still focus largely on the abiotic environment, and you can easily see how untrustworthy such predictions would be. The problem is that the human influence on the landscape results in highly heterogeneous conditions, with a lot of variation on a very small scale. And to get good and accurate information on this messy world of humans, is complicated.

25442562907_15ec232344_o

Cities, like Mechelen (Belgium) here on the picture, are good for a very heterogeneous environment, due to the wide variety of structures, surfaces, and human disturbances on a small area.

Yet times are a-changing. Recent years have seen an increasing availability of highly accurate data on human land use and the accompanying land cover, thanks to rapidly developing remote sensing techniques: satellite images are improving with every launch, drones are becoming more accessible, and the accuracy of our species distribution models is rapidly following.

So yes, humans are messing with species distributions, yet by joining forces between distribution ecologists and remote sensers, we will now soon be able to assess accurately how bad this is for our species.

Posted in Science | Tagged , , , , , , , , , | 2 Comments

Zürich

DSC_6795

This week brought us to Zürich, the magnificent city of bank buildings and rösti. We were heading for a highly interesting meeting, organised by the GMBA, the Global Mountain Biodiversity Assessment. They gathered a team of leading scientists from two different disciplines: ecology and remote sensing.

Ecologists, like I am one, are interested in the distribution of species. To understand these distributions, we need detailed information of the environment in which the species are living. The remote sensing community on the other hand uses drones, airplanes or even satellites to monitor the environment with extremely high detail.

Aha, you might say, sounds like you two are made for eachother! Yes, indeed. Yet as often, one community does not really know what the other has to offer, while the other is not entirely sure what the one community needs. This meeting tried to bridge that gap, on the one hand show ecologists which remote sensing techniques are ready to use, and what to expect in the near future, and on the other hand let us ecologists make up our mind on what we would like to get next from remote sensing.

And all that was a tremenduous success in my opinion. What a promising field is this remote sensing! You will definitely hear more on this later!


Posted in Switzerland, Uncategorized | Tagged , , , , , , , , , , | 1 Comment

Global risks

Each year, at the eve of the World Economic Forum in Davos, the Global Risks Report is published. The Global Risks Report is created by experts and decision-makers from all over the world, and this year’s version covers more risks than ever. It focuses in particular on four key areas: environmental degradation, cybersecurity breaches, economic strains and geopolitical tensions.

While the 80-page document (find it here) is definitely worth the read, it is the first graph on page 3 that most easily catches the eye:

Global Risk Report

The graph distinguishes between impact and likelihood of the different threats to our world (with the different colors depicting the 4 different groups of threats identified above. While the largest impact is predicted from weapons of mass destructions (“my nuclear button is much bigger than yours”), the three dark green dots on the top right seem the most impressive: a high impact combined with a high likelihood; i.e. the prediction of very likely and very serious damage.

19965654066_b7a1bf9f_89yzX

These three green dots are environmental risks, with the one at the top depicting extreme weather events, followed closely by natural disasters and failure of climate-change mitigation and adaptation. But even the next one (the dark orange dot of ‘water crisis’), albeit a societal issue, is highly related to the abovementioned environmental threats. Later graphs in the document show this interconnection between environment and societal issues even more (see the original file). Water crises, food crises, involuntary migration, spread of infectious diseases, all of them are strongly intertwined with the issue of a changing climate.

What does that mean? It means it is ‘two minutes to midnight’ on the Doomsday Clock, as officially stated by the Bulletin of Atomic Scientists. Worrisome, yes, but do not forget that our Doomsday Clock can easily count backwards again, so do not give up hope as long it is exactly midnight!


Posted in Science | Tagged , , , , , , , | 2 Comments

Light

24713893167_db81eb89e3_o.jpg

Christmas lights in Mechelen, Belgium

The season of darkness – and tons of artificial little lights to compensate for that – is finally coming to an end again. Here in Belgium, we are again gaining two minutes of daylight every day, on our steady road to spring and summer.

Did you know that the increased competition for light is one of the main reasons biodiversity goes down when a vegetation gets more nutrients? A famous paper in Science (Hautier et al. 2009) once showed this elegantly: they added artificial light sources underneath the vegetation in a grassland and showed how this extra light counteracted the loss of biodiversity through the addition of nutrients.

Normally: more nutrients, more competition for light as competitive plants get bigger, and thus less biodiversity.

Now: more nutrients, light artificially kept high, biodiversity didn’t go down.

Reference:
Hautier et al. (2009). Competition for light causes plant biodiversity loss after eutrophication. Science. 324, 636-638.

Posted in Belgium | Tagged , , , , , , , , , | Leave a comment

Unusually warm

2018 has started of relatively stormy, here in Belgium. Water on the quays in Antwerp, and the first ever use of the large controlled flooding areas along the Scheldt, the year does indeed start unusual. In the Netherlands, it was even the first time ever that all five flood barriers have been closed at the same time! (Note that the latter does not imply a particularly strong storm, yet the unusual situation of storm tide conditions in the whole country).

Maastricht - 1

A cold day in Maastricht, the Netherlands.

Unusually stormy and warm, perhaps, yet I do not want to talk about that kind of unusually warm winter weather now. I want to introduce you to a different kind of unusually warm: the urban heat island. The what!?-island, you think?

Maastricht - 4

Well, the urban heat island effect describes the fact that cities (the urban environment) are islands of warmer temperatures in the sea of cooler rural area around them. In summer, but especially in winter, city temperatures have been observed to be several degrees higher than those in the rural areas. In the evenings, these differences can even add up to 12 °C.

Maastricht - 3

While it was relatively cold in the city, the countryside surrounding it was even covered in a layer of snow

You might have experienced this already yourself: not only the breathtaking heat of a summer heat wave in the city, but also how your car windows freeze less often when parked in the city center over night, or how cities have less snow, or earlier snowmelt, than the surrounding countryside.

Maastricht - 2

Intriguing, isn’t it? Another case of strong microclimatic variation, like we study in the mountains, yet in a totally different environment. And its effects on species and their distributions might be even bigger! But more on that later, hopefully…

Posted in Netherlands | Tagged , , , , , , , , , , | Leave a comment