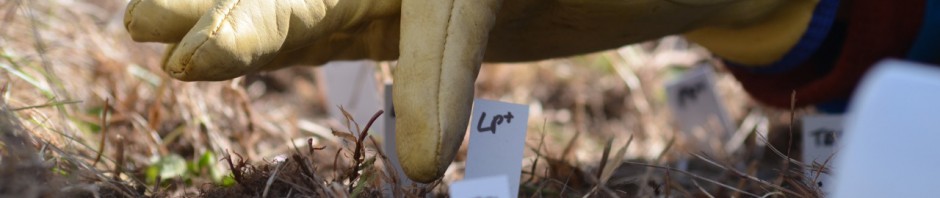
Smart bud(die)s, or Knappe k(n)oppen in Dutch, is a citizen science project initiated by our research group at the University of Antwerp (together with ReaGent). It is tailored towards high schools, and aims to provide them with a fun and instructive way to be part of a real scientific experiment. In this case, aim is to study the budding of trees (hence the name), and the effect of daylength and climate on this budding.
Bringing a classroom in the forest: citizen science as it should be
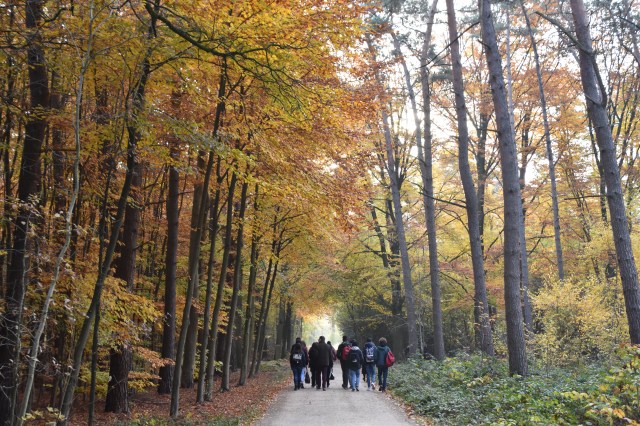
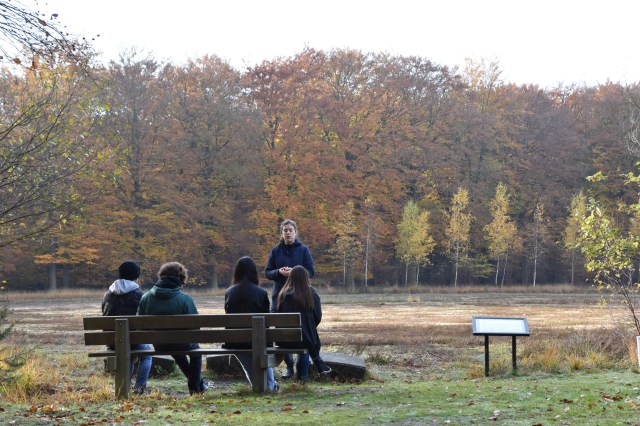
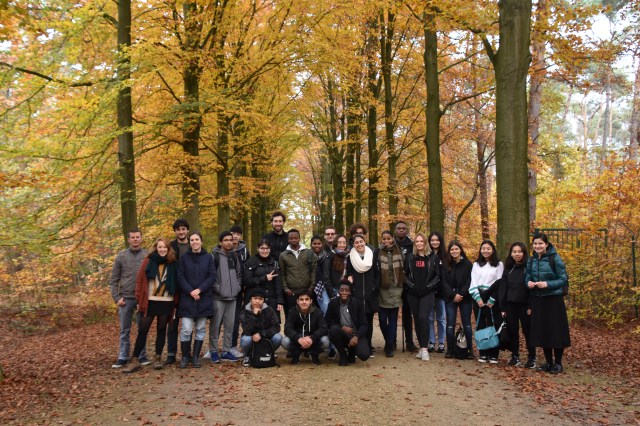
Last week, I spent half a day in the forest with one such enthusiastic group of highschool students, and the dedicated scientists from our research group who introduced them to the forest. The goal that day was to slowly build up their knowledge of and interest in forests: first show them in general what a forest is, why it matters in the light of climate change, and how scientists like us are studying these forests.
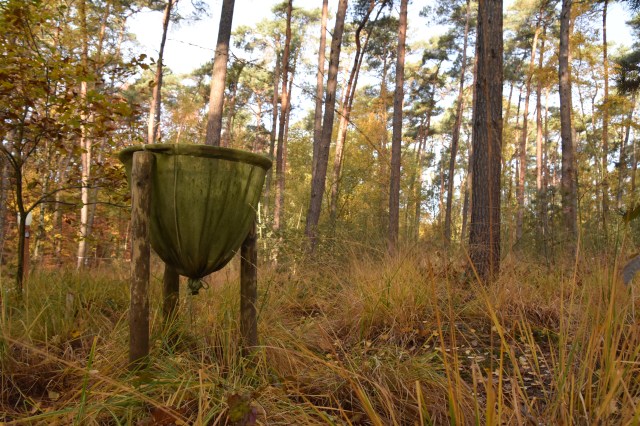
A litter trap: capturing falling leaves to study the effect of climate and weather on forest dynamics
The students got to make their own preparation of leaves to study under a microscope, explored the different measurement devices spread throughout the forest (which is a dedicated ICOS long-term research site, and thus closely monitored on all levels), and learn a range of facts from photosynthesis to heathland management. They got to run through the forest, and admire its mushrooms. All of it to get them involved and fascinated about the trees they will be studying next.
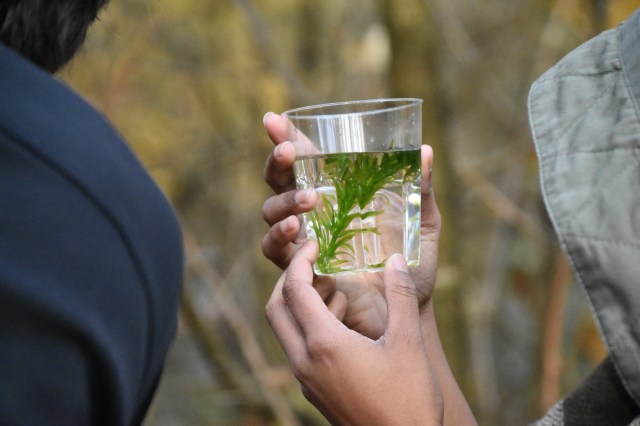
A student counting bubbles in the water as a measure of photosynthesis
Such community-driven science is very different from how science is traditionally done, at the far end of the spectrum one might consider when thinking about scientific outreach. It is putting science and the community into one pot and stirring it vigorously. The resulting dish tastes fascinatingly refreshing: children who get to learn about science while doing it, who experience how to care about the world that surrounds them, and look at it with curiosity.
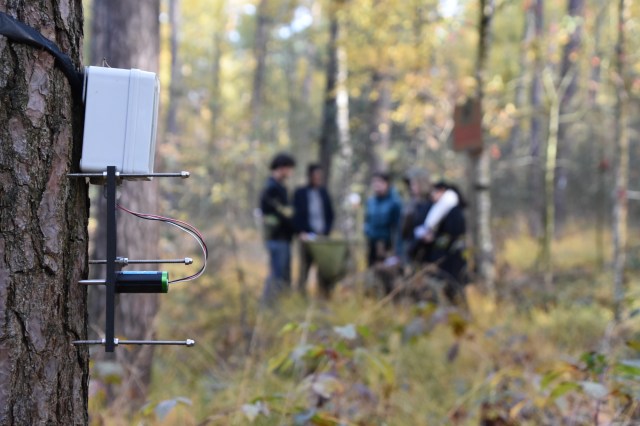
Learning about forests and their role in climate change in one of the best monitored forests of the country
It is a huge commitment for the involved scientists, that much is certain. But it serves one of the main goals of science, and as such is worth as much effort as any experiment.
Heathland management and why it matters
When science and society come together


")


")
")


")


")


")


")


")


