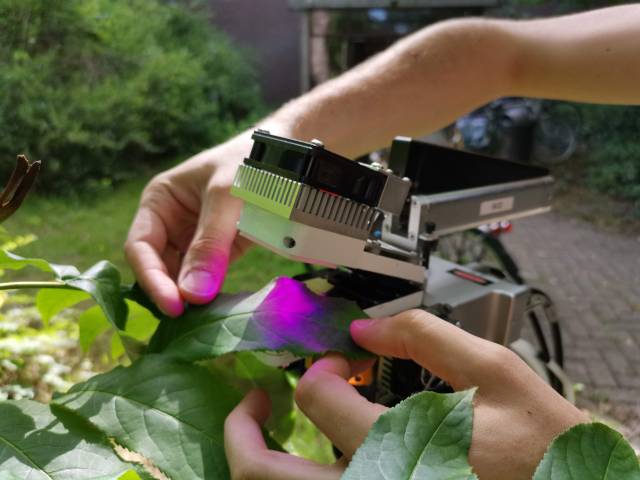
Thanking the citizens

Hi citizen! We have to thank you. Really, we are eternally grateful for what you do!

Let me explain: we have this interesting scientific question about non-native plant species in cities. We know they are there – tons of them, yet we want to study some patterns in their distribution and performance, among others related to the notorious Urban Heat Island effect.

rhdr

The non-native Butterfly bush (Buddleja davidii) growing on a city wall in Mechelen

So we head out into the urban marvels of Flanders, ready to hunt down invasive plant species and measure their traits. Yet how to find them? We could not just randomly criss-cross through the country, looking at each leave we passed? That would be crazy – and way beyond what I would ask from a PhD-student.

It is there that you, the citizens, come in: there is tons of you out there, already finding all these species, and uploading your observations to fantastic citizen science platforms like iNaturalist and the Flemish Waarnemingen.be. Highly accurate coordinates, often illustrated with pictures of the plants.

nor

Ailanthus altissima, the Tree of Heaven, growing happily on the side of a hot bridge over the ring around Antwerp. 

We just have to download those observations there, plug in the coordinates in our GPS, and navigate to the spot. 3 out of 4 times, we end up lucky, finding what looks like a needle in a haystack: our study species. Then we can measure where they are and how they are doing there, which promises to tell us a lot about the hows and whys of non-native species in the cities.

rhdr

Pauwlonia tomentosa seedlings spreading on a parking lot of a train station. A location we would have never found without the help of the army of citizen scientists.

Stay tuned for these results, they are on the way! For now, just take the ‘thank you’, and please, please, keep recording all those observations, they are of such high value to so many ecologists out there. If you want to help us specifically – and you are in Western Europe – you can do so by recording any observation of our 8 woody city invaders via iNaturalist. Check out the project here, and go out to find them!

qrf

Abandoned building sites, hotspots for non-native species in the cities.

We are recording observations of 8 common non-native woody plant species in Western European cities, to study their distribution across the urban-rural gradient. You can help by uploading your obervations of those species to iNaturalist here! Focussing on Paulownia tomentosa, Ailanthus altissima, Buddleja davidii, Senecio inaequidens, Berberis aquifolium, Cornus sericea, Prunus laurocerasus and Symphoricarpos albus.

Posted in Belgium, General | Tagged , , , , , , , , , , | 1 Comment

Weather station data insufficient for predicting the faith of biodiversity under climate change

We have been doing it all wrong with how we study what the effect of climate change on our biodiversity will be, say Jonas Lembrechts from the University of Antwerp and an international team of ecologists. Their warning is published in the scientific journal ‘Global Ecology and Biogeography’.

It is common practice among ecologists: if you want to know the faith of biodiversity in a changing climate, you first link the distribution of species to the climate at that location. To accomplish this, you use climate models based on the network of weather stations across the world. For many organisms, however, it turns out this approach is unlikely to be valid.

Case in point: northern Scandinavia, where Lembrechts and his colleagues studied the relationship between the tundra vegetation and the local climate. They noted temperature differences of several degrees Celsius between these global weather station models (at 1.5 m in the air) and the temperature just below the soil surface, right there where these small tundra plants are growing.

Picture 1

In winter, plants safely under a blanket of snow do not experience the extreme temperatures we feel – and our weather stations record. Dovrefjell, Norway.

“Especially in winter, the differences are mind-boggling”, Lembrechts explains. “When the local weather station shows average temperatures dropping far below minus 10 °C, plants at the soil surface could still be comfortably at around 0 °C, as the snow cover in the tundra acts like a blanket. Many organisms are thus blissfully unaware of extreme conditions like that.” Consequently, the distribution of most tundra species also relates more strongly to these soil than to air temperatures, the study shows.

“Interestingly,” Lembrechts adds, “this relationship was much stronger for small plant species like grasses, while it was not visible for trees.” The former indeed experience a much stronger mismatch between the temperatures they experience, and the climate reported from weather stations.

Picture 2

The researchers had to brave the tough conditions in Lapland themselves to learn what climate plants are experiencing in this extreme environment.

This information has important implications for the question how biodiversity will react to climate change. This reaction will not be linear, as has often been expected, as the temperatures at the vegetation level are driven by other factors, for example changes in snow cover. This uncertainty on how climate change will look there where it matters for biodiversity needs to be solved urgently if we want to be able to predict what will happen in the future.

Want to know more: Lembrechts et al. (2019). Comparing temperature data sources for use in species distribution models: from in-situ logging to remote sensing. Global Ecology and Biogeography.

Posted in General, Norway, Science, Sweden | Tagged , , , , , , , , | Leave a comment

Dark

Dark clouds over our Dark Diversity experiment, yesterday.

An unstable atmosphere – some thunderclouds passing to the north of us – made for dramatic views of the heathland in the ‘Kalmthoutse Heide’, when we were out there collecting data for the Dark Diversity Network.

It made for apocalyptic views at our disturbed site, where we measure the impact of anthropogenic disturbance on the dark diversity – the species absent at a certain location. In our case, the disturbance had been dramatic, as proven by the picture above, yet with a noble goal in mind: turning a pine forest back into heathland – the target vegetation of the area. We aim to monitor over the years how the vegetation will recover from that drastic disturbance.

A thunderstorm passing in the far distance over the heathlands of northern Flanders

Those target heathlands were showing themselves from their best sides in many of our other plots, proving once again that the Kalmthoutse Heide is one of the crown jewels of Flemish nature. If ever in the area, I strongly recommend you to visit them, especially towards the end of August, when the vast plains turn beautifully pink!

Calluna vulgaris flowering

Just too early for the pink Calluna-fields of late summer

Oh, and don’t worry about those clouds – modern technology lets one track the weather with an accuracy of a few minutes and meters, so plenty of time to go into hiding long before things get awry.

Posted in Belgium, General | Tagged , , , , , , , , | Leave a comment

Heather

IMG_20190717_151326.jpg

Early flowers of Calluna vulgaris in the Kalmthoutse Heide. Hoping for more in the coming months!

While most of the fieldwork campaigns this summer are being taken care of by our awesome teams of PhD and master students, there is a few sets of field days I am joining. One of them just happened on a lovely not-too-hot summer day in the heathlands and forests of northern Flanders, on the border with the Netherlands.

IMG_20190717_143546.jpg

Pine seedling braving a sandy dune

It is there, on the poor sandy soils of the Campina region, that we are monitoring vegetation for the global Dark Diversity project.

IMG_20190717_140705.jpg

The heathlands and forests of the border park

I have written about this intriguing ‘dark diversity’ before: it is basically the non-realised biodiversity, those species that are NOT present at a given location. It is those species that indicate the unrealised potential of an area. For this, we compare a disturbed and an undisturbed heathland site with a whole series of vegetation surveys in a circle with 20 km diameter around these plots.

IMG_20190717_102626.jpg

Species identification in a wet heathland plot

There is of course at least two reasons why a certain species does not occur at a location: the local characteristics (a dry heathland will never hold the same species as a wet heathland a few meters downslope), and anthropogenic pressures. By comparing a disturbed with an undisturbed area, we will be able to disentangle these two, and get closer to the heart of what human influence does to diversity.

IMG_20190717_134634.jpg

Mushroom in a little patch of chestnut forest

Of course, such general questions on the drivers of global diversity (loss) require a lot of data. We are just one factor in a big chain here: our Flemish heathlands are one vegetation type to be studied; ecologists all over the world are right now out in their own landscapes, doing exactly the same. Talk about feeling connected with the world!

IMG_20190717_133543_BURST002.jpg

Skipper butterfly

IMG_20190717_102106.jpg

Adding soil temperature loggers to our Dark Diversity plots to link up these observations to our global SoilTemp-network: hitting two birds with one stone!


Posted in Belgium, General | Tagged , , , , , , , , , , | Leave a comment

The climate the organisms feel

Short: our recent review in Ecography got awarded as runner-up of the E4-award, the Ecography award for Excellence in Ecology and Evolution. To celebrate that success, I am re-posting the original blogpost that explains the story. More of an auditory learner? Check out this video abstract, in which I narrate the main conclusions of the story in 3 minutes!

43035841140_9efb21663d_o.jpg

Ecologists like to know where species are living, and why. It is indeed one of the most critical questions in today’s ecology to ask what is behind the distribution of a species, and how that will be affected by global change. A highly popular tool in that regard are ‘species distribution models’ (SDMs), a statistical tool to link species occurrence data to data on background conditions.

Climate is a crucial background condition to consider in that regard, and climate variables are the most commonly used variables in SDMs. Yet there is a big issue there: what climate to use when modelling the distribution of a species? Ideally, one wants to use the conditions as experienced by the study organism, right? Traditionally, however, SDMs mostly rely on free-air temperature conditions with a coarse resolution (e.g. with pixel sizes of 1×1 km), as this has for long been the best data available. Such data however fails to capture the apparent temperature (cf. microclimate) as experienced by living organisms within their habitats.

42021202270_df77ed6003_o.jpg

For mountain plants especially (in this case Pedicularis hirsuta in the northern Scandes), the climate they experience near the ground is far from what happens at 2m in the air.

There is indeed an important mismatch between the climatic data we have available, and the climate as experienced by many organisms. First of all, local variation in temperature is crucial in any habitat with a vertical component, like forests, mountains, or cities. In these environments, local temperatures can differ several degrees from the coarse-grained averages usually used. Additionally, free-air temperature and climate patterns also differ significantly from what happens at the soil surface, or a few centimeters below it. For many organisms in the soil and close to the surface (soil micro-organisms, ground beetles, herbs, forbs, mosses or tree seedlings, for example), this mismatch is fundamental.

26998647151_2b32b3c5c8_o

Most organisms, being it plants, insects, soil microbes or many many others, live totally decoupled from the climate at coarse resolutions as measured in weather stations. (Pictured: Cepaea nemoralis)

But no worries, the scientific community is on it! Several studies have already made considerable progress in tackling this problem from different angles in their effort to solve that mismatch. In our recent review in Ecography, we show how 1) in-situ climate measurements with tiny sensors, 2) remotely sensed data (from satellites, airplanes, or LiDAR, which provides high-resolution 3D reconstructions of the environment) and 3) microclimatic modelling, are all bringing us closer and closer to the climate our study organisms actually care about.

32686389013_dd04a71e93_o

Several studies have been getting closer to modeling the actual climate experienced by species, for example by incorporating 3D-forest structures in models of climate on the forest floor. (Pictured: Crocus sp.)

We believe that instead of using all these approaches separately, we should combine them. We thus propose a framework that does exactly that: first of all, we suggest using a selection of appropriately-placed sensors, spanning a wide range of environmental conditions. Not too few, not too many. This real-time local data from exactly the location where your organisms live can then be combined with detailed measurements of the habitat 3D structure, for example derived from digital elevation models or airborne laser scanning to extrapolate it to the whole region. Finally, long-term records of free-air conditions from nearby weather stations can be used to extend your in-situ network through time. With this unified approach, we can obtain microclimatic data with the optimal resolution and extent – both in space and time – to accurately model current and future species distributions.

Graph

Summarizing our framework on how to get relevant microclimate data for use in ecological models.

Yet the proof of the pudding is in the eating, of course. The framework is there, but now we are stepping up the game: we want to apply our concept on the global scale. Therefore we launched SoilTemp, which is a global database of soil temperature data, with a double purpose: 1) we want to model soil temperature globally, combining this database of in-situ measurements with remote sensing and microclimatic modelling, and 2), we want to use the database to improve our models of species distributions. More on that here.

Interested, and have some soil temperature data lying around? Don’t hesitate and get in touch!

33556874241_0eee4ec877_o

The concrete surface and tall buildings in cities create a unique microclimate that is highly different from large-scale climatic averages. (Pictured: Viola sp.)

Reference: 

Lembrechts JJ, Nijs I, Lenoir J (2018). Incorporating microclimate into species distribution models. Ecography. doi: [10.1111/ecog.03947].

Posted in General, Science | Tagged , , , , , , , , | Leave a comment

Four fronts

Summer arrived, and that means: fieldwork! And this summer, more than ever before, that fieldwork is spreading across the world. We will have four important fronts of research open this summer, and I aim to keep you updated about all of them as they unfold.

First, we have our team in Norway, in the mountains of Dovre. There, under the expert lead of PhD student Ronja Wedegärtner, we are looking at the impact of hiking trails on biodiversity. This project now has its own website!

32025904948_dd7d04dab0_o

Dovrefjell, Norway, here still under its blanket of snow

Secondly, there is our team in Abisko, Sweden, with PhD-student Jan Clavel. There, the summer will bring a lot more insights on belowground interactions, while we will also greatly expand our microclimatic network in collaboration with the awesome people at CIRC (the Climate Impact Research Center).

43783201872_fb544d4a8b_o

The long-term vegetation monitoring gradient of CIRC, which will be the scene of microclimatic research this summer

A bit closer to home, there is our work on the invasion of exotic plant species in our Flemish cities, led by PhD-student Charly Geron. This will be expanded with a study on dark diversity in the heathlands of Kalmthout.

28538695927_f595dee7d2_o

Measuring the stress of non-native species across the urban-rural gradient

And then finally, there is our lab component: the processing of root samples from all over the world (currently working on samples from Tenerife) is also in full swing. Less glamorous pictures, yet the results promise to make a splash.

20190626_145107

Cutting roots for the analysis of fungal DNA

46146705165_3bb661a95a_o

Fieldwork in the Argentinian Andes earlier this year, now being processed in the lab

Posted in General, Science | Tagged , , , , , , , , , , , | Leave a comment