Last week, we wrapped up De Oorzaak with nothing less than a bang. With in-depth stories featured in De Morgen, striking results on the table, and a “tour across Flanders” that brought us to Antwerp, Ghent, and Leuven, the project ended on a high note. The closing events weren’t just symposia – they were the grand finale of a citizen science project that has kept us occupied for the better part of two years. Each evening was a meeting point between science, citizens, and policymakers, weaving data and lived experience into one story about noise in our cities.
The full team on stage, accepting flowers for two years of intensive work with and for the whole of Flanders
Noise is more than just an irritation – it shapes how we live, sleep, and feel. The results from De Oorzaak make this crystal clear: almost half of all measurement points were, on average, above 60 dB during the day – a level already higher than the World Health Organization recommends. Unsurprisingly, traffic was the worst culprit across the board. But we also saw how local noise sources – like tourist boats or tram rails – can have gigantic impacts on daily life in specific neighborhoods.
And those numbers are only part of the story. Behind them are the voices and experiences of people who live with noise every day. At the symposium, participants shared endless varieties of stories – some tragic, some creative, all deeply personal. They showed just how differently noise can affect lives, and how much effort it takes to raise awareness.
The consequences are clear, as shown by our data: the more noise we are exposed to, the more annoyed we become. Annoyance spills into reduced sleep quality, and ultimately into a diminished quality of life.
🗺️ If you don’t have a subscription to De Morgen, you can explore this beautiful interactive map of Lden values and noise events at each measurement point, including AI-detected sources binned by the peak noise level per event, as made by our data wizard Ablenya Barros: https://ablenya.github.io/Oorzaak/Sensors_noise_events.html.
Yet there is also hope – and it’s green. Across the data, one message stood out: nature helps. Green spaces and natural sounds soften the harsh edges of our urban soundscapes. Even when the decibel levels are not lower, the presence of rustling leaves, birdsong, or flowing water transforms how we experience sound. Nature doesn’t necessarily quiet our environment – it restores us.
The next question is: what will we do with this knowledge? At each evening of the symposium, policymakers were confronted with that exact challenge. The most striking message came from the city counsillor of environment in Leuven, who put it simply: this is the new normal: citizens now have the data to show there is a problem – giving them a lot more power again. But solutions will not be easy, and they never have been.
Power to the people – giving them the data to contextualize their environment.
So where do we go from here? The evidence is clear, the stories are real, and the momentum is growing. If we want healthier cities and better lives, the answer is again clear: we need more green in our cities.
There is much much more depth and nuance to this story than I can tell here and now, but we hope we can get back to you about all that! For now, check out this first post here: https://www.uantwerpen.be/nl/projecten/de-oorzaak/nieuws/.
Long-term followers of this blog know I’ve always been fascinated by species distribution changes. We’ve tracked non-native species moving into mountains and cities, studied how mountain plants travel up and down slopes along roads, and explored how microclimate – and changes in it – affects all of this.
But all of that focuses on recent changes, what we call contemporary climate change. What we often forget is that the world has been dynamic for millions of years, and species have been moving up and down, and left and right for just as long. So, we asked ourselves: could we learn from these past dynamics to better predict the future?
https://www.sciencedirect.com/science/article/abs/pii/S0006320725005361That’s exactly what Yuheng Chen tackled in his master thesis – now expanded into a full paper in Biological Conservation. Yuheng, now a PhD student in our group at Utrecht University, has with this paper completed quite a journey on a topic that has kept my head spinning: looking far back in time to understand the forces shaping species today. And let me tell you, looking that far back is not easy.
The core question was simple enough: are species used to climate change or not? Species that evolved in regions with strong past climate fluctuations might be better at coping with future change, whereas those from historically stable climates might be more vulnerable. In other words, a species’ history shapes its present ecological niche, which in turn affects its future range size.
To explore this, we went (well, virtually, for me) to China. We identified 2,933 plant species endemic to China, which conveniently avoids issues of artificial borders and inconsistent data across countries, while still benefitting from the huge variety of climates and ecosystems across the country. Using species distribution models, we mapped their current ranges, measured their sensitivity to climate, and predicted how those ranges might change by the 2070s under two climate scenarios.
Next came the exciting part: comparing regions where species diverged long ago (‘divergence hotspots’) with areas that have experienced big climate swings since the Last Glacial Maximum (‘paleoclimate-change hotspots’). Museums are regions where species diverged a long time ago – they’re ancient centers of diversity, like living archives. Cradles are regions where species divergence is more recent – they’re hotspots of new evolutionary activity.
Here’s what we found:
Species from stable, long-term refuges (‘museum areas’) are projected to lose range under future warming.
Species from climate-fluctuating regions might actually expand their ranges.
Figure 1.The divergence and paleoclimate change hotspots of Chinese endemic higher plants. Figure 4A recognizes museum (ancient divergence center) and cradle (recent divergence center) based on species divergence time using null-model test. Figure 4B and 4C recognize refuge (stable precipitation and temperature center) and exposure (precipitation and temperature change center) based on paleo precipitation change since LGM, respectively. The provinces corresponding to the hotspots are also marked in the map.
Interestingly, there was no difference in predicted change rates between species from old (museum) versus new (cradle) divergence hotspots, but paleoclimate exposure mattered a lot: species from areas that experienced strong past climate change are predicted to do better than those from stable refuges.
Figure 2: predicted changes in future ranges for species with different origins. There was no difference in predicted change rates for species from old (museum) versus new (cradle) divergence hotspots, but there was a clear difference for species exposed to either a lot (exposure) versus very little (refuge) paleoclimatic change.
These findings highlight how evolutionary history and past climate experiences shape both current distributions and future responses. They also give us a clue about the winners and losers under rapid climate change, and stress the importance of identifying areas that are long-term refuges versus regions accustomed to taking a punch. While mostly exciting from a theoretical perspective, this knowledge is also important for designing future-proof protected areas.
Back in 2021, we had an important thought: maybe we should start treating microclimate the same way we treat macroclimate. Weather and climate are monitored by national governments through organized, standardized networks – so why not microclimate too?
We wrote a short note to get that idea out into the world. Nice, said the reviewer, but tell me more about the ‘how’! And so we did. We developed some R code to help people figure out where to place those sensors. Nice, said the reviewer again – and in the end, the paper became mostly about that.
Nice, said the readers, but what if we want to do this locally, not at the country level? We still have questions! We got talking, and soon a new idea was born:
👉 How do you set up your own microclimate network, even if you have as little as two sensors?
And that brings us to our new paper, just published in Ecological Informatics.
A flexible workflow for anyone
This new paper brings everything together. It includes:
Even more flexible R code for site selection. You can work with a fixed budget, or let the code tell you exactly how many sensors are needed to cover your region.
Guidance on project design from start to finish, so you don’t just know where to put sensors, but also how to structure the entire monitoring effort.
A nice workflow diagram to guide you through all the steps — from defining your questions, to engaging the community, to placing sensors, analyzing data, and communicating results.
A visual guide to setting up your own microclimate network. From defining your questions and teaming up with the community, to picking sites with smart R code, testing the setup, heading into the field, crunching the data, and finally sharing results – the workflow takes you from first idea to real-world impact.
Why microclimate is different
Microclimate monitoring comes with some unique challenges. Covering the full variation in a landscape often means crossing human-made boundaries, which in turn means involving many landowners.
Take our large project in Flemish gardens: here, citizen science became essential. Thousands of people installed sensors in their own gardens, creating a network far beyond what we could have done alone.
To make things more concrete, the paper also walks you through three case studies from our own work:, from the forests of Madagascar, over the deserts of Oman, to the urban gardens of Belgium
Each shows, step by step, how specific microclimate questions shaped our decisions.
Overview figure of the three case studies discussed in the paper
The toolbox
Of course, there is a reason this paper is in Ecological Informatics: the code. The heart of the paper is a set of tools that let you:
Visualize variation in your landscape for key microclimate drivers.
Identify optimal sensor locations to capture that variation.
The beauty is that landscapes differ wildly – but the decision-making process is the same everywhere. That’s what the workflow makes reproducible.
Take our case-study in Madagascar as an example. The region has two main plateaus, one at ~500 m and another at ~1100 m, connected by a steep slope. That slope, though small in area, is microclimatically quite important – so we had to oversample it. By contrast, the broad lowlands required fewer sensors, despite covering more space.
Left: sensor location selection (red) in the landscape, plotted as a function of elevation and slope. The black dots are all combinations present in the landscape, with the shape of the point cloud typical for two plateaus connected by a steeper slope. On the right: annual temperature range as a function of canopy cover, and coloured by land use type.
Then there’s canopy cover: ranging from 0 to nearly 90%. To capture that gradient properly, we spread sensors across both topographic and canopy variation.
This kind of exercise inevitably landed us in rice paddies and farmland – places with microclimates very different from forests (albeit surprisingly not so on this annual temperature range graph above). And that meant bringing farmers on board, motivating and involving them as part of the project.
In short, this paper is a step-by-step guide plus flexible R functions for anyone who wants to build a local microclimate network. Whether you have 2 sensors or 200, the workflow helps you design your network systematically, transparently, and with local context in mind.
We’d love to see this become a go-to resource for the growing community of microclimate enthusiasts. And of course—we’d be thrilled if the data from these networks feeds into the global Microclimate Database.
As for those nationwide microclimate networks? Governments haven’t yet picked up the urgency. But now you know about it too. And one day, we’ll make it happen.
Het Nationaal Park Brabantse Wouden is gestart met het nieuwe burgerwetenschapsproject Groene Longen, dat het positieve effect van bos – en natuur in brede zin – op de luchtkwaliteit in kaart wil brengen. In totaal nemen 35 burgers in en rond het nationaal park deel, elk met een eigen luchtkwaliteitsensor die data in real time doorstuurt naar een interactief dashboard. Het onderzoek loopt drie maanden en gebeurt in samenwerking met dr. Jonas Lembrechts (Universiteit Utrecht & Antwerpen), trekker van eerdere burgerwetenschapsprojecten CurieuzeNeuzen en De Oorzaak.
Afgelopen weekend leverde het project meteen een sprekend voorbeeld van de kracht van real-time data: de sensoren detecteerden een pluim fijn stof afkomstig van bosbranden in Canada. Zowel in stedelijk gebied als daarbuiten werden duidelijke pieken gemeten.
“Een van de doelen uit ons masterplan is om het slimste nationaal park van België te worden,” zegt Julie Blanjean, projectleider burgerwetenschap van Nationaal Park Brabantse Wouden. “Met toegankelijke projecten zoals Groene Longen brengen we wetenschap en natuurbeleving dichter bij de mensen.”
Fijnstofmetingen in Tervuren, aan de rand van de Brabantse Wouden, lieten vrijdag vanaf 14 uur een duidelijke stijging zien. Waar de luchtkwaliteit hier normaal uitstekend is, bleef het fijnstofgehalte verhoogd tot zaterdag rond 9 uur. Deze piek, die overal in Vlaanderen zichtbaar was, kon duidelijk worden gelinkt aan een rookpluim uit Canada, afkomstig van grootschalige bosbranden daar.
Real-time data voor iedereen Elke deelnemer heeft toegang tot een persoonlijk dashboard, en alle metingen zijn ook live te volgen via de wereldkaart van het internationale luchtkwaliteitsnetwerk AirGradient: link naar kaart.
“Real-time monitoring brengt de wetenschap letterlijk tot bij de mensen,” legt dr. Lembrechts uit. “Deze Canadese rookpluim is daar het perfecte voorbeeld van: binnen enkele uren na aankomst in België konden we de impact meten. Het laat zien hoe sterk lokale luchtkwaliteit verbonden is met gebeurtenissen duizenden kilometers verderop.”
Betrokken burgernetwerk
Groene Longen sluit aan bij eerdere burgerwetenschapsinitiatieven van het nationaal park, zoals de Klimaattrappers die het verkoelende effect van bossen onderzochten met sensoren op fietsen. Zo bouwt het Nationaal Park Brabantse Wouden verder aan een slim en betrokken netwerk van burgers en onderzoekers. Groene Longen loopt nog tot en met november en ook daarna zal het nationaal park geïnteresseerde burgers blijven betrekken.
Meer informatie:
Jonas Lembrechts – j.j.lembrechts@uu.nl – 0471475321 Julie Blanjean – julie.blanjean@brabantsewouden.be
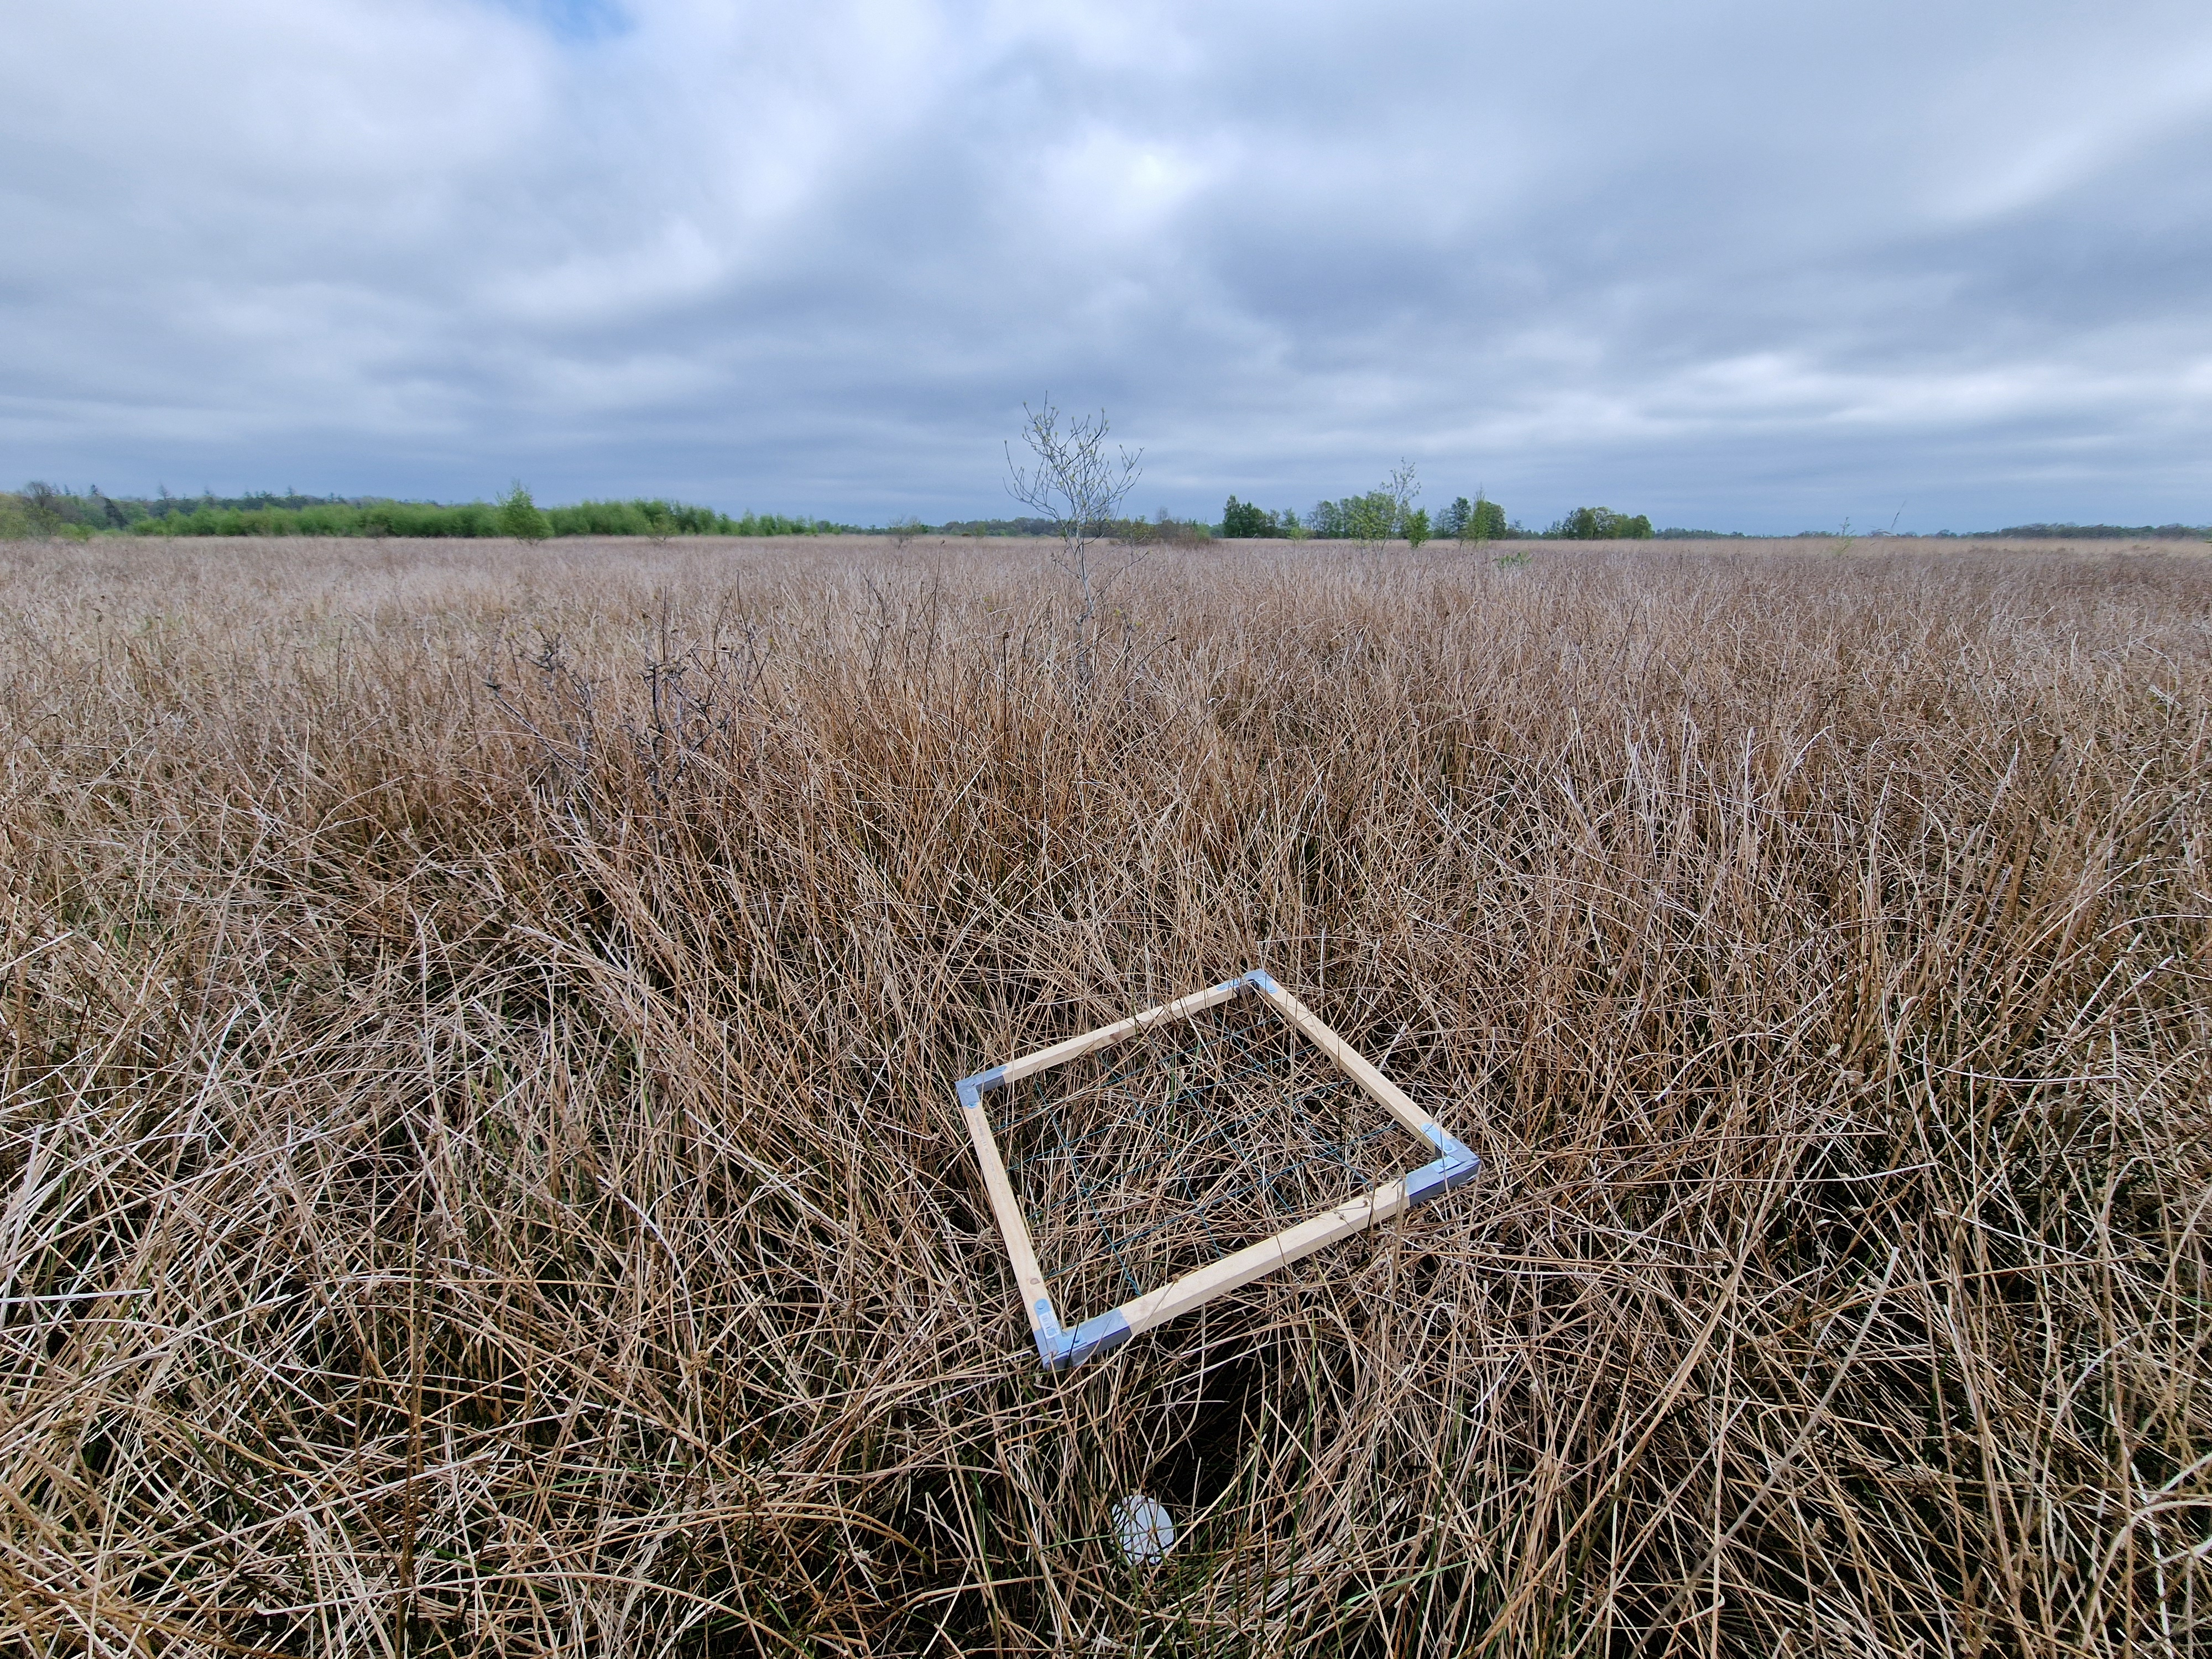
Our EcoFracNetbiodiversity monitoring project is gathering momentum. Over the past months, we’ve been roaming the Netherlands, clipboards in hand, from endless heathlands to city parks, to record plant diversity in hundreds of 1 m² plots. With several hundred plots under our belt, we’re starting to get a sense of what’s out there.
And one thing is clear: we’ve met a lot of monocultures.
A monoculture of Lolium perenne (perennial ryegrass)
Sometimes it’s a square meter with just one or maybe two plant species in them. Sometimes those monocultures stretch as far as the eye can see. But even a monoculture isn’t always what it seems.
We’ve seen Lolium perenne carpets dominating farmland. We’ve waded through dense stands of Juncus effusus in heathlands. We’ve recorded forest floors so acidic that no understory species survives. We’ve found stubborn patches of Poa annua pushing through cracks in concrete jungles.
EcoFracNet sample site in a sea of Juncus effusus (soft rush) in the Fochteloerveen.
When low diversity hides a surprise
However, not all monocultures tell the same ecological story.
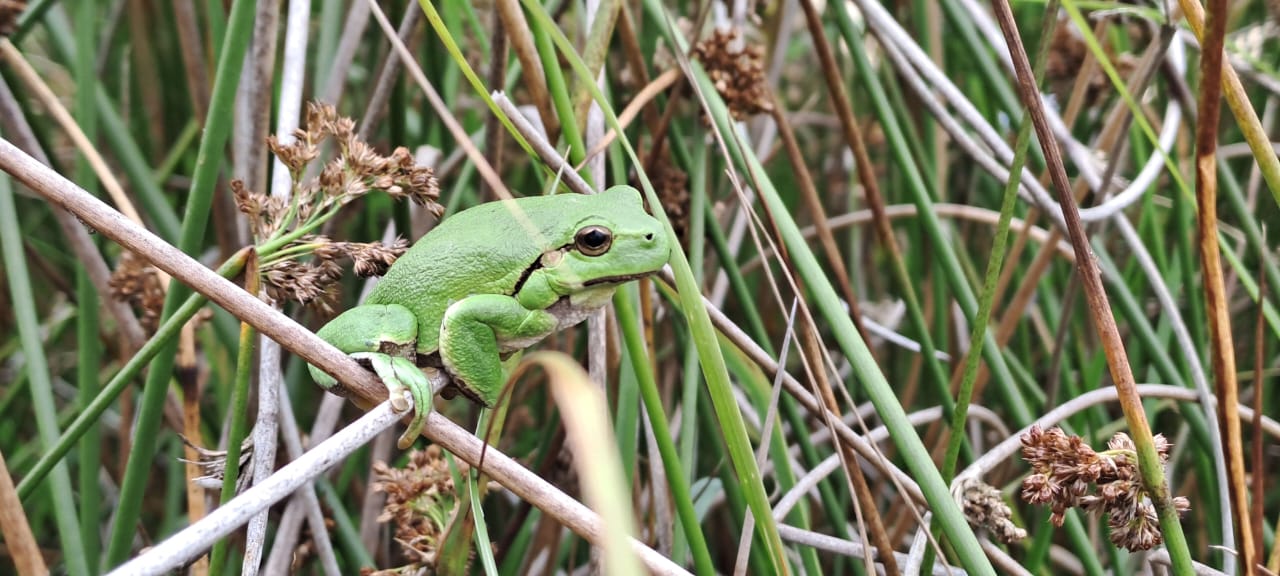
One of my all-time favourite plots was a dense Juncus field in the Fochteloërveen. Just one boring square meter of Juncus in a see of Juncus, surrounded by Juncus… But then, in that montoneous sea, we spotted a small, bright-green jewel among the rushes – a tree frog, a rare amphibian I had simply never seen before, and right there inside our plot.
European tree frog – as surprised as we were to find him in our plot!
That encounter was a good reminder: low plant diversity doesn’t always mean a lifeless ecosystem. In the Fochteloërveen, the oftentimes poor vegetation still hosts a rich community of animals and soil microbes. But in other places – like in the middle of an intensively managed farmland – a monoculture might be the symptom of an ecosystem stripped of complexity from top to bottom.
Looking beyond the plants
At this stage, we don’t yet know which is which in most of our sites, as any site can surprise you in both directions. That’s why the next steps in EcoFracNet are so important. Future field seasons will expand beyond plants to include animal monitoring, soil biodiversity sampling, and measures of ecosystem functioning. That way, we can piece together how biodiversity at different scales contributes to the way ecosystems work — or don’t.
A virtual monoculture of pines in the ‘Utrechtse Heuvelrug’
A question for you
All these monocultures made us curious: where in the Netherlands would we find the highest plant diversity?
We’d love your suggestions – especially if you know great spots in Zeeland or Utrecht.
And if all this sounds intriguing, you can still join EcoFracNet and help monitor your favourite patch of nature. Whether your site is a botanical treasure trove or a stubborn monoculture, every plot adds a valuable piece to the puzzle!
Not entirely devoid of species – but pretty close to it!
We had a hunch: the biogeography of soil microbial communities was going to be messy. Even less than plants or animals, microbes aren’t paying attention to the broad-brush macroclimatic gradients that ecologists often use to explain species distributions. They live and die by local conditions – the pH, the nutrients, the temperature fluctuations, the root exudates – exactly where they are.
That’s the theory, at least. But testing it has been hard. Soils are notoriously tricky – both to sample and to analyze – especially at the scale needed to disentangle regional and local drivers across landscapes.
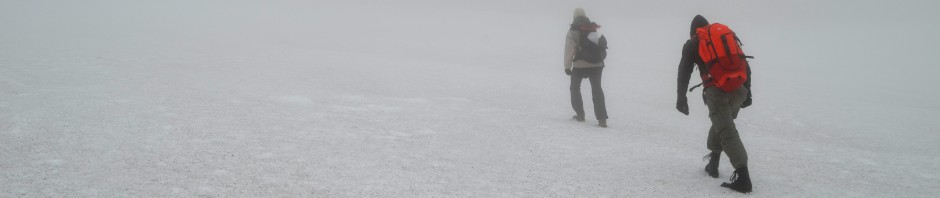
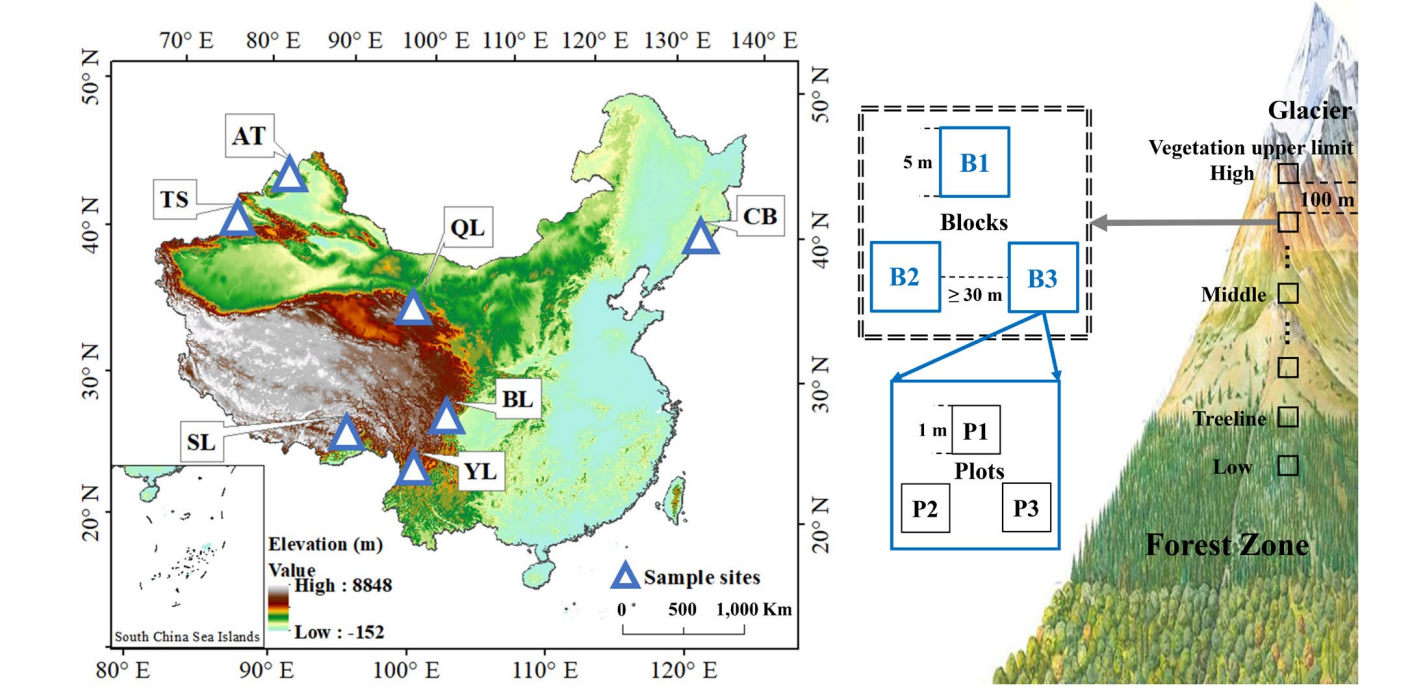
Now, a new study led by Kunwei Wang and a team from Northeast Normal University in China has taken a solid stab at this challenge. By collecting soil samples from across seven mountain transects spanning much of China’s vast climatic range, we set out to explore the spatial variation in soil microbial communities across a broad biogeographic scale – but with the resolution to zoom in on what’s happening locally.
Sampled mountains across China (left), and the fine-scale elevational sampling scheme on each mountain (right).
One of the clearest findings? A surprisingly relatively consistent hump-shaped pattern in microbial biomass. Across all mountains, microbial biomass peaked at or around the treeline. That’s fascinating – it suggests that the treeline isn’t just a conspicuous boundary for aboveground vegetation, but a key ecological transition belowground as well.
Patterns of soil microbial biomass (SMB), microbial biomass carbon (MBC), and microbial biomass nitrogen (MBN) relative to the treeline. Peaks occur relatively consistently around the treeline, followed by a decline into alpine tundra.
Microbial communities care most about the here and now
But the most revealing result came from the drivers of microbial variation. Above the treeline, local environmental variables (like soil pH, nutrients, and local temperature) explained far more of the variation in microbial biomass, carbon, and nitrogen than regional climate did.
In other words: macroclimate matters less than micro-conditions once you’re in the alpine zone.
Parameter estimates of key environmental drivers for SMB, MBC, and MBN. Bottom row: Explained variance grouped by factor type (climate, soil, etc.), split between areas above and below the treeline.
This finding supports what many microbial ecologists have of course long known – that microbes live in a world of fine-scale variation, and that their distributions are far more tightly coupled to immediate environmental conditions than to broader climatic envelopes.
Why does this matter?
There are a few reasons why this matters – and why we need more of this kind of research.
First, it reinforces that understanding microbial biogeography means getting dirty, quite literally. We need high-resolution, site-level data on soils and microclimates to predict how microbial communities vary across space and respond to change. Macroclimate alone won’t cut it.
Second, and perhaps more implicative, it suggests that the effects of climate warming on soil microbes may be buffered by local environmental filters. If you want to know how a microbial community will respond to a changing climate, you need to know what’s happening in the top few centimeters of soil, not just what the nearest weather station is reporting.
This also implies that other anthropogenic drivers, like pollution, land use change, and physical disturbance, may become even more critical in shaping soil microbial dynamics in alpine ecosystems, as these often mess strongly with these local soil conditions that are so critical for soil microbes,
The take-home message?
Soil microbial biogeography is messy — beautifully, chaotically, locally messy. And that’s not a bad thing. But it does mean we need to shift our perspective if we want to understand or model belowground ecosystems. The fine print of the soil matters.
And the treeline? It’s not just a line in the landscape. It’s a biogeographical boundary that shapes life above and below the surface.
Find the paper here: Kunwei Wang et al. (2025) Biogeographic Patterns of Soil Microbial Biomass in Alpine Ecosystems Depend on Local Rather Than Regional Drivers. Global ecology and biogeography.
Lake Törnetrask, Abisko Research Station, Abisko, Sweden
Epilobium angustifolium
Narvik, Norway
Norway, Narvik
Skjomen valley, northern Norway
Norway
Skjomen valley, northern Norway
Skjomen valley, northern Norway
Lake Torneträsk, Abisko, Sweden
Summer in the Skjomen valley, northern Norway
Luscinia svecica
Luscinia svecica, Abisko, Sweden
Sweden
Lake Törnetrask, Abisko Research Station, Abisko, Sweden
Norway
Angelica archangelica
Angelica archangelica along mountain road in the northern Scandes, Norway
Saxifraga aizoides, Narvik, Norway
Luscinia svecica, Abisko, Sweden
Laktatjakka valley
Skjomen valley, northern Norway
Pinus sylvestris, Narvik, Norway
Lake Torneträsk, Abisko, Sweden
Diapensia lapponica in one of our plots
Norway
Narvik, Norway
Seen from Nuolja, Abisko
Eriophorum vaginatum
Laktatjakka valley
Abisko, Sweden
Lake Torneträsk, Abisko, Sweden
Hair’s tail cotton grass
Phyllodoce caerulea
Skjomen valley, northern Norway
Trifolium repens
Narvik, Norway
Common heather
Hallerbos 2017
Young bluebell (Hyacinthoides non-scripta) surrounded by flowers of yellow archangel (Lamium galeobdolon)
The common bluebell (Hyacinthoides non-scripta), the signature flower of the Hallerbos
Single bluebell flower surviving on a wetter spot, as indicated by the field of wild garlic (Allium ursinum)
A really wet patch of forest, with giant horsetail (Equisetum telmateia) in a field of wild garlic (Allium ursinum)
Wild garlic (Allium ursinum) in the Hallerbos flowers a bit later than the bluebells, yet this one was already in full bloom
A bumblebee visiting yellow archangel (Lamium galeobdolon)
A bumblebee visiting yellow archangel (Lamium galeobdolon)
Wild garlic (Allium ursinum)
Wild garlic (Allium ursinum)
Weirdly beautiful, the inflorescence of pendulous sedge (Carex pendula), typical for the wettest spots in the forest
Weirdly beautiful, the inflorescence of pendulous sedge (Carex pendula), typical for the wettest spots in the forest
A little stream in the Hallerbos, surrounded by endless fields of wild garlic (Allium ursinum)
The herb-paris (Paris quadrifolia), less common in the forest
Wild garlic (Allium ursinum)
Bluebells (Hyacinthoides non-scripta)
Weirdly beautiful, the inflorescence of pendulous sedge (Carex pendula), typical for the wettest spots in the forest
Another one from the wet plots: large bitter-cress (Cardamine amara)
Another one from the wet plots: large bitter-cress (Cardamine amara)
Young beech leaves, as soon as they are fully grown, spring in the understory is over
A beech forest without understory, most likely too dry and too acid for any survivors
A young beech seedling (Fagus sylvatica), looking nothing like a beech, yet everything like a tiny dancer
Young beech seedling (Fagus sylvatica)
Bluebells (Hyacinthoides non-scripta)
Bluebells (Hyacinthoides non-scripta)
Bluebells (Hyacinthoides non-scripta)
Mountain melick (Melica nutans), a grass in the most amazing green
Bluebells (Hyacinthoides non-scripta) in a rare patch of mountain melick (Melica nutans), a grass in the most amazing green
Bluebells (Hyacinthoides non-scripta)
Bluebells (Hyacinthoides non-scripta)
Montpellier 2017
The entrance to the cathedral of Montpellier
The cathedral of Montpellier
The entrance to the cathedral of Montpellier
The cathedral of Montpellier
Narcissus poetics
The cathedral of Montpellier
The botanical garden of Montpellier
The botanical garden of Montpellier
The botanical garden of Montpellier
Brackish Camargue vegetation
Brackish Camargue vegetation
Brackish Camargue vegetation
A typical lagune
Brackish Camargue vegetation
Camargue horses
Camargue horses
Camargue horses
Brackish Camargue vegetation
Brackish Camargue vegetation
Brackish Camargue vegetation
Camargue horses
Brackish Camargue vegetation
Little egret in the evening sun
Flamingo’s in the evening sun
A typical lagune
Dandelion fuzz
Grass lily
Grass lily
Dandelion fuzz
Veronica in a sea of poplar fluff
Euphorbia in a sea of poplar fluff
Poplar
Gare du Midi, Brussels
Gare du Midi, Brussels
Gare du Midi, Brussels
Gare du Midi, Brussels
Sweden autumn 2016
Autumn in Abisko
Yellow leaves of mountain birch, with lake Torneträsk in the background.
Lapporten, the gate to Lapland, in Abisko
Rain blowing over the Abisko National Park
The colours of the north: red fireweed and yellow mountain birches, with lake Torneträsk on the background
Yellow leaves of mountain birch, with lake Torneträsk in the background.
Rain on the background, the ski lift in Abisko on the foreground
The steep slope of mount Nuolja on a dramatic looking morning
The beautiful colors of lake Torneträsk in Abisko
A little stream on top of the mountain, with a view on Lapporten, the gate to Lapland
Well, that is a beautiful table with a nice view on lake Torneträsk in Abisko
Our little experiment on top of the mountain in Abisko, with a view on Lapporten
Autumn in Abisko is extremely colorfull
The ski lift with a view on Abisko National Park and Lapporten
Hiking dowhill towards lake Torneträsk
This green is greener than the greenest green: moss on top of mount Nuolja
Well, that is a beautiful table with a nice view on lake Torneträsk in Abisko
The ski lift with a view on Abisko National Park and Lapporten
The ski lift with a view on Abisko National Park and Lapporten
The most beautiful hiking trail of the world: Nuolja in Abisko
Angelica archangelica, often the biggest plant of the Arctic
The most beautiful hiking trail of the world: Nuolja in Abisko
Cirsium helenioides, the melancholy thistle
Hiking down mount Nuolja
The steep slope of mount Nuolja on a dramatic looking morning
The colours of the north: red fireweed and yellow mountain birches, with lake Torneträsk on the background
The prettiest yellow and blue: autumn in Abisko
Fireweed, Epilobium angustifolium
Campanula or bellflower, I think ‘uniflora’
Vaccinium myrtillus
Cornus suecica, the prettiest red of the world
Hieracium alpinum, alpine hawkweed
Carex atrata, one of my favourite sedges
Alpine clubmoss, Diphasiastrum alpinum
Agrostis capillaris, bentgrass
Common yarrow (Achillea millefolium)
Anthoxanthum odoratum, sweet vernal grass, fully grown and mature
Snow scooter trail
Our plot in the mids of a field of horsetails (Equisetum pratense)
Equisetum pratense
Cliff overlooking the valley with the road to Norway
Seedling of Taraxacum officinale, the dandelion, after two years of growing in bad conditions
Poa alpina, the alpine meadow-grass, with its viviparous seeds
Massive flowerhead of Angelica archangelica
Angelica archangelica
Blueberry (Vaccinium myrtillus) in autumn
A lowland marsh in Abisko in autumn
Installing the plots of our trail observations on top of mount Nuolja
Installing the plots of our trail observations on top of mount Nuolja
Tanacetum vulgare (Tansy), non-native for the high north
Autumn forest down in the valley
The valley of Nuolja to Björkliden
Summer on the Nuolja-side
A full rainbow behind mount Nuolja in Abisko
It’s raining in the west, clouds trapped behind the mountains
A strong wind blowing rain from behind the mountains to our side
A strong wind blowing rain from behind the mountains to our side
Betula nana, the dwarf birch, mini autumn forest
Betula nana, the dwarf birch, mini autumn forest
The valley of Björkliden in autumn
The valley of Björkliden in autumn
The valley of Björkliden in autumn
The valley of Björkliden in autumn
Sweden spring 2016
The valley of the lakes
Trifolium pratense
Trifolium repens
Bartsia alpina
Silene acaulis
Western European species like the red clover (Trifolium pratense) here are often listed as non-native species in mountain regions.
Although the alpine zone has been harder for invasives to access than most places, human structures like trails are often an easy gateway for the invaders to get up there. Picture from Abisko, Swedish Lapland.
Cornus suecica
Salix reticulata
Overlooking the valley of Laktajakka
Ranunculus glacialis
A rainy hike
Oxyria digyna
Rubus arcticus
Silene suecica
Eriophorum vaginatum
Ranunculus glacialis
Melting snowpatch on a lake
Dryas octopetala
Amiens
The southern side
Amiens is filled with cute little houses
Sunny but cold, the Quai Bélu
Frozen to the bone
Sun rising above the water
The museum behind the beautiful gates
Cathedral at night
Colourful mirror
View from my office window
Enjoying silence and the morning sun
Sunny but cold, the Quai Bélu
Cold!
Cathedral at night
Just outside of Amiens
Nice architectural curve
Cathedral at night
Cathedral at night
Le Club d’Aviron in winter weather
Maria without a shirt
Cathedral with a glimpse of spring
Winter sun on the Place du Don
Gargoyle planning to eat the cathedral
Frozen mirror
Almost cold enough for ice-skating
View from my office window
House on the square before the cathedral
Cathedral seen from the frozen Parc Saint-Pierre
Sweden autumn 2015
Lichen
Sweden summer 2015
View on the 1000 meter plots
Doing research on a cold Arctic morning
Plots flooded by the snowmelt
Flooded by the snowmelt
Meltwater river, racing down the mountain
After a hike, even the most basic house looks cosy. Little hut in the mountains, open for everybody
Snowbridge, maybe don’t cross…
Snowbridge
View from a cliff
Silene acaulis or cushion pink, cutest plant of the Arctic
Two seasons in one image
Steep slope
Hiking down
Narvik Kirche, church of the subarctic
Narvik Kirche
Reindeer on top of the mountain
Narvik Kirche
Summer at the church
Summer flowers
Massive waterfall
Young willow catkins
View from Narvik’s hospital, with lilac flowers
Building a bridge over the fjord will gain al drivers at least an hour
Norwegian fjord
Posing with the water, getting soaked
Minimalistic mountains
Insect investigating our reindeer antler
Catching mosquitoes with our license plate, harvest of the year!
Posing with the plot
Fieldwork on the most beautiful spot of the world
Fieldwork on the most beautiful spot of the world
Summer bridge – still next to the sadly impassable river
Rhinanthus flower in the mountains
Plateau in the valley, beautiful brown
Experimental view from my favourite plot
Salix catkins
Extremely old Betula tree
Waterfall from a cliff
Buttercup is the earliest in spring, here
Rocks!
Alpine views
Views!
Fieldwork
Jumping over rivers
Plot
Golden plover
Angry lemming
Green, the whole north is green!
Snow, so much snow left!
Minimalistic mountain moments
Fieldwork
The research center
Red clover – focal invader
Look at this tiny cute snail!
Massive floods of melting water
Bartsia alpina
Hooray, a toilet!
Dryas octopetala
Lowest elevation plots
Butterball!
That’s a lot of water
Midnight sun is the best
At the lakeside
Beautiful Bistorta vivipara
Don’t fall in the water
Midnight sun
Wild river
Art – made by ages of wild rivers
Baby firework for America’s independence day
Midnight sun at the lake
The Abisko canyon was wilder than ever
That’s a crazy amount of water!
The Abisko canyon was wilder than ever
The Abisko canyon was wilder than ever
Black and white
Stone-man overlooking Abisko
Nothing as soft as a willow catkin
Label and soil temperature sensor attached
I’d drive to the top every day
Reflections
Rocks and clouds
Brave little birch
Brewing our camping poison
Basic camping stuff
Camping in Norway
Home-made temperature houses
Roadside research at its best
Norway is crazy
Horsetail is so funny
Little creek in magical forest
Birches, birches everywhere
Beautiful rock, a gift from the river
Another roadside fellow
Lichen
Ready to rock the summer
Collecting mosses
That’s a crazy old lichen
Tiny tiny piny trees, but old, so old!
Ready to jump into the fjord?
Ready to jump into the fjord?
That’s a spiky stone!
Views on Norwegian fjords
Silene in the mountains
Cute little orchid
Skua
Attacking skua, mind your heads!
Watch out for the attack of the fierce skua!
Black snail
New plot!
Still a lot of snow to melt, but this spot was free for a new plot
Reindeer are better than people
Two seasons in one picture
Let’s see what is happening to the balance in mountains! Is this a starting avalanche, or will it last a bit longer?
Cute little hut
Climbing mountains by car
Softest moss in history
Drosera in the marsh
Hiking in no-man’s land
The clouds are coming
Abisko valley
‘Butterball’
Fieldwork in the tundra
Abisko valley
Little plot
Clouds and sun and mountains
Making soup on a campfire with a view
Little creek on high elevations
Skua on the look-out
Melting snow in a river
Rhodiola rosea and the Törnetrask lake
Beginning of spring
Flooded plots, melting snow, impassible wetness
Ferns and horsetails
Chile 2015
Lunch made by our local colleague, with funny bread (tasty as well!)
Trips to the field sites were sometimes a real adventure, especially right after snowmelt


")


")
")


")


")


")


")

")


