Ten practical guidelines

One of the biggest dreams when we started the SoilTemp project was not only to bring together all available microclimate data into a single, unified database but also to align how we think about and measure microclimate. Today, we are excited to share a major step toward achieving that goal: our new paper, “Ten practical guidelines for microclimate research in terrestrial ecosystems“, is now published in Methods in Ecology and Evolution.

This paper provides exactly what every graduate student and researcher in ecology and biogeography has been waiting for: a comprehensive guide on everything you need to consider when integrating microclimate monitoring into your research. From defining why you need microclimate data, to determining what and where to measure, and deciding on how and when to collect your data, this paper has it all. It doesn’t stop there either: it also walks you through compiling, analyzing, and publishing your microclimate data in ways that maximize impact and accessibility.

The why, what, how, when and where of microclimate monitoring, as well as site-specific characteristics to think about. A series of questions everyone has to go through when designing the microclimate component of their study, and the paper walks you through each and every one of them.

It’s quite the giant of a paper as well, trying to go sufficiently in depth with all these aspects of the question to have practical relevance, and to really put you on the road to a successful microclimate project.

Microclimate research is of course not done once the data comes in. Part two of the paper guides you through your selection of reference data, how to compile your microclimate time series, the basics of microclimate data analysis and the publication of your data open access and, of course, into the SoilTemp database!

Where to measure?

One of my favorite parts of the paper – to name just one – focuses on where to measure microclimate. This section emphasizes the importance of matching spatial resolution and extent to the scale at which your study organisms experience their environment. It highlights the nested, hierarchical nature of microclimates: locally measured conditions (temperature, moisture, wind) are shaped by a combination of local, regional, and global climatic signals.

The nested nature of microclimates. Locally measured microclimate (e.g. temperature, moisture, wind) always represents a combination of local, regional and global climate signals. At each scale from macro to micro, climatic gradients can be unfolded, just like replicated geometric shapes in a fractal.

That chapter explores the concept of proximal microclimate, which refers to how closely microclimate measurements represent the actual conditions experienced by organisms. Proximal microclimate goes beyond simply placing sensors: it considers both the spatial and temporal alignment of measurements with biological processes. By addressing this, researchers can better connect microclimate data to ecological responses.

Additionally, we introduce practical approaches like stratified random sampling to select logger locations. This technique helps ensure that you capture as much environmental variation as possible, maximizing the value and representativeness of your dataset.

No ‘one-size-fits-all’ solution—and that’s okay!

Importantly, the paper doesn’t promise a single ‘golden rule’ to every microclimate monitoring challenge. There’s no universal sensor, setup, or methodology that works for all studies—and that’s because each research question is unique. What the paper does offer is a clear framework to help you identify the best strategy for your specific case, taking into account the unique characteristics of your study system.

Building on the latest advances in microclimate research

In addition to its practical advice, the paper builds on the latest advances in microclimate science, making it an invaluable resource for both beginners and experts. It not only provides you with step-by-step guidance but also connects you to a carefully curated list of must-read references in the field.

As you can expect, we are incredibly excited about this paper finally seeing the light of day, and hope it will inspire and support researchers around the world in designing successful microclimate studies.


Read the full paper here

Key takeaway: Microclimate research is a complex but essential part of understanding terrestrial ecosystems. With these ten practical guidelines, you’ll be better equipped to design, execute, and share impactful microclimate research—and maybe even contribute your data to the SoilTemp database!
Posted in General | Tagged , , , , | Leave a comment

🌿 Can we mitigate global drought using vegetation-driven rainfall? 🌧️

Check out this inspiring and creative video by our ecology students at Utrecht University! Combining humor, innovation, and scientific depth, they shine a spotlight on an urgent global issue: drought and its devastating impact on ecosystems, livelihoods, and the climate. Most importantly, they explore how nature itself can play a pivotal role in the solution

This project marks my first experience supporting students in this particular science communication exercise, and I couldn’t be prouder of their work. They’ve transformed complex ecological concepts—like the biotic pump theory and precipitation corridors—into an engaging, accessible, and thought-provoking story.

First time for me supporting students in this science communication exercise, and I found it quite refreshing. It’s a fun way to dive deep into a topic and find a way to communicate scientific complexities to a broad audience.

🌍 Why does it matter?
Forests are more than just carbon sinks; they are powerful drivers of the hydrological cycle, influencing rainfall patterns even far from coasts. Deforestation and drought amplify climate change effects, from biodiversity loss to increased wildfire risks. Strategic reforestation and conservation efforts could unlock nature’s ability to cool the planet and sustain life, offering hope for a more resilient future.

Posted in Science | Tagged , , , , , , | Leave a comment

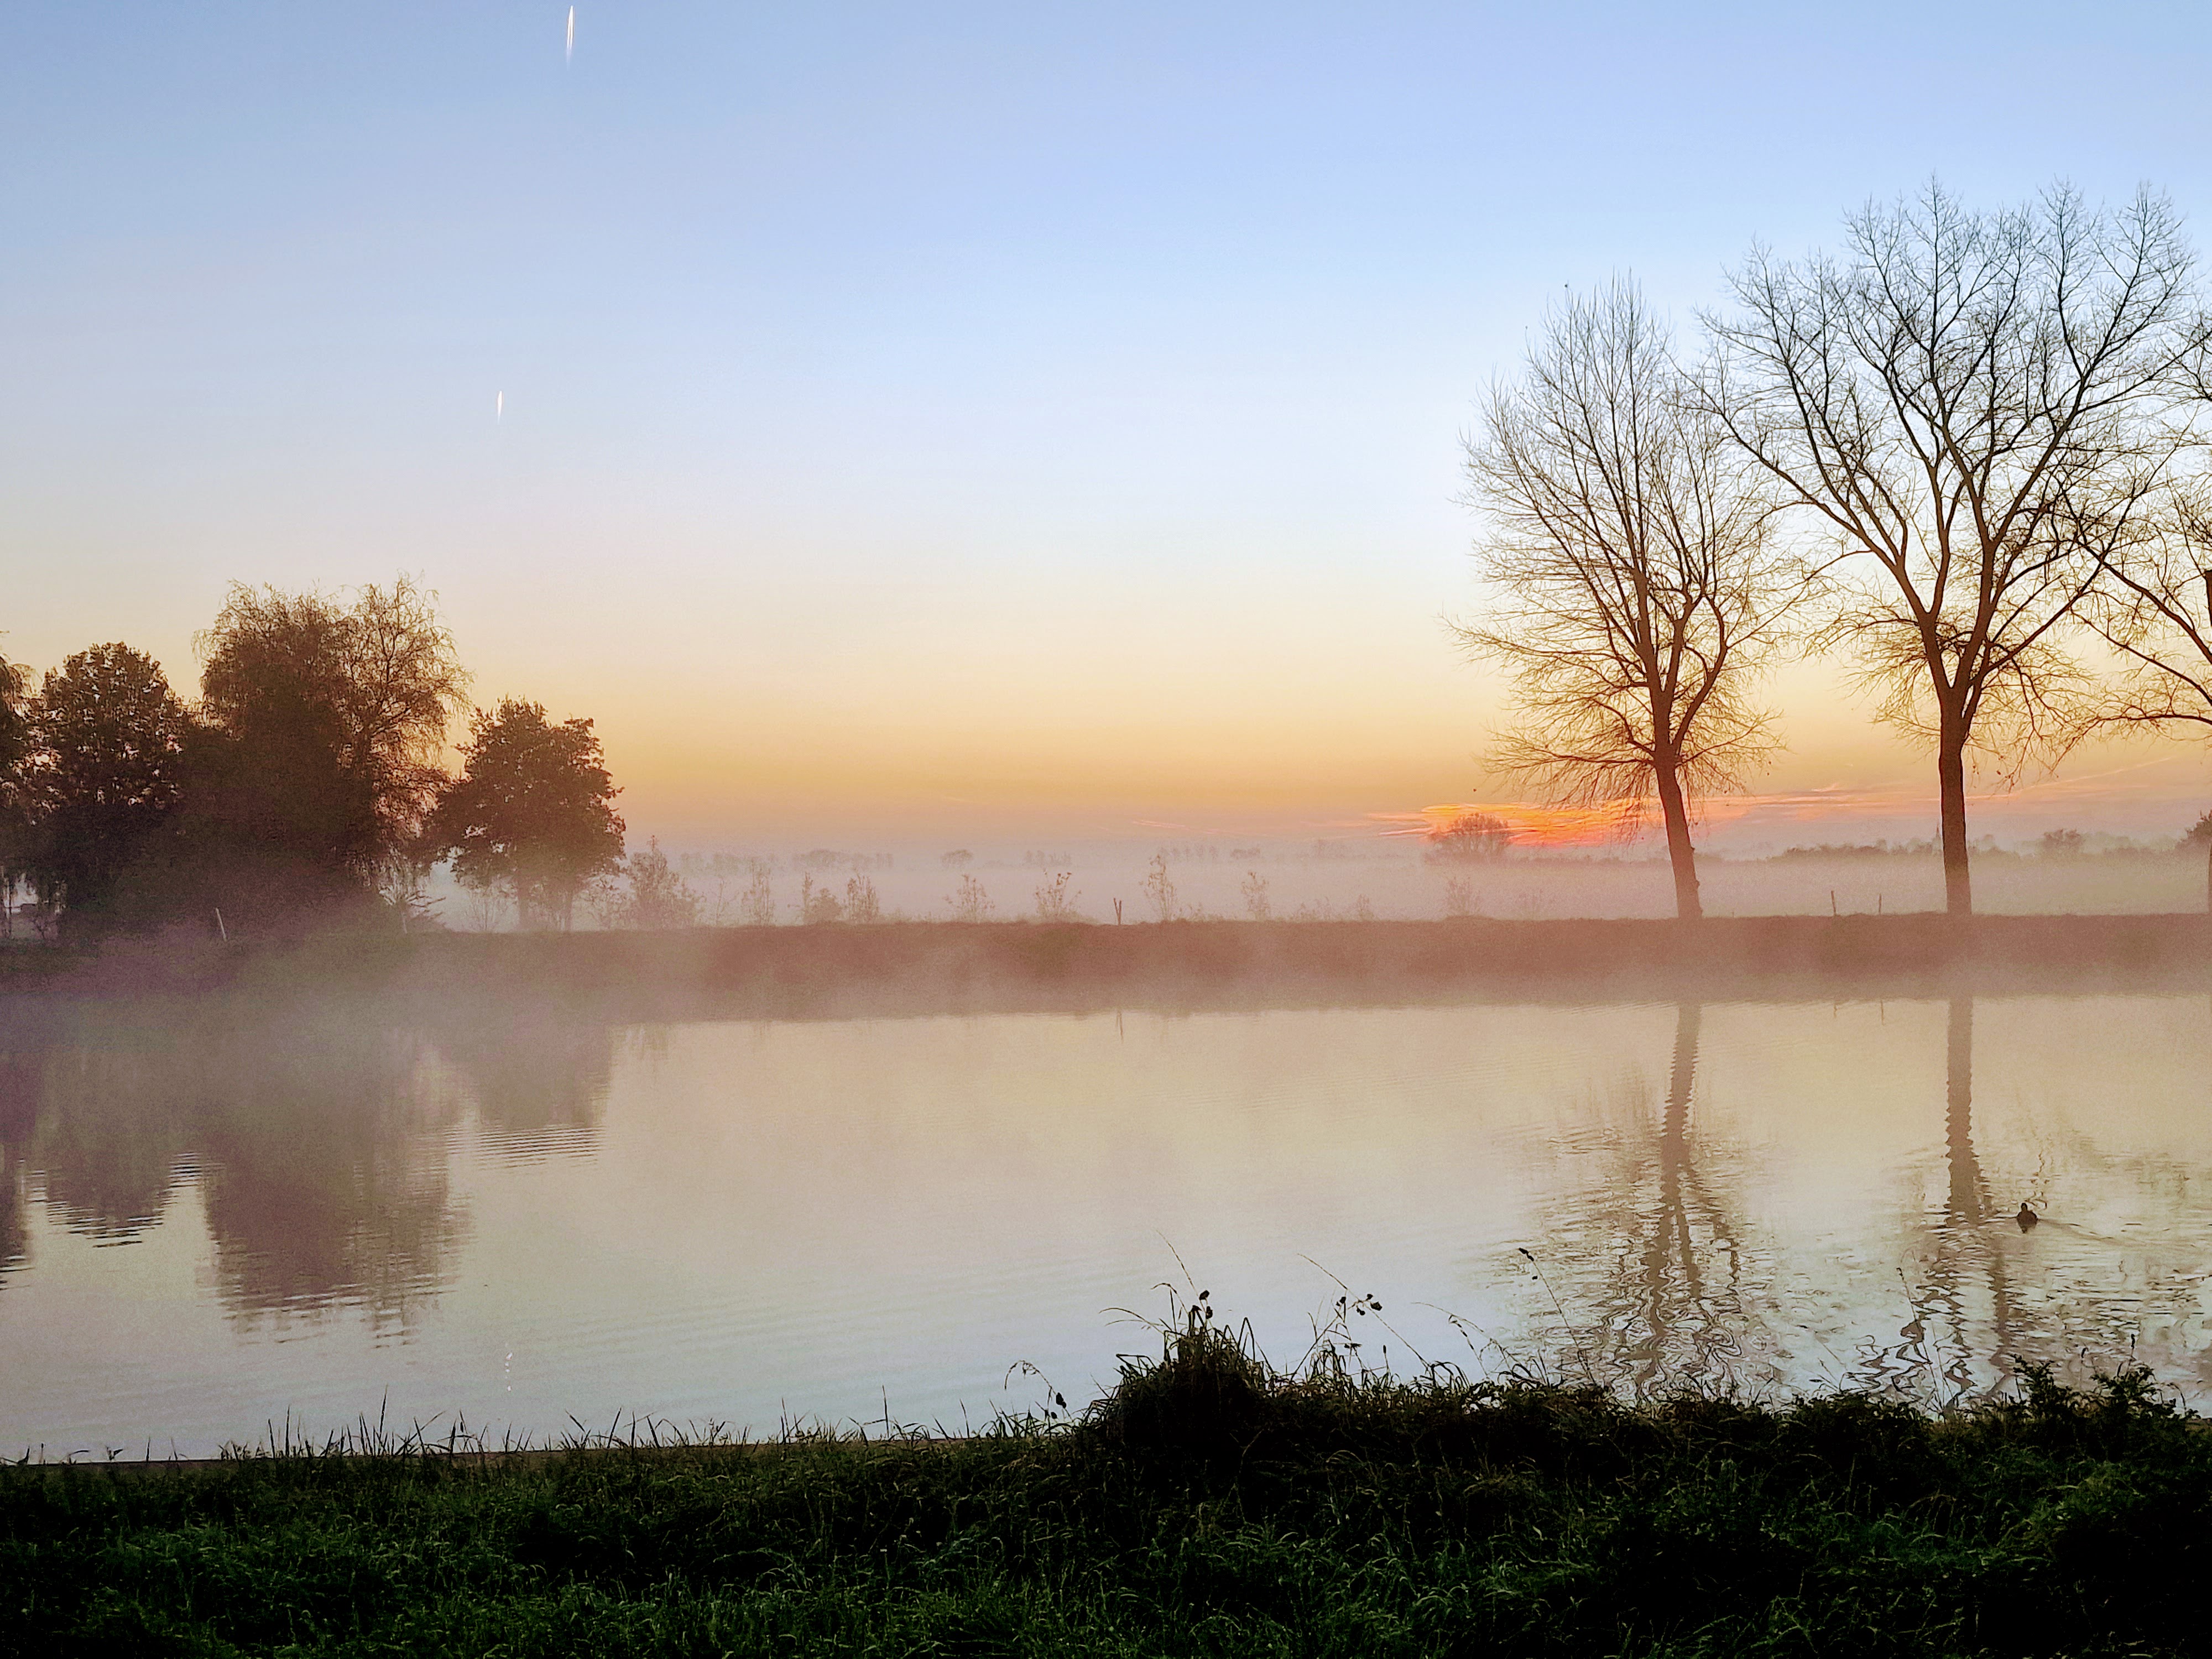
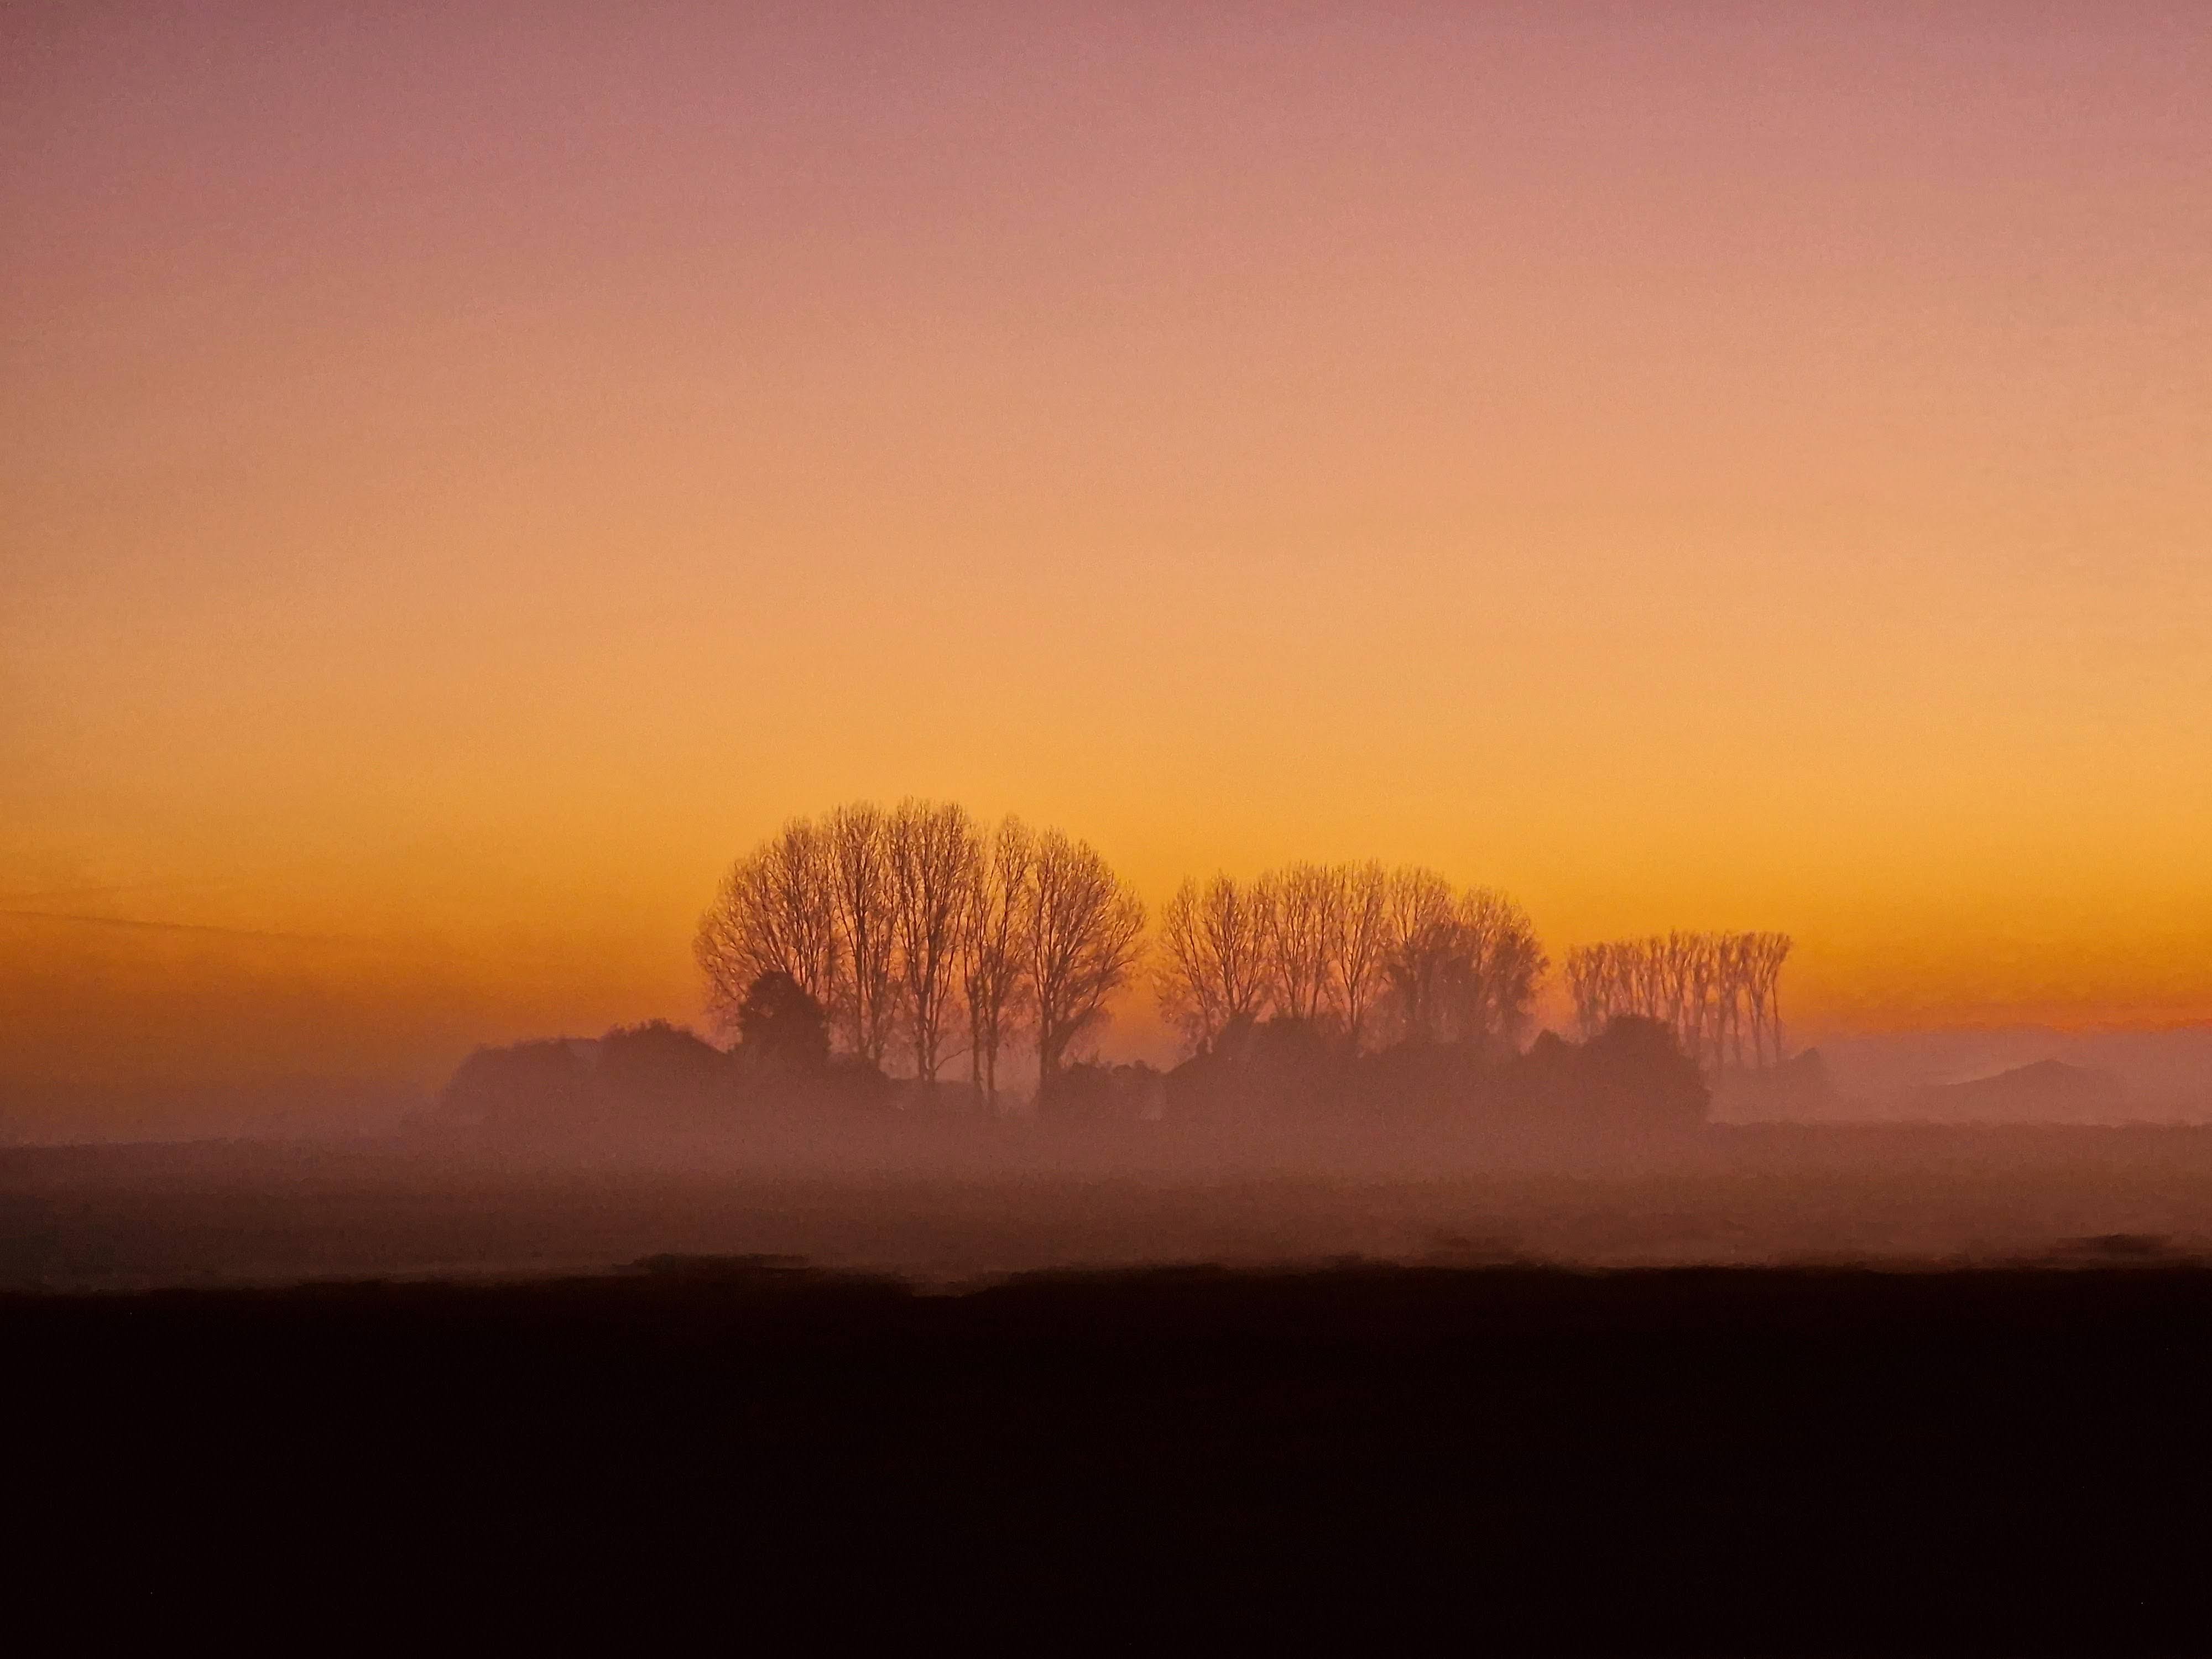
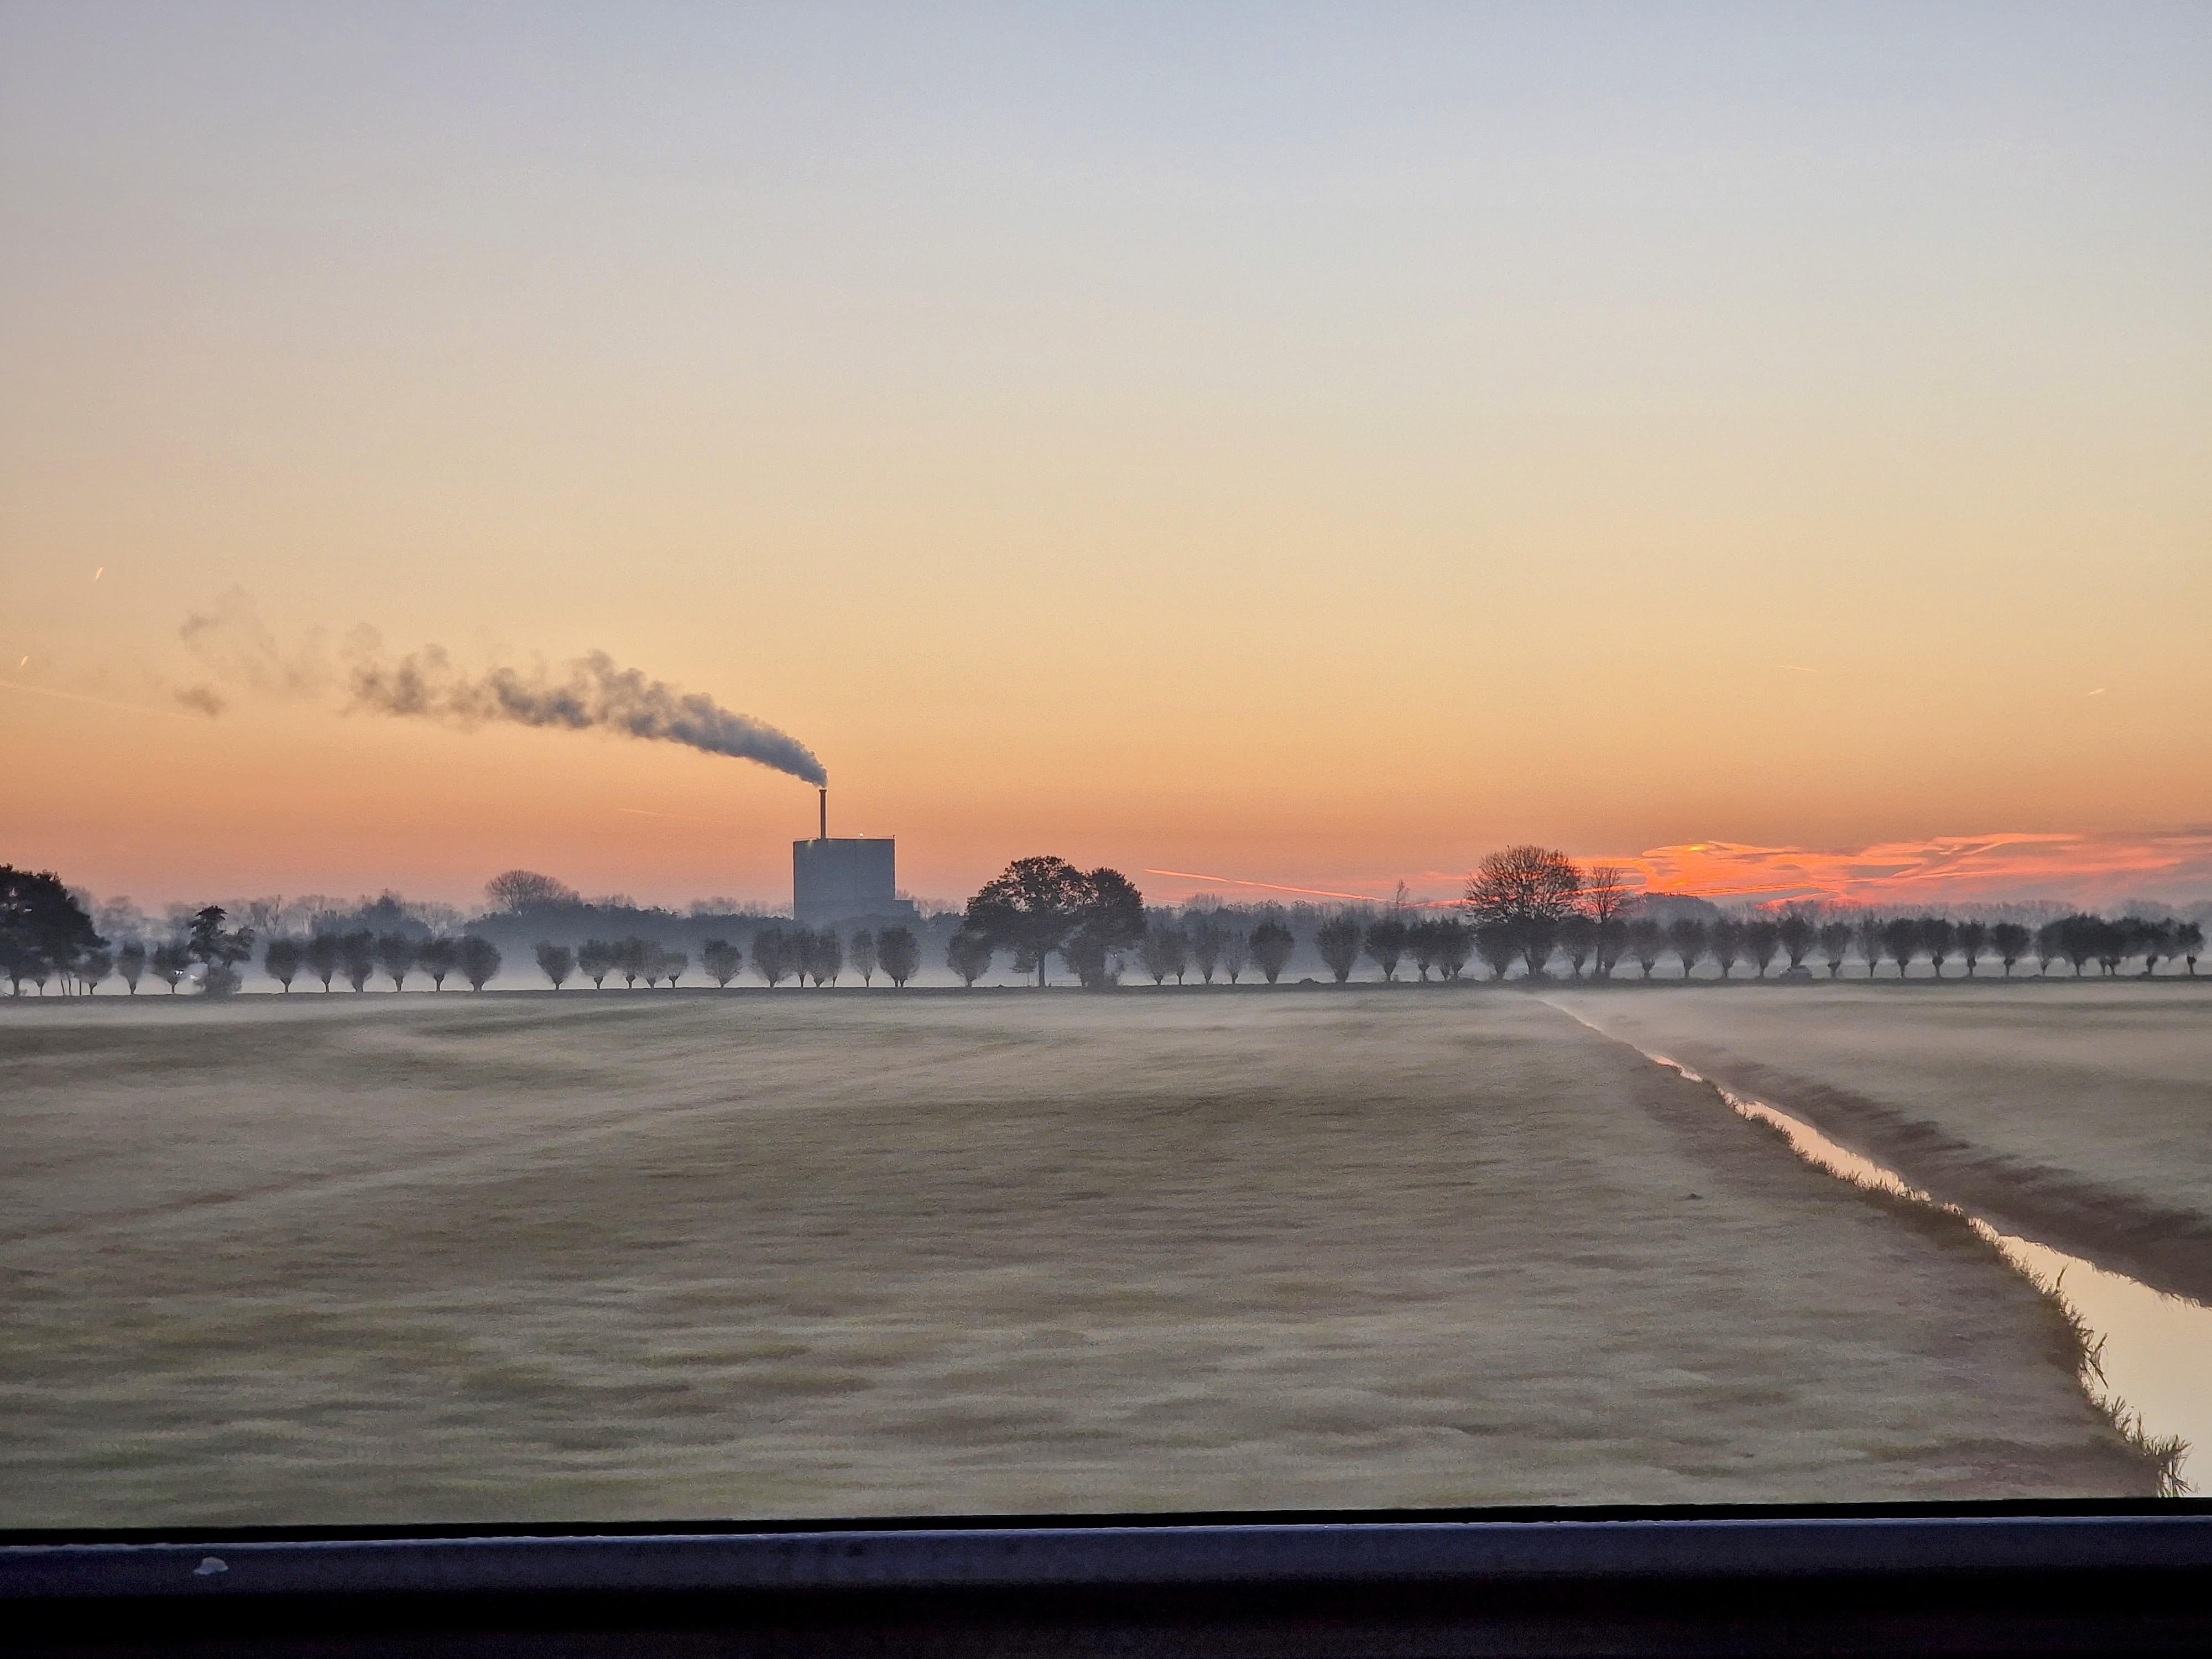
The fog lifts over Dutch nature

Dutch nature on a foggy morning, seen from my car in the traditional traffic jam on the A27 from Breda to Utrecht

I’m starting something new and I’m SUPER excited: a new project that perfectly aligns with my new role as an assistant professor in ecological scaling—and builds naturally on the work I’ve been doing so far: the Dutch branch of EcoFracNet!

EcoFracNet is a global biodiversity monitoring network with a unique, standardized “fractal” design. This setup involves systematically spaced plots at various scales, making it an ideal way to investigate the scale at which biodiversity changes—right in line with my research interests.

Lingering mist over a Dutch field. The Netherlands are an unusual case due to their virtual lack of topography. What does that do to the scale at which biodiversity varies? And how does human land use and nature management affect that scale? We plan to find out!

In this Dutch edition, we’ll be applying EcoFracNet’s design across a wide range of iconic habitats, from forests, grasslands, heathlands, and dunes to bogs, agricultural fields, and even gardens. Our goal is to examine just how diverse these habitats are and to identify the scales at which biodiversity patterns emerge within them. We’ll then compare these patterns to global data, exploring how factors like topography, microclimate, soil conditions, and human land use drive biodiversity at multiple scales.

The ‘Triangle’ – De ‘Driehoek’ – a small patch of nature managed by the biology students at Utrecht University and the first field site of our measurement campaign.

We officially launched the project this week at our first field site, conveniently located at Utrecht Science Park. This location is especially fitting, as it doubles as a training ground for ecology students at Utrecht University. The project framework will give students hands-on experience and support them in developing their own research questions.

This isn’t a short-term endeavor, either—we’re in it for the long haul. By committing to long-term monitoring, we’ll capture not only spatial diversity but also changes over time, allowing us to quantify year-to-year variation and track the long-term effects of management practices and global change.

Natural patches in the Netherlands are often very small, while most of the green space is filled with agricultural monocultures. I am curious to see how much diversity – and at which scales – we can still unearth!

Interested? I bet you are! Get in touch and we’ll talk about it!

Posted in Netherlands | Tagged , , , , , , , , , , , | 1 Comment

Nitrogen deposition and distribution shifts of forest plants

It intuitively makes a lot of sense, doesn’t it? As the climate warms, species should be moving north, racing to stay within the climatic conditions they can survive in.

So, naturally, we thought the same when we set out to monitor long-term shifts in the distribution of forest understory plants, expecting to find a dominant northward migration. Except, that wasn’t at all what we found…

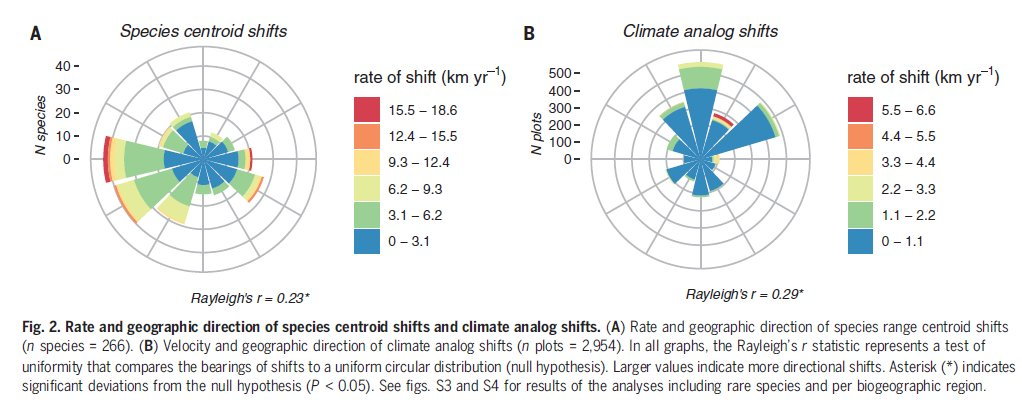
In fact, the actual trends were very striking: forest plants were 2.6 times more likely to move westward than northward. And this wasn’t just some fluke—this finding comes from the ‘ForestREPlot’ database, which compiles repeated surveys of forest understories from across Europe. It’s a remarkable dataset, tracking over 3,000 semi-permanent plots that have been resurveyed over periods ranging from 13 to 67 (!) years.

We expected to see species migrating north to track the warming climate. In theory, the wind roses—visualizing shifts in species centroids and climate—should have aligned, with species following the northward drift of suitable climates. But the reality? Starkly different. Instead of predominantly northward shifts, species distributions were veering strongly east-west, often moving faster than the climate itself.

The power of this database lies in its ability to track long-term changes in species distributions across decades of global change. Moreover, by looking at both centroid shifts and colonization/extinction events, we were able to paint a comprehensive picture—not just of range edges, but of how entire species ranges are being reshaped. And the results, now published in Science, tell a clear story: northward movement is being eclipsed by these striking east-west shifts.

So, what’s driving this unexpected trend? After analyzing various potential global change drivers, the main culprit appears to be nitrogen deposition. Indeed, nitrogen-generalists are expanding westward, particularly into regions of Western Europe where nitrogen deposition has been strongest, such as Belgium and the Netherlands. While sulphur pollution from historical acid rain may have played a role, it doesn’t seem to be the primary factor here.

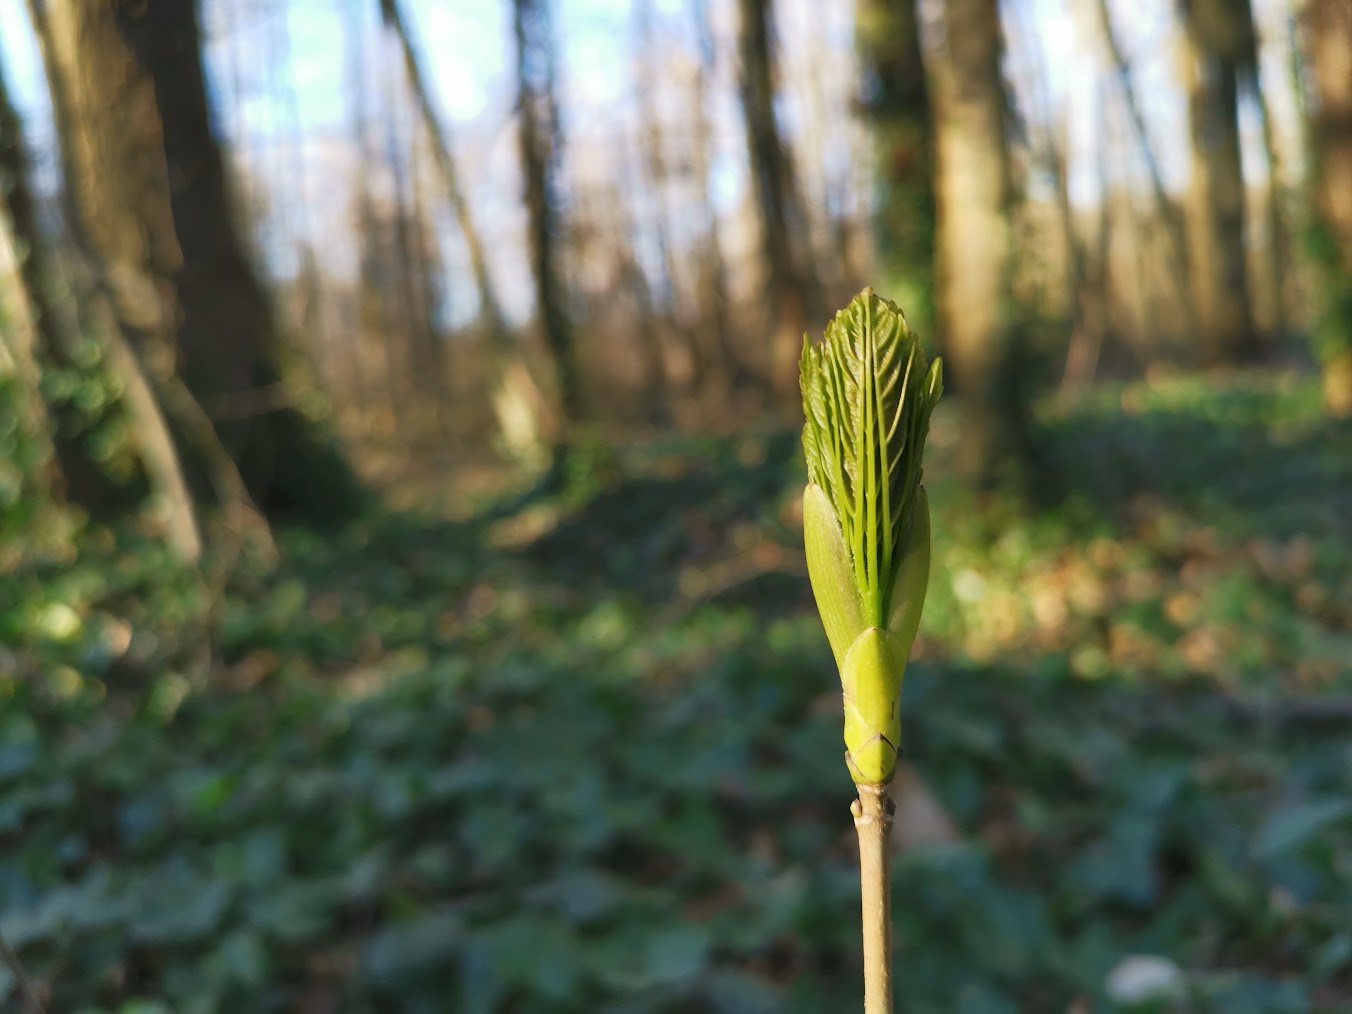
Budding seedling of Acer pseudoplatanus in a Belgian forest – one of the ‘winners’ of the study – strongly expanding its range.

As surprising as these findings may be, they actually align with some of our recent thinking about microclimate. We’ve been hypothesizing that plant movements wouldn’t necessarily mirror macroclimatic trends, since plants experience microclimates—which don’t show the same northward shifts as macroclimate data would suggest. While this microclimate buffering gave us hope, our new study reminds us that we can’t overlook other global change drivers. Their impact on biodiversity may be just as significant—if not more so—than climate change itself.

More information:

Posted in Science | Tagged , , , , , , , , | 2 Comments

An ecological data hypermarket?

For the past five years, I have led SoilTemp, the global database of microclimate data. I have witnessed its evolution from humble beginnings to a robust repository housing close to a 100,000 microclimate time series from around the world, several of which are linked to vegetation data from the same locations.

As the database has grown, so too has the variety of use cases. Researchers across microclimate studies, ecology, and beyond are increasingly reaching out to use all that data for a variety of needs. Many, for example, aim to connect in-situ microclimate data from SoilTemp to vegetation data to assess the buffering effects of vegetation or to explore how species distributions are influenced by microclimate.

But what if we could simplify this connection between the two? Currently, data contributors must format and upload their vegetation data to our database, creating redundancy when the same data exists in other databases. This reformatting leads to unnecessary duplication of effort.

Ideally, we wouldn’t need to reformat and resubmit vegetation data stored elsewhere; instead, we could directly access and extract it from those databases themselves!

That is my new BIG dream: to create a way to link existing ecological databases together for easy querying. For example, if I want temperature data from Dutch forests along with vegetation data from the same locations, I envision selecting coordinates and associated parameters on an online dashboard and sending requests to both SoilTemp and any open-access vegetation database that shares the same location. Or if I wish to model the impact of microclimate on root traits, I could reach out to a connected trait database for relevant data from nearby locations.

Wouldn’t that be incredible? I envision a nice and friendly user interface – an RShiny-app perhaps – where users could select locations and receive a list of ecological parameters stored in various open-access databases. These parameters could be from the exact same location, linked by their location name, or from a location nearby, sharing similar coordinates.

So, who’s with me in making this a reality? Are there database managers interested in collaborating on such a ‘SpiderWeb of Ecological Databases’ (SWED)? Or does a similar framework already exist, and we should simply connect SoilTemp to it? (Even better!)

We have some ideas on how to make this happen, but I want to hear from you first! Do you think this would be useful? What features should this imagined ‘SWED’ include? Am I reinventing the wheel, or is this concept as timely as I believe? Please share your thoughts!

Posted in General, Science | Tagged , , , , , , , , , , , , | Leave a comment

Throwback to MEB2024

The last week of August was marked in red and bold on many calendars: it was the week of the Microclimate Ecology & Biogeography conference, undoubtedly the most important event of the year for global microclimate research.

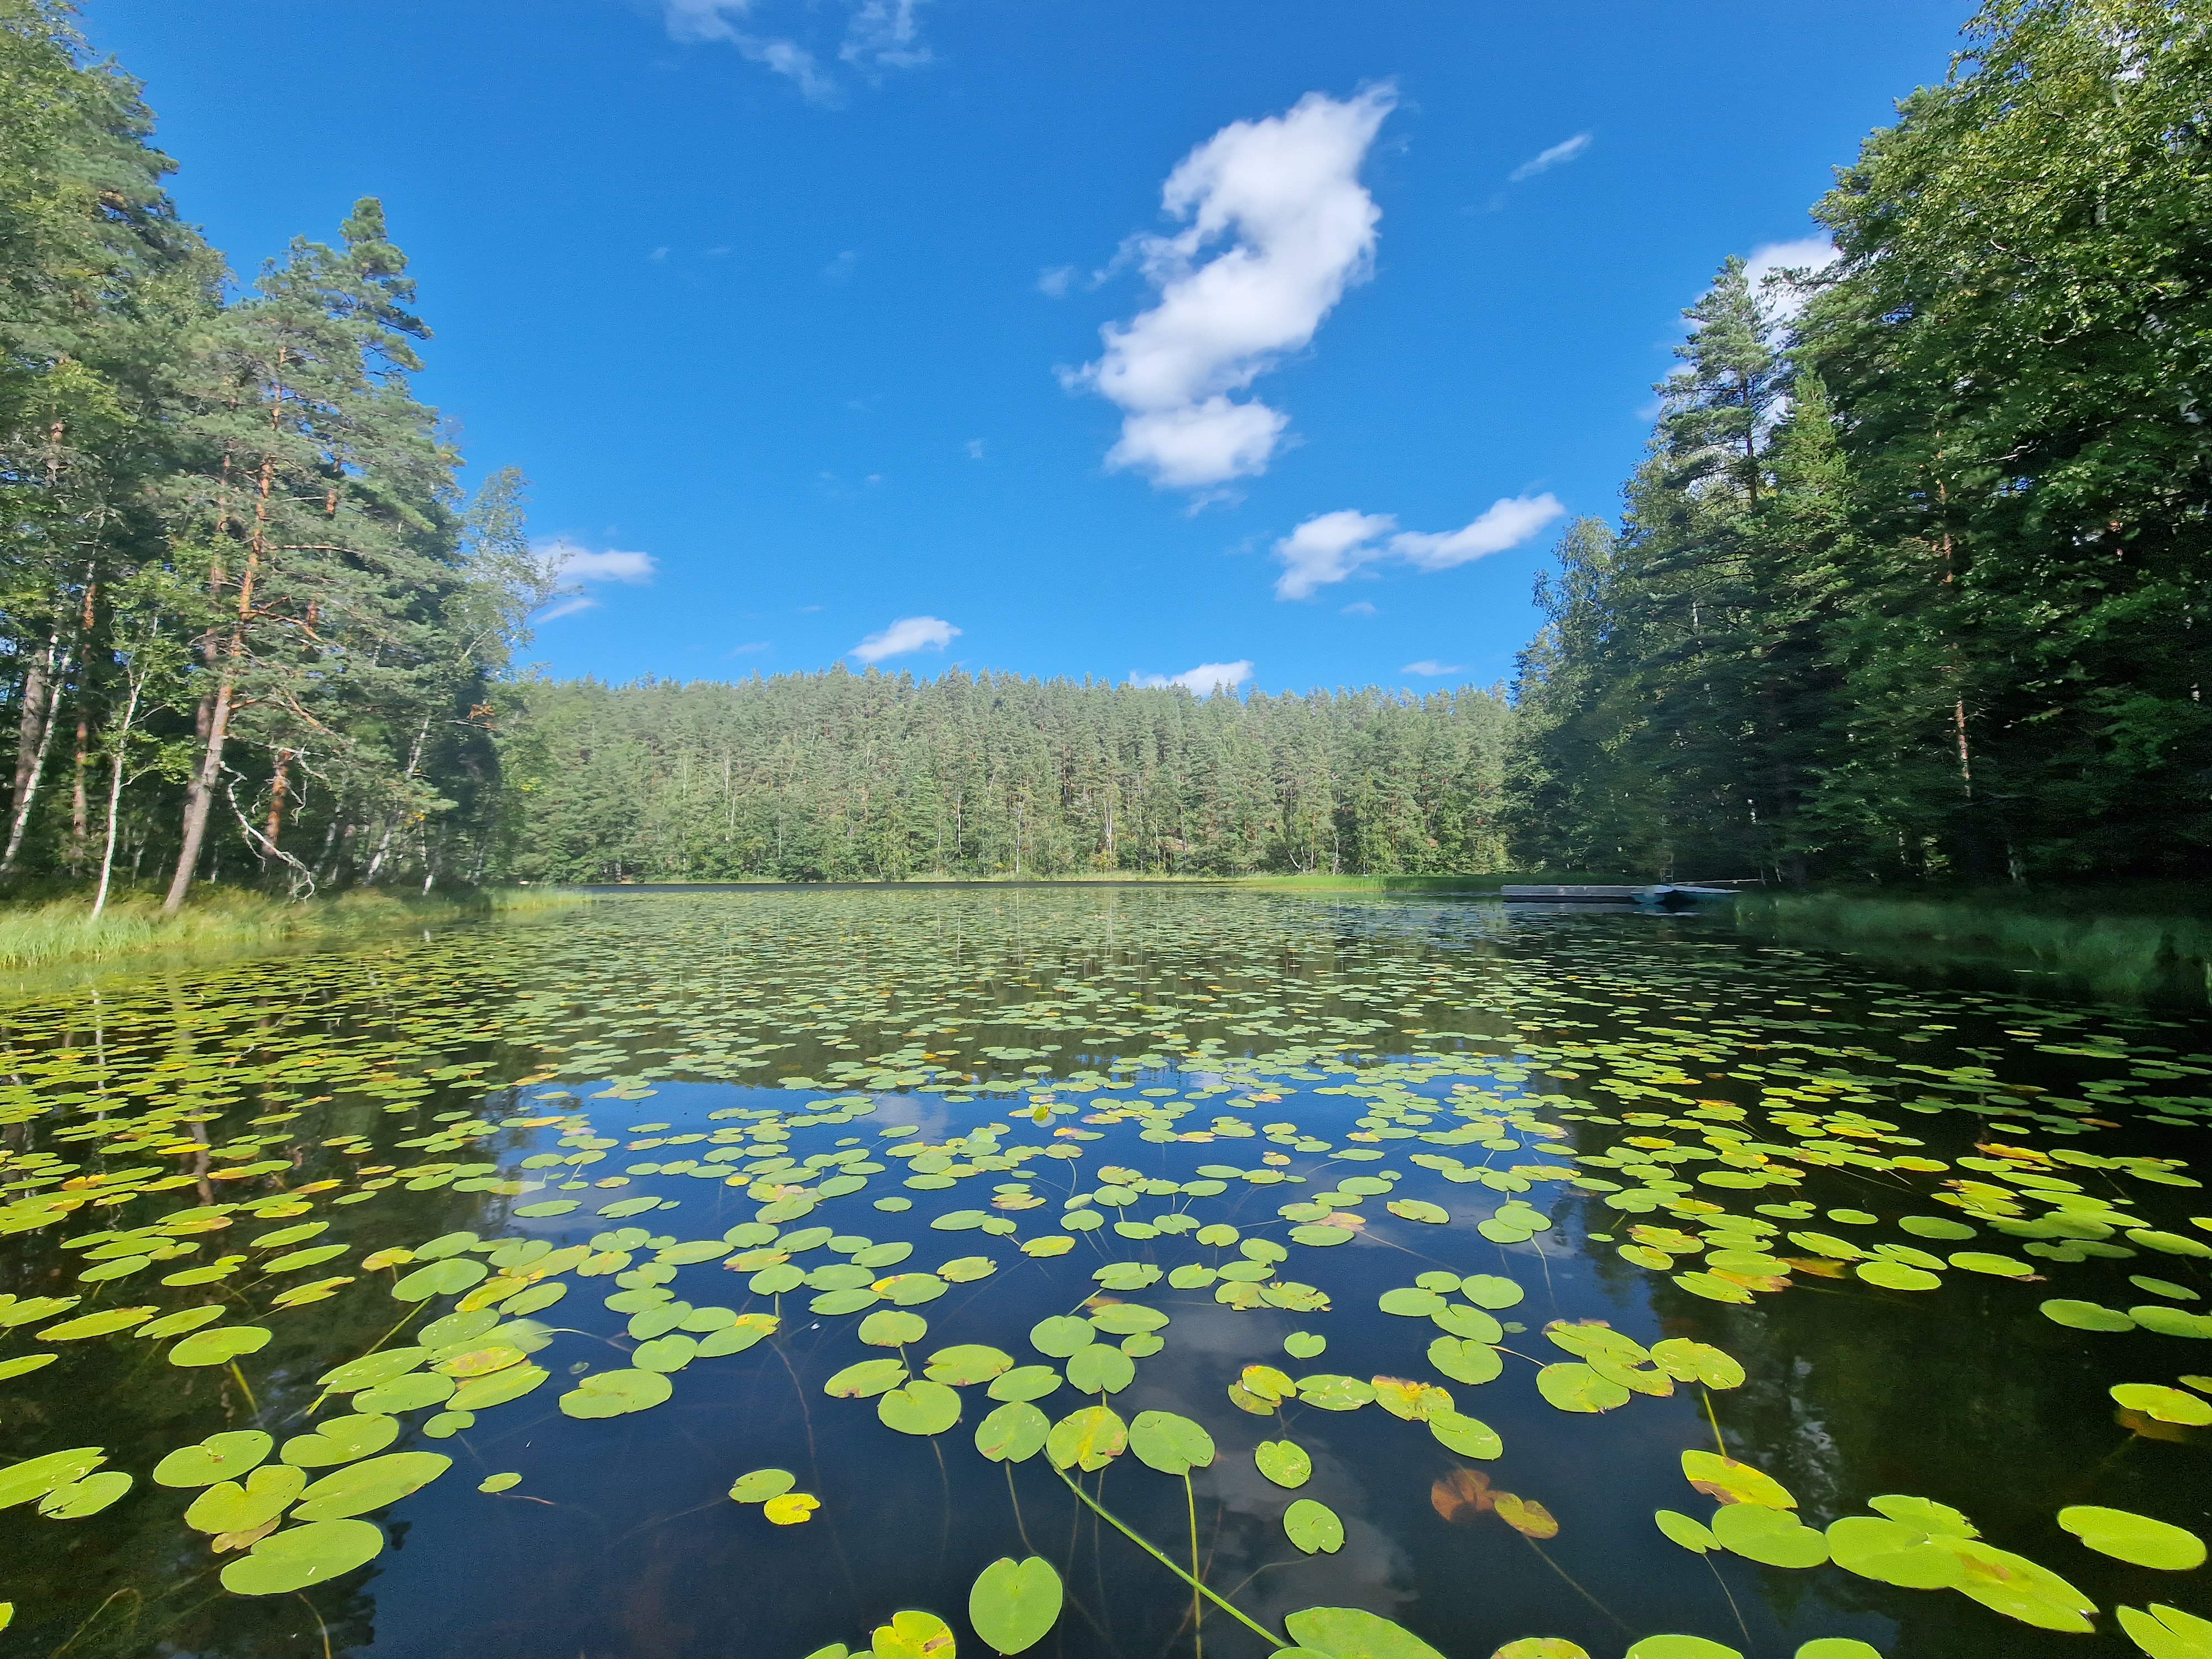
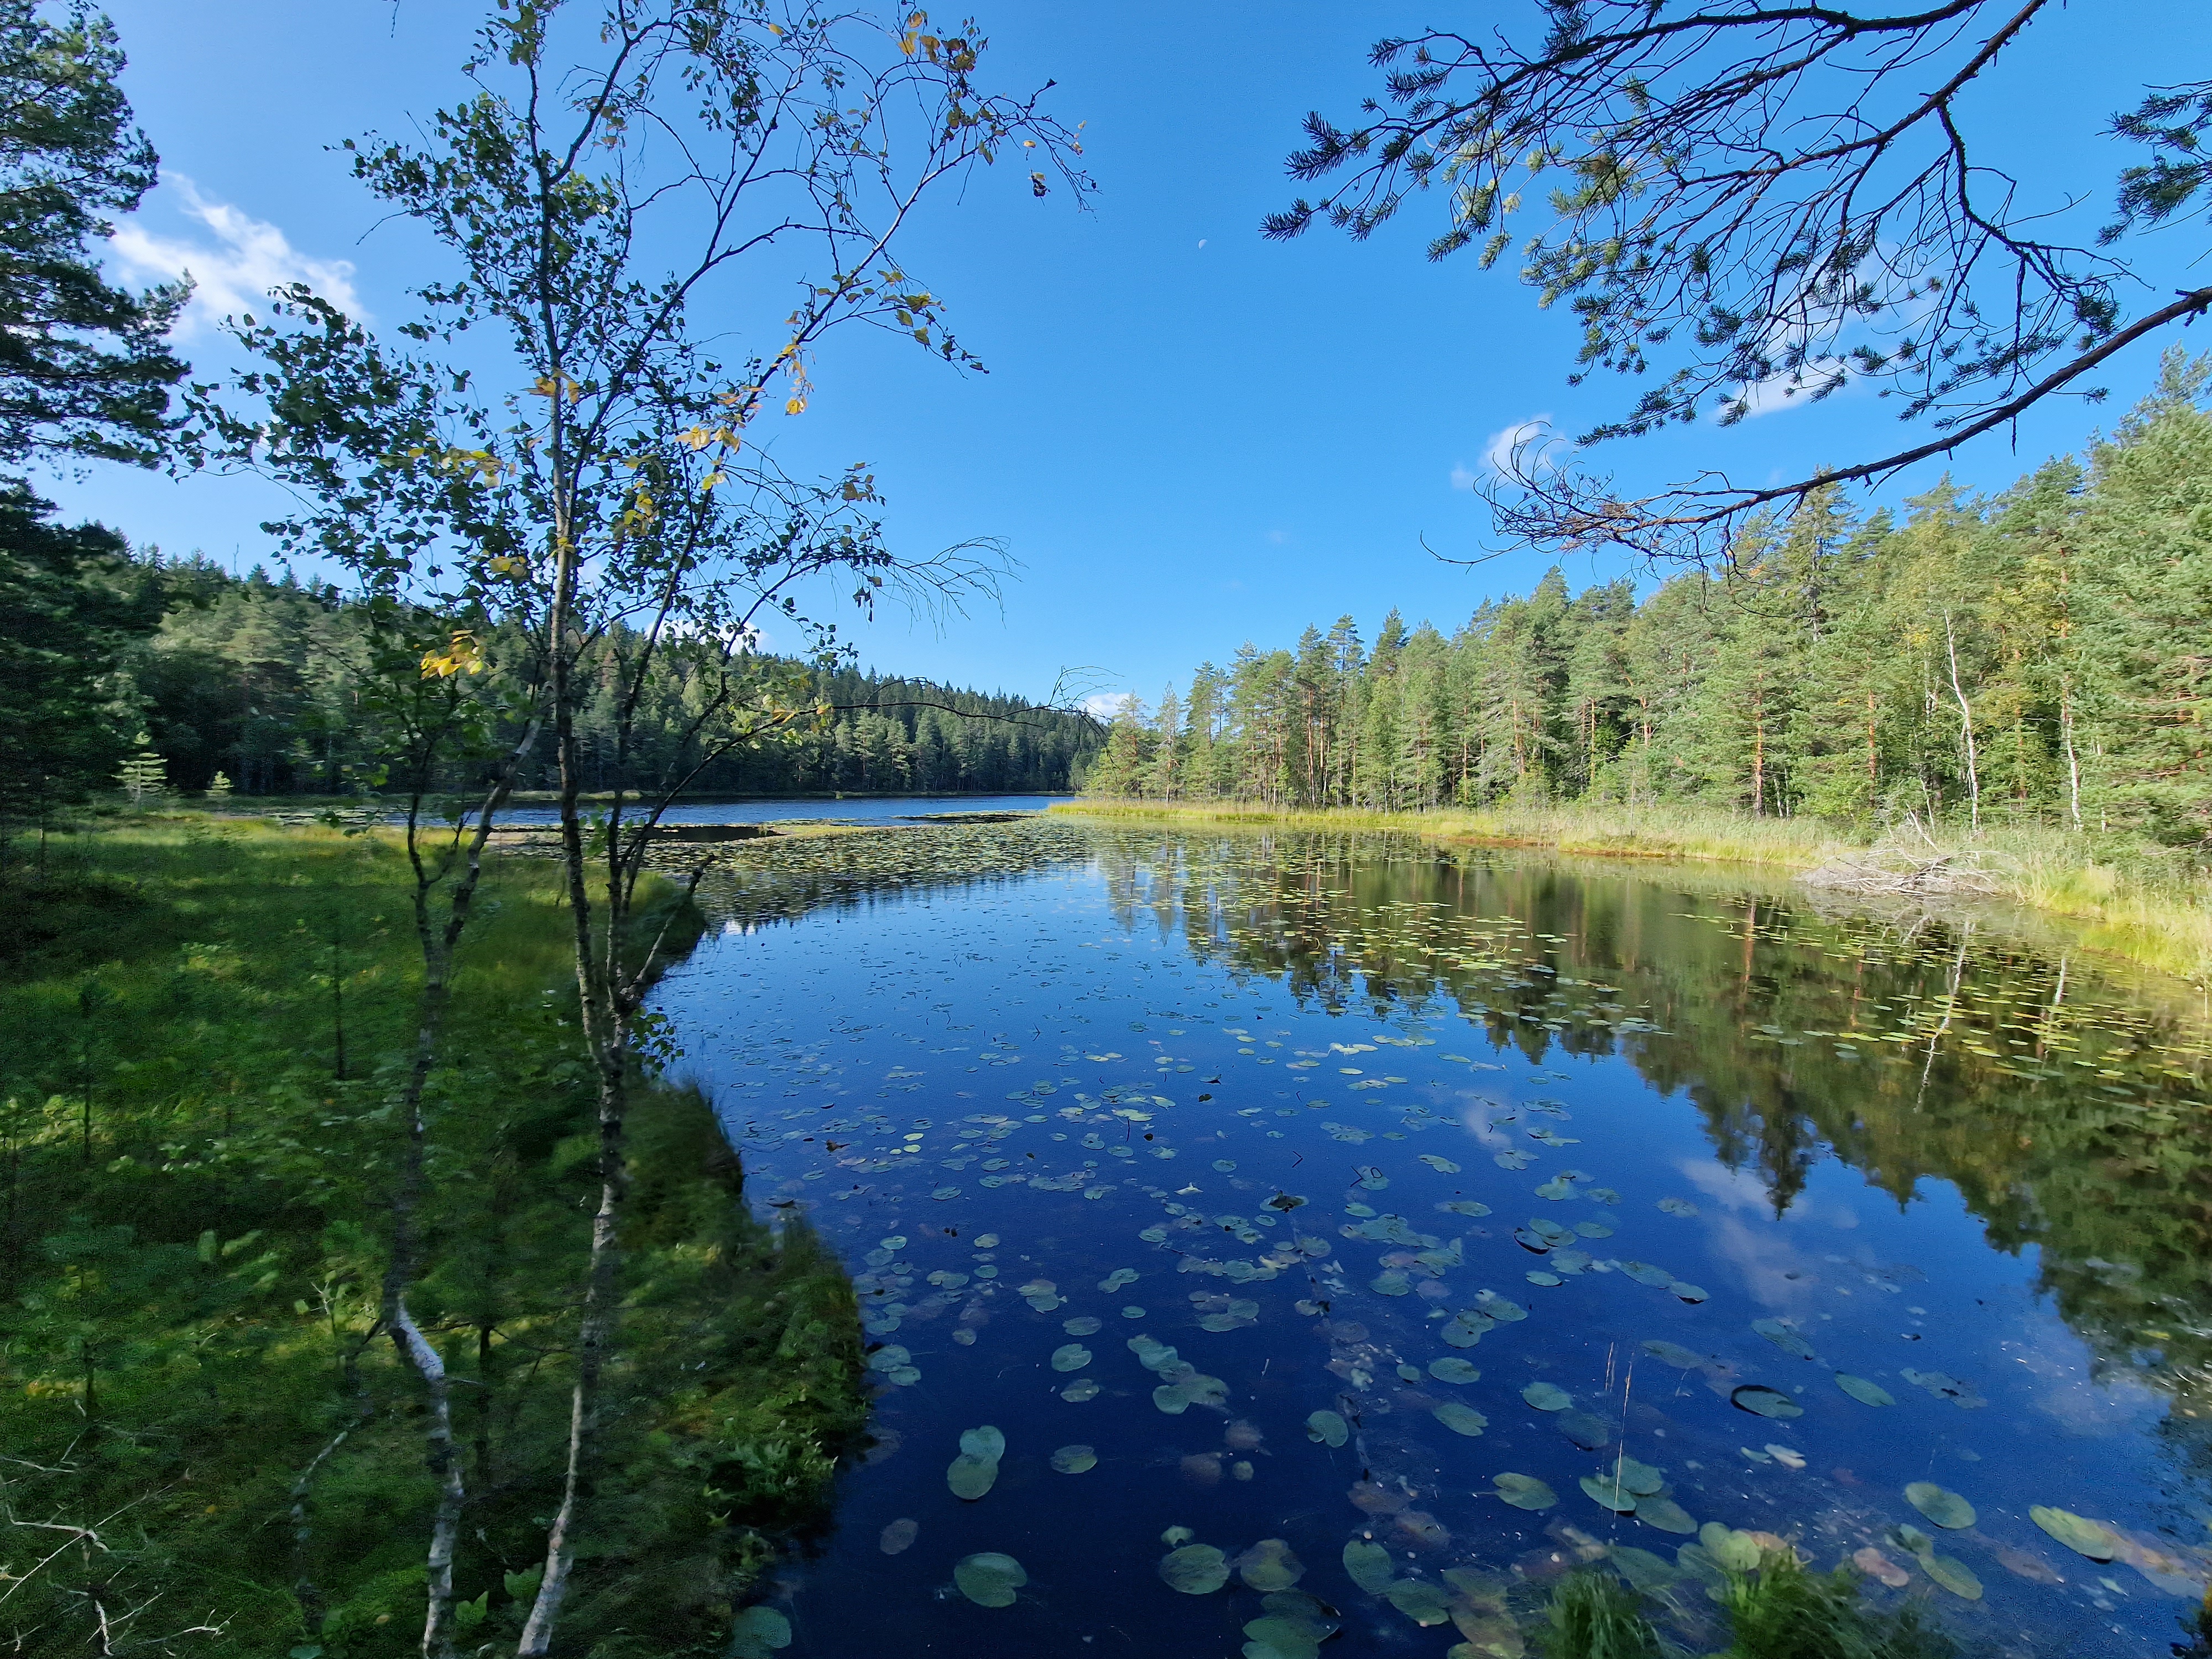
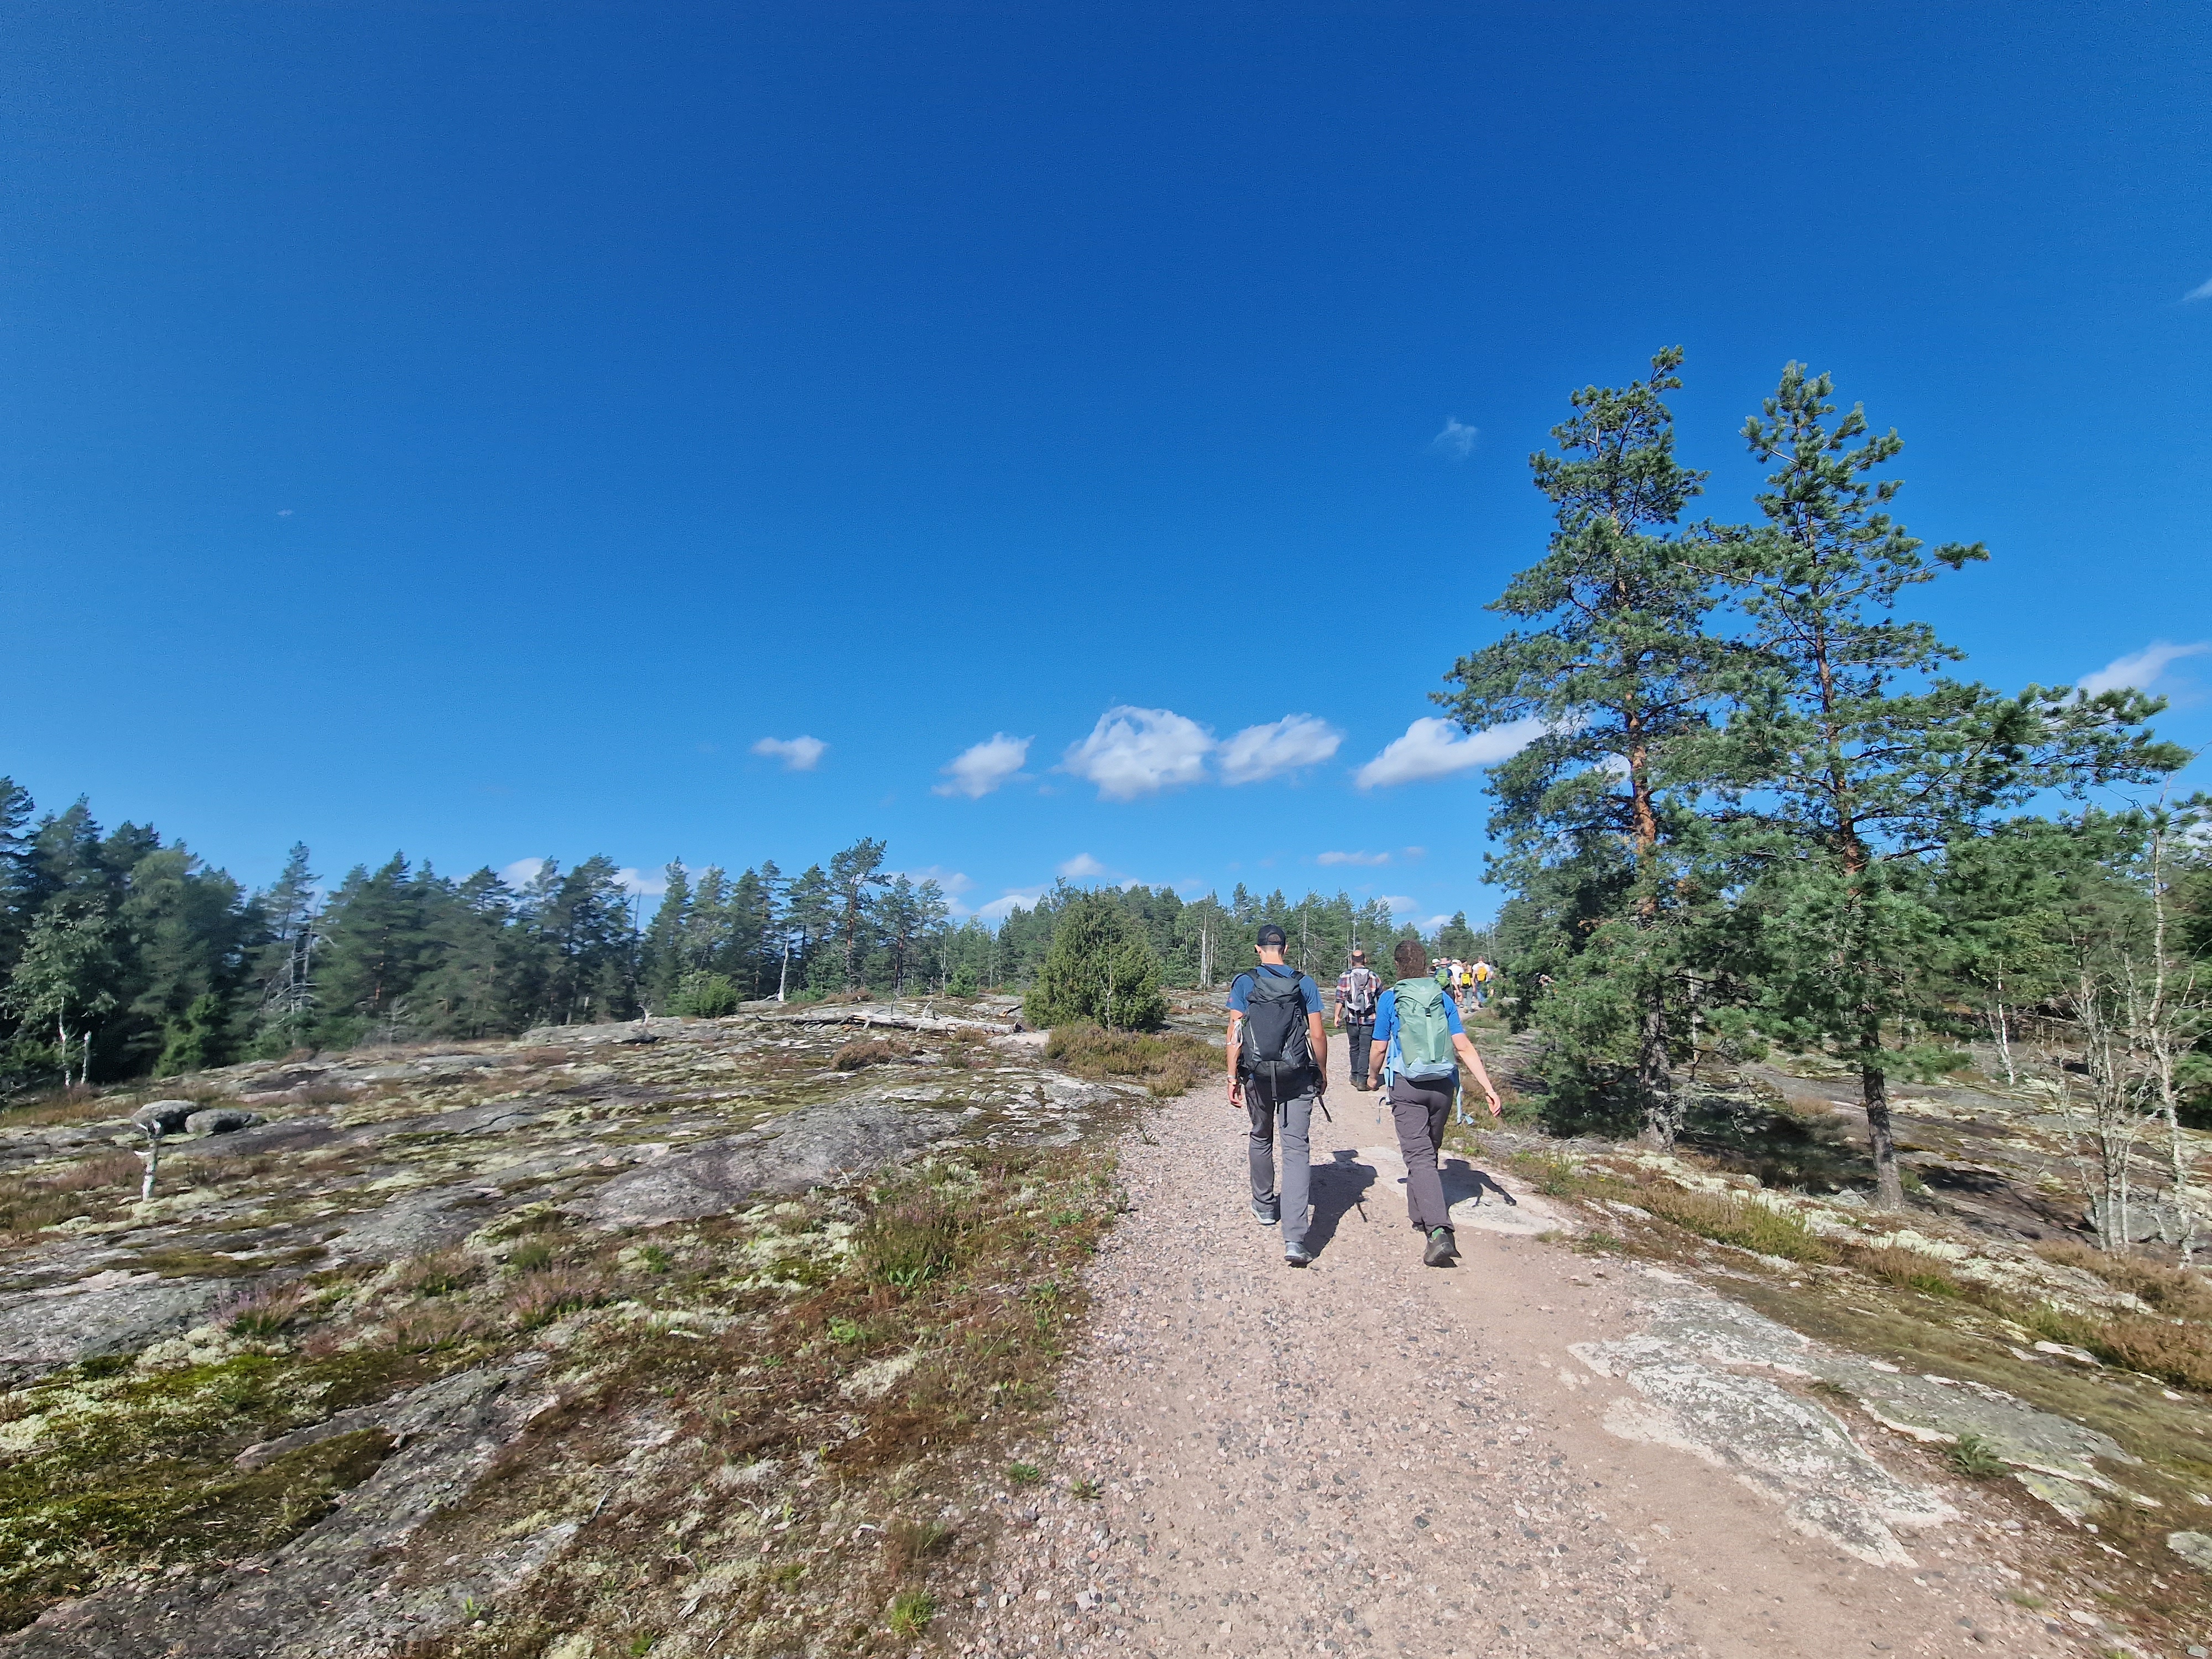
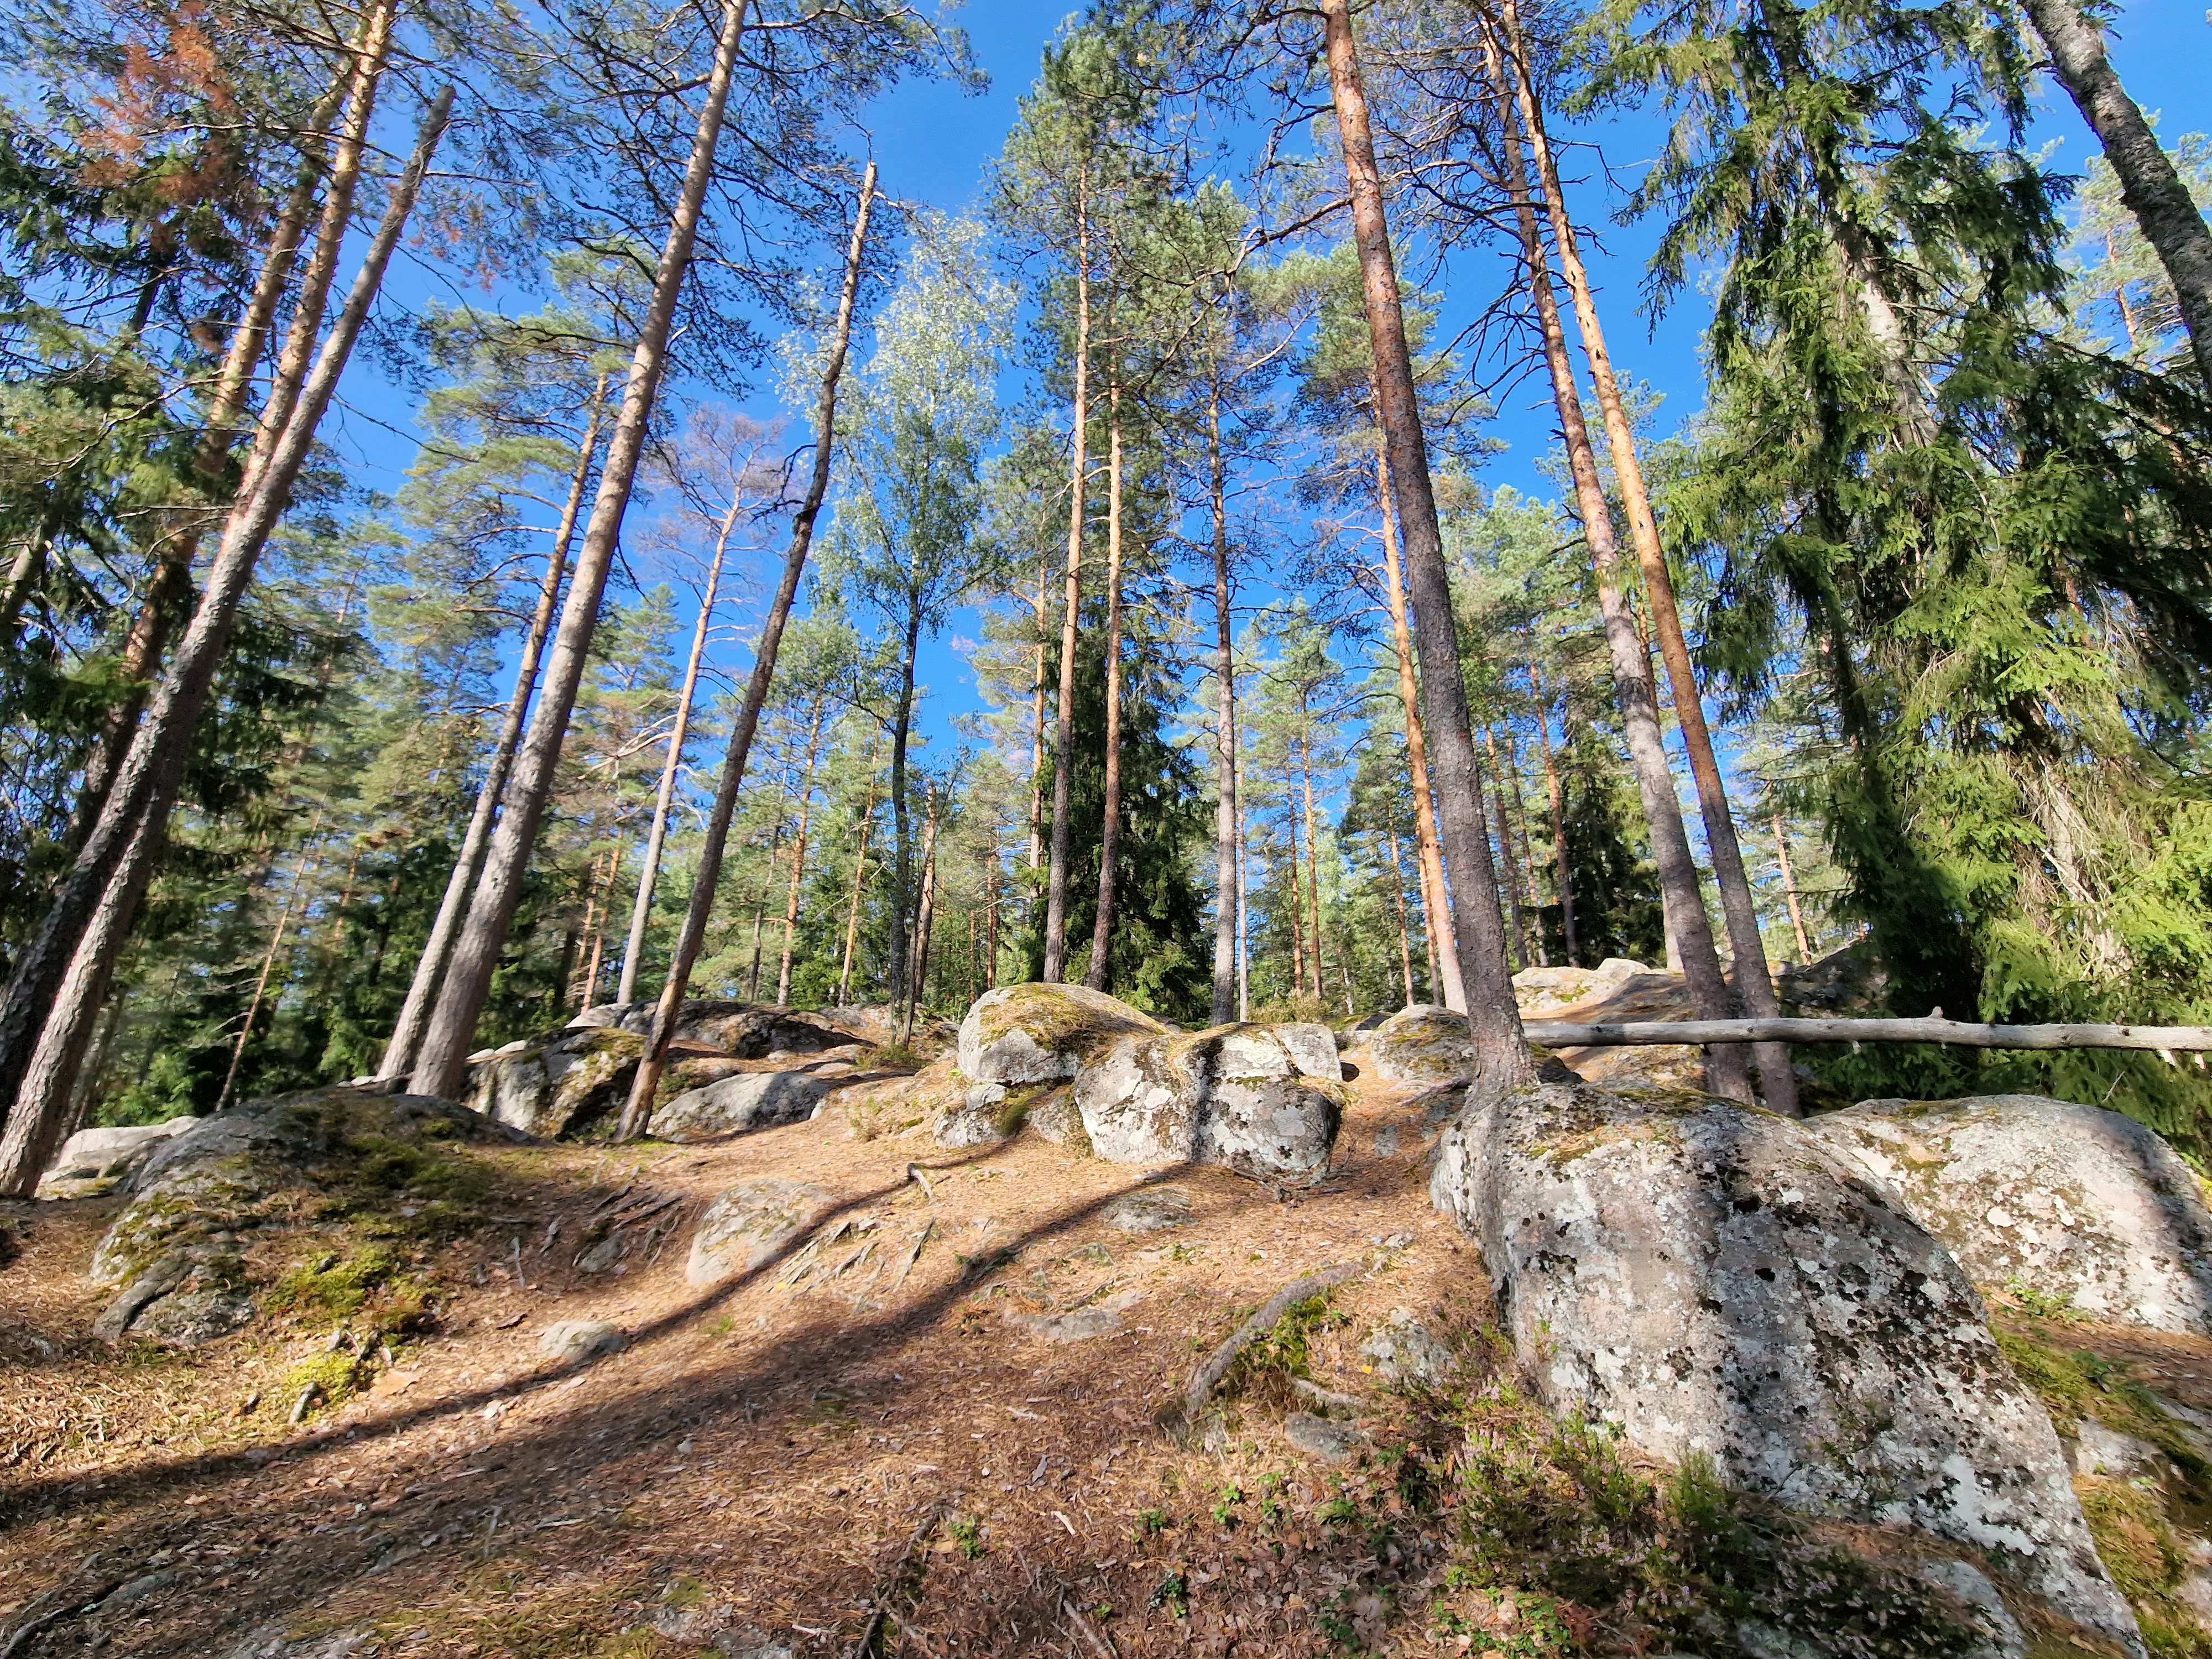
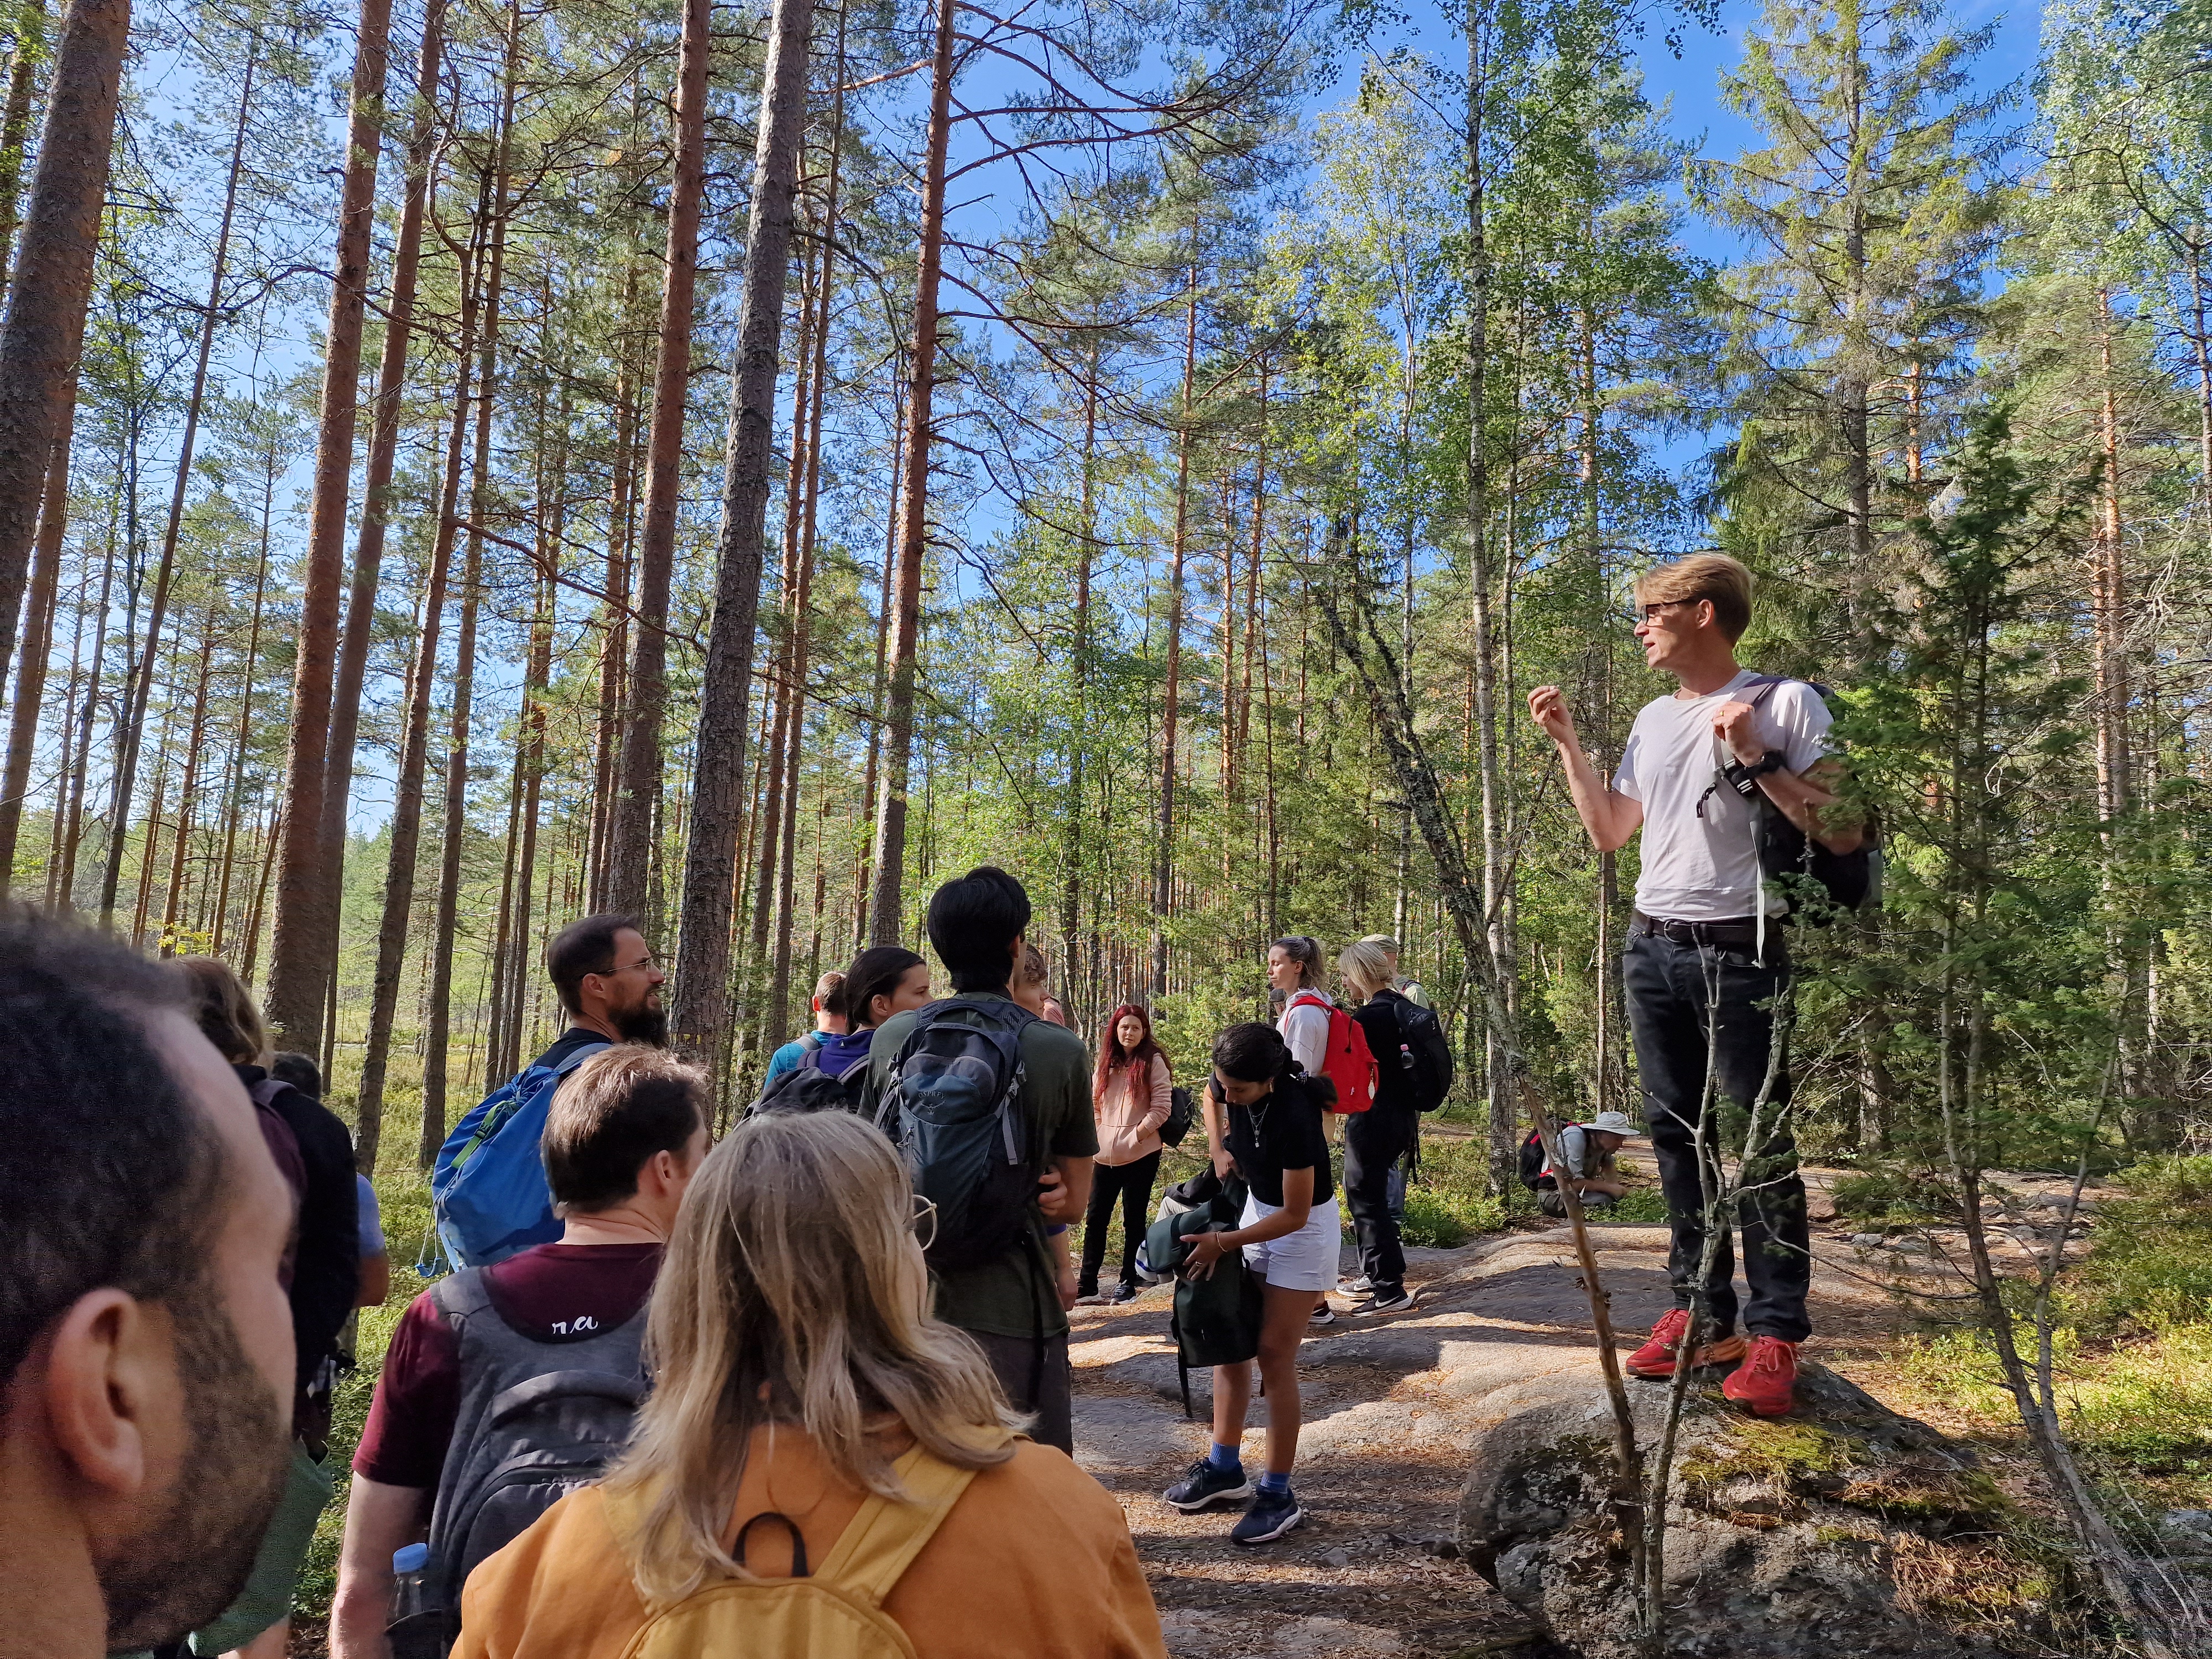
The conference started with a much-appreciated excursion to the lakes, forests and rocks of southern Finland

After this second edition—equally interesting, important, and inspiring as the first one—it’s safe to say that ‘MEB’ has become a tradition. From now on, every two years, the microclimate community will gather for a week of cutting-edge presentations, exhilarating discussions, and simply to enjoy each other’s company. And we’ll all return home better equipped to do even better science.

This blog post is to reflect on the science discussed: what has ME&B 2024 taught me about the state of our field? What have we learned since the last conference, and where are we heading next? Here are a few observations, loosely connected, but hopefully enough to spark inspiration!

Modelling Mayhem

First, and perhaps most significantly: there’s so much exciting progress in modelling! In both of the main categories—mechanistic and correlative models—things are moving rapidly. Mechanistic models are becoming faster, easier to use, more versatile, and more ambitious by the day, zooming in on specific organisms and scaling up to cover larger spatiotemporal extents. Riding the wave of increased computing power, possibilities are emerging that seemed far-fetched only a couple of years ago.

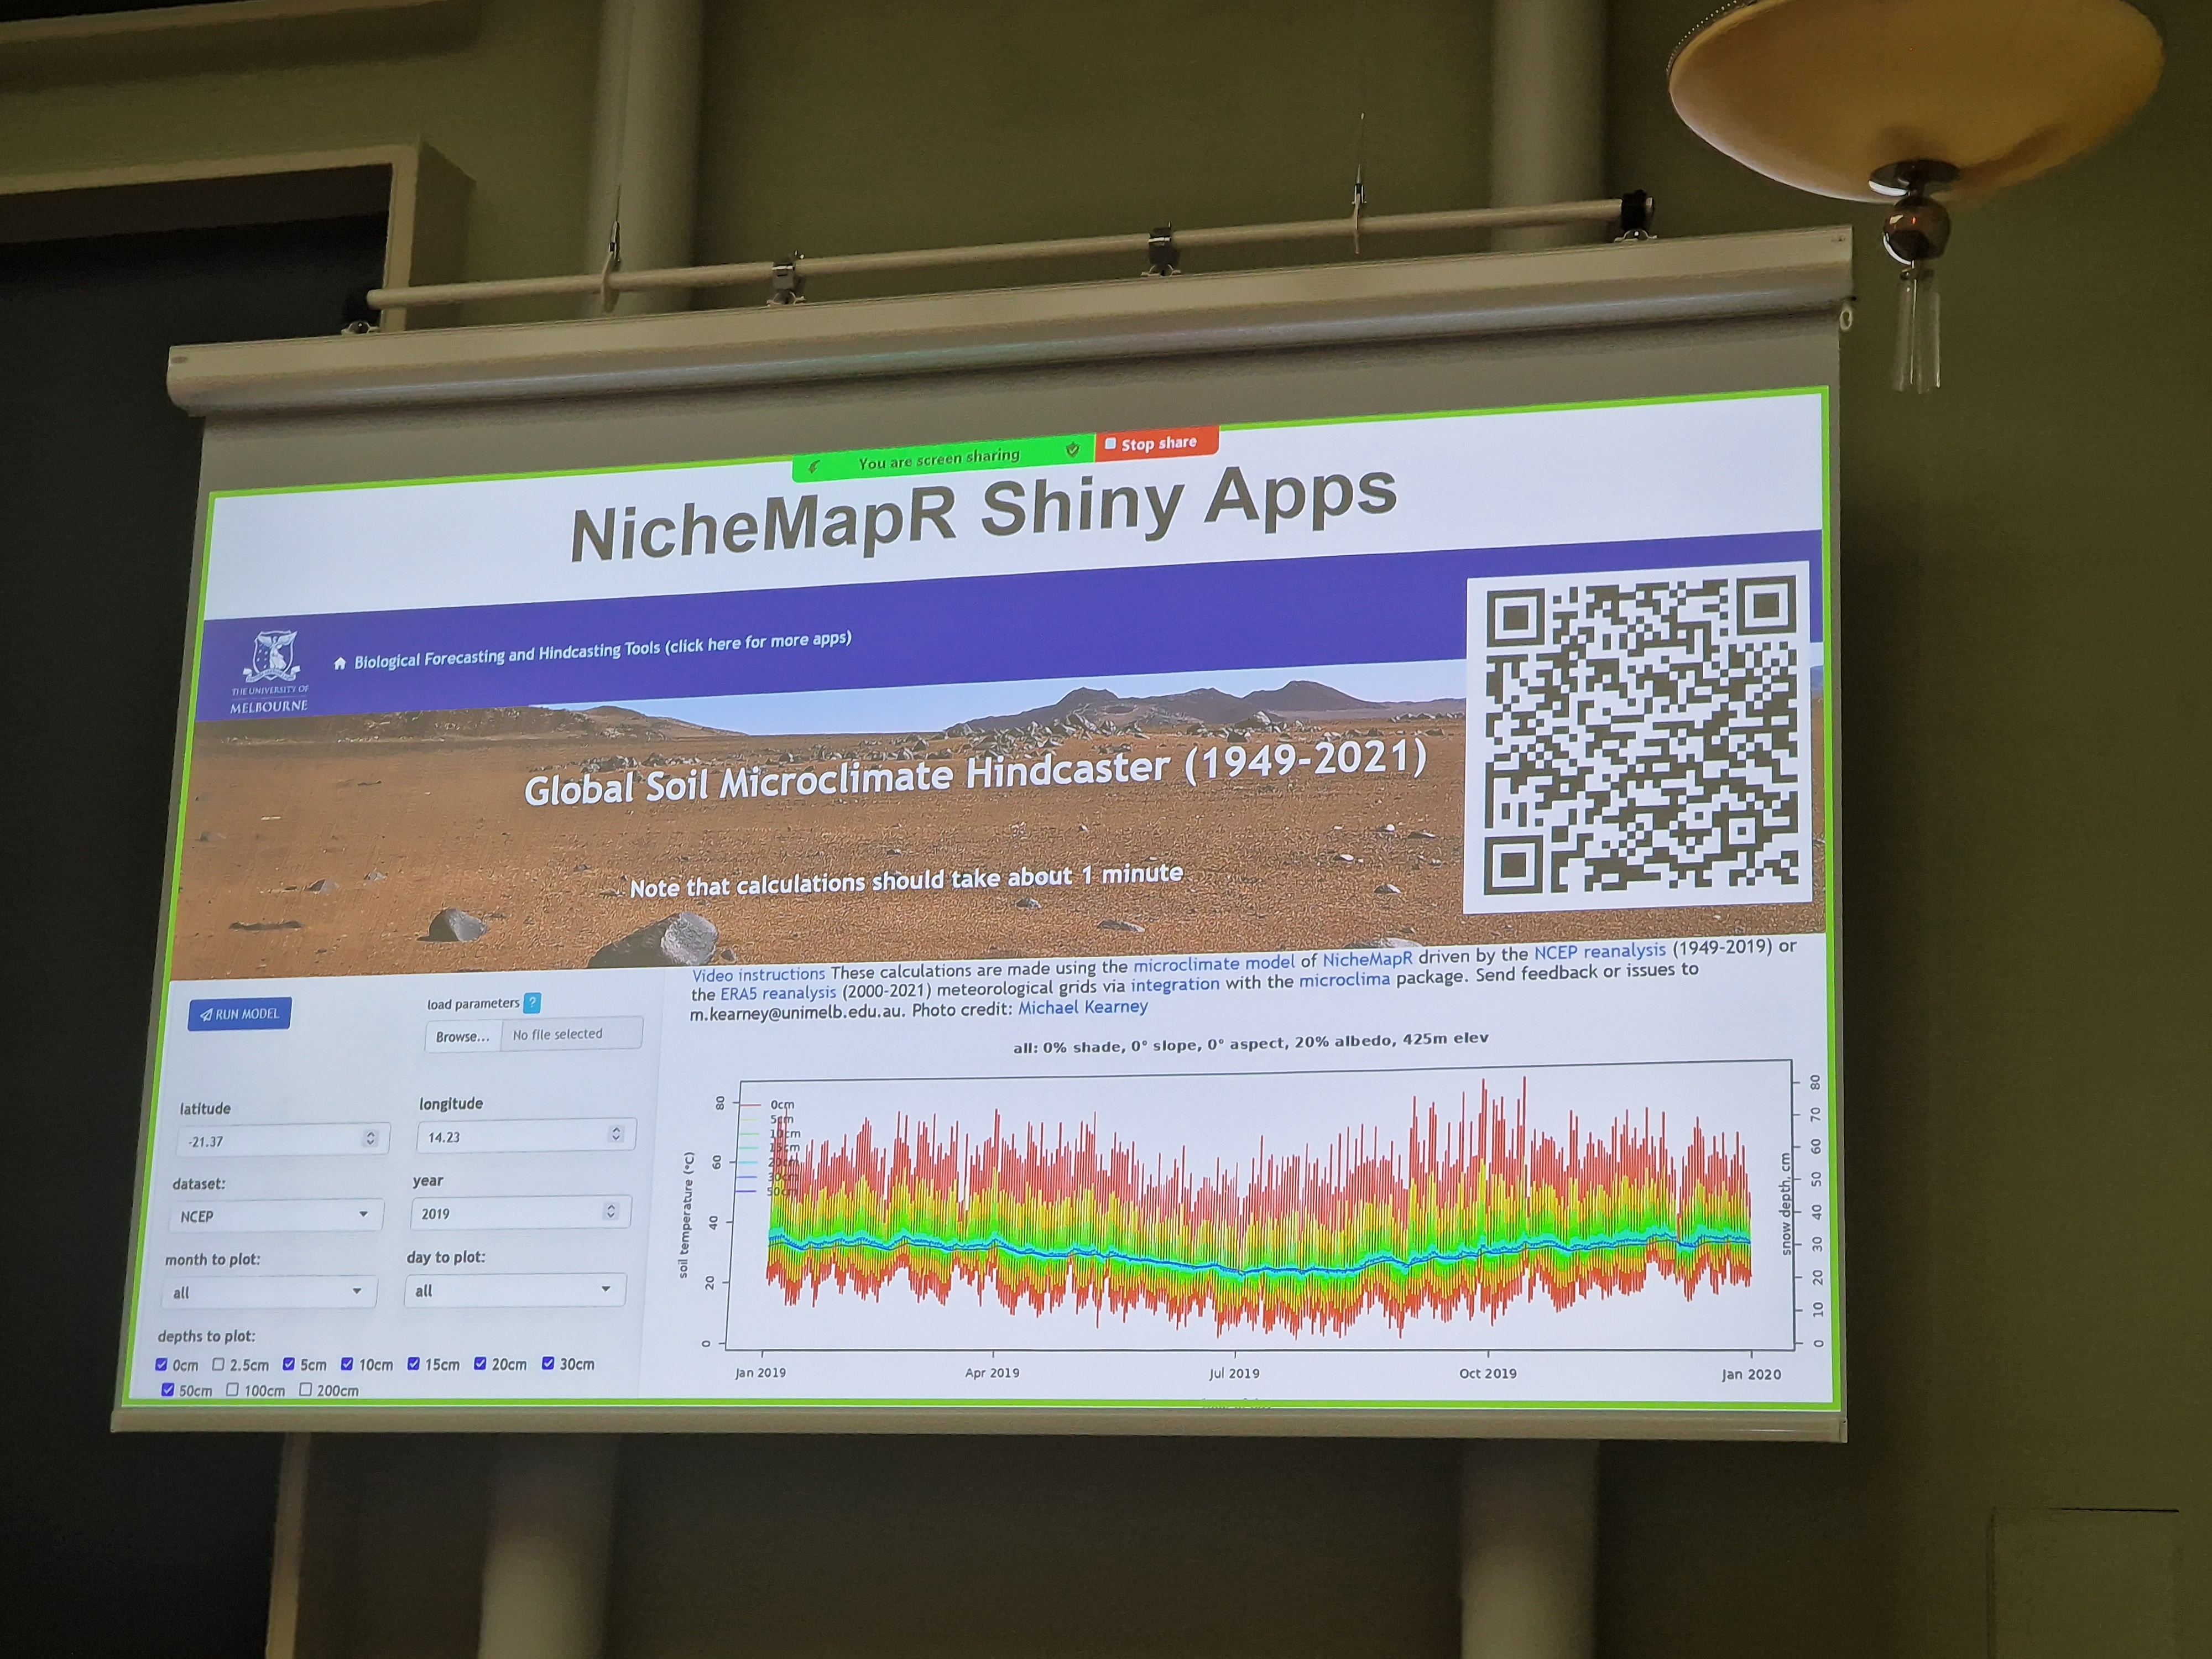
Michael Kearney’s keynote lecture highlighted the great things that can be done with mechanistic microclimate models

But correlative models are keeping pace. Particularly in machine learning, the conference showcased a wide array of new applications, many bigger, better, and bolder than before. Deep learning, for instance, has entered the fray, enabling analyses on increasingly larger datasets. This has finally opened the door to modelling the microclimates of the past and future, moving us closer to answering the biggest question of all: how fast is the microclimate changing?

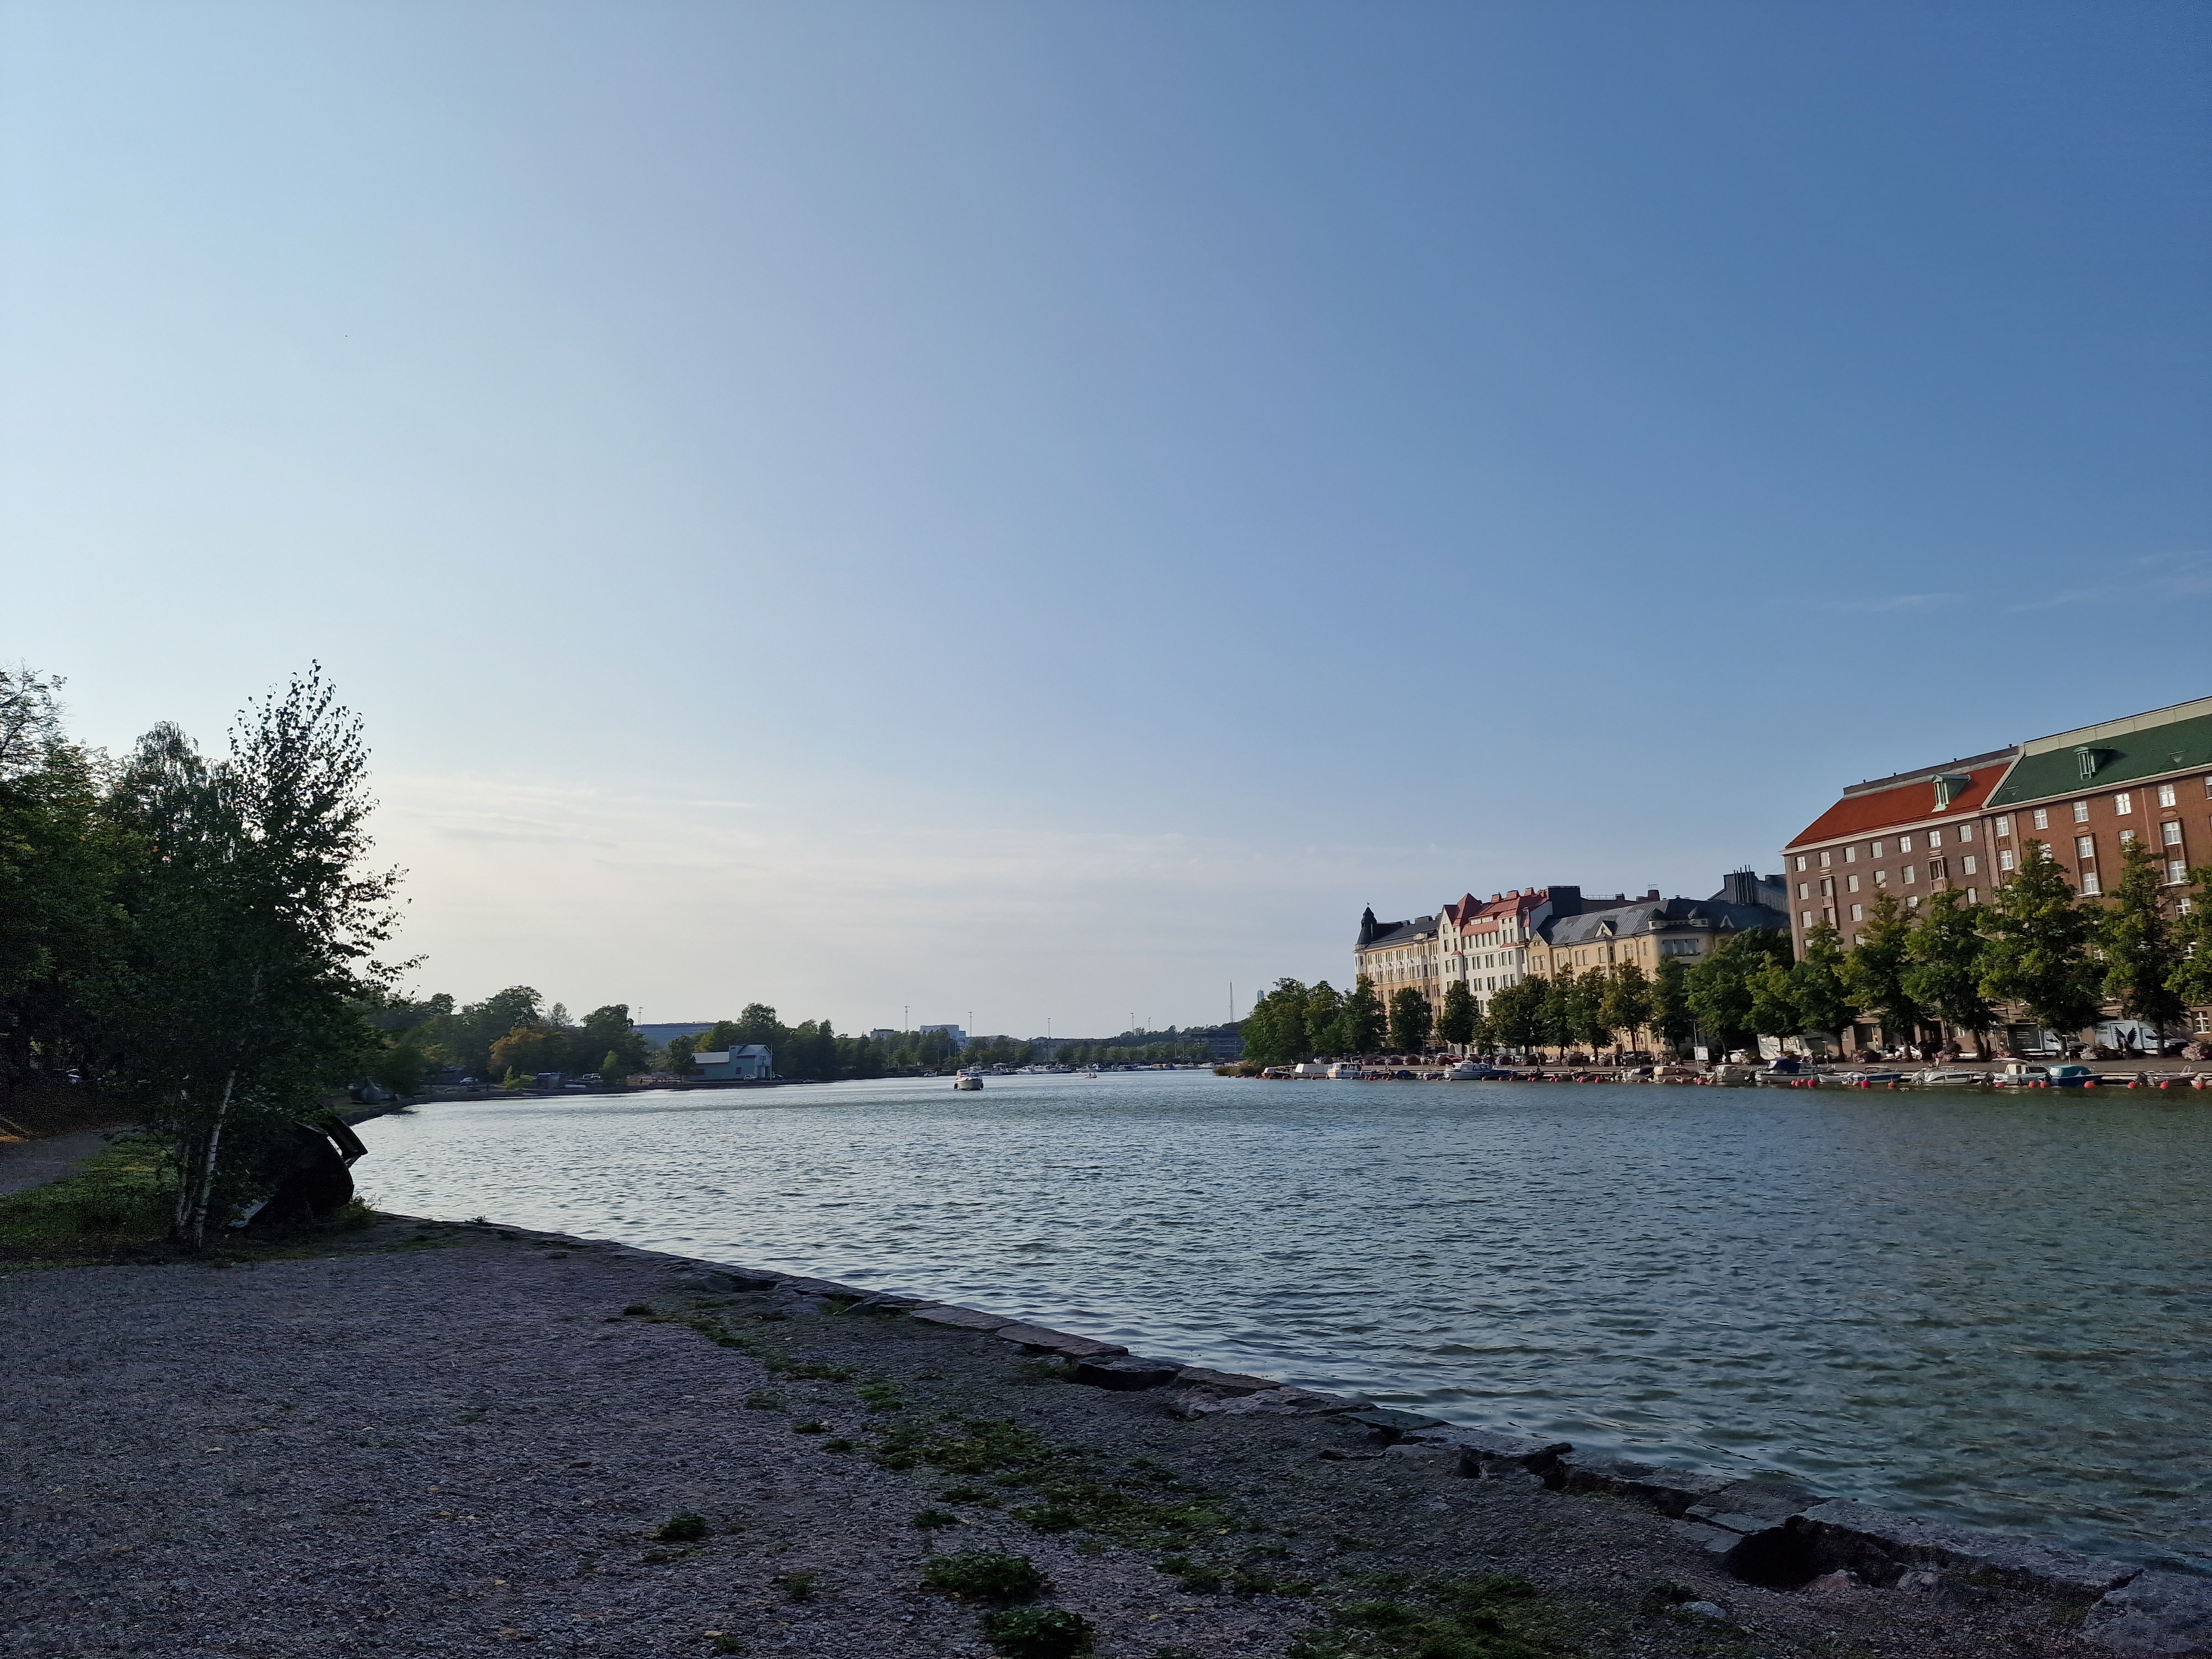
The city of Helsinki was the perfect backdrop for a week of science and networking

Data, data, data!

The flow of microclimate data shows no signs of slowing down, either. We’re gathering bigger datasets, from more remote areas, and compiling them more efficiently (thank you, SoilTemp!). Smarter survey designs are helping us understand the globe’s microclimate in greater detail. I’m particularly happy to see increased standardization (thank you, TOMST!), but at the same time, creativity is flourishing. Take, for example, the fiber optic cable that measures temperature every 5 centimeters or so along its 50-meter length—such innovation is amazing to see.

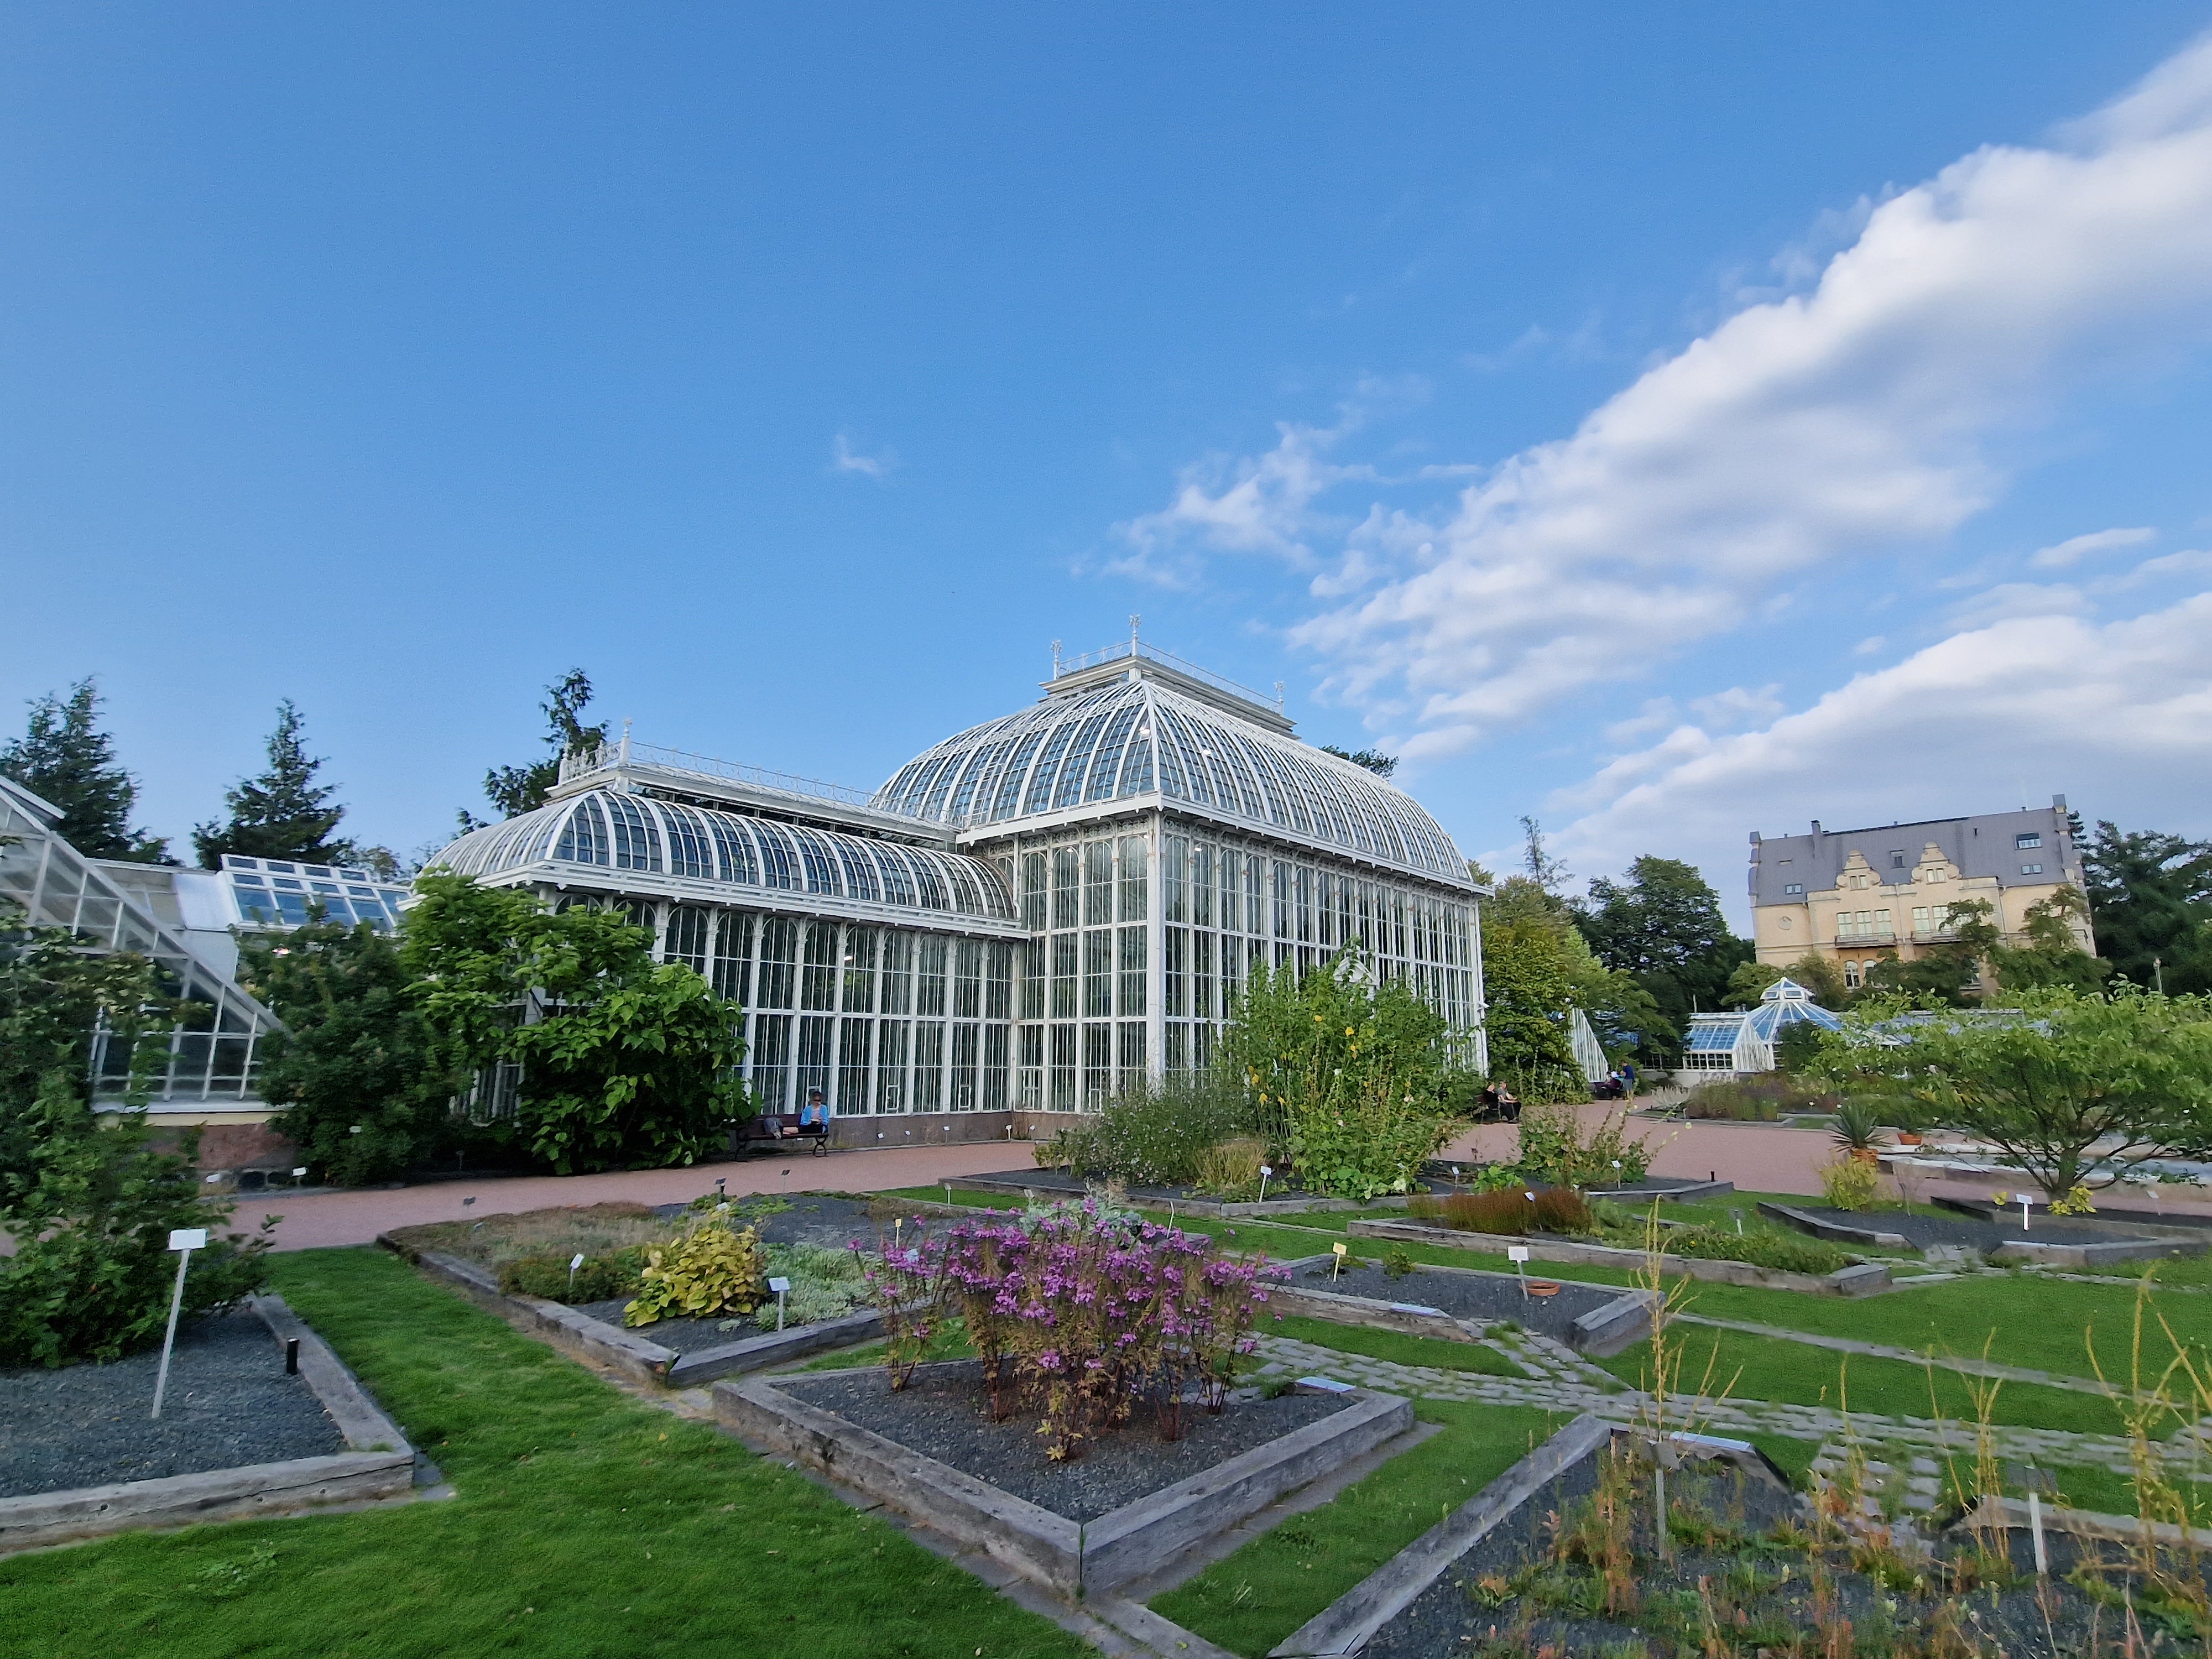
The cute botanical garden of Helsinki, a must-see for any self-respecting plant ecologist, of course!

We’re also becoming more careful with our sensor data, engaging in important discussions about what we’re actually measuring with a particular sensor, and how to make those measurements more relevant to the organisms we’re studying. We’re moving beyond simply acknowledging that things are complicated; we’re working on solutions and standardization.

From European forests to the globe

Global microclimate community? Absolutely. While European forest research clearly still leads the way, other regions and ecosystems are catching up. Tropical forests, for example, are gaining more in-situ sensors, fostering an increasingly vibrant research community and – as a result – a deepening understanding of those ecosystems.

But we went far beyond that at ME&B. The conference also saw the launch of a new Arctic, Antarctic, and Alpine subsection, uniting cold-climate enthusiasts to bring our knowledge of these regions up to par with that of forests. We also witnessed perhaps the very first freshwater microclimate presentations, tentatively bridging the gap between terrestrial and aquatic microclimate research—fields with many parallels but just as many divergences. Drylands, urban areas, peatlands and more were represented, showcasing that each ecosystem needs its own perspective to tackle microclimate issues.

Of course, SoilTemp oversees all of this with a smile, and in the next two years, we’ll work on strengthening these diverse subfields and their interactions even further.

A growing community

Lastly, and perhaps the most heartening development: the microclimate community is coming together like never before. Collaborations are springing up everywhere, and endless enthusiastic conversations about research—over coffee, beer, blueberry juice, or vegetarian curry—fuel the spirit of the conference. Let’s keep those conversations going, as they are what keep us going!

Thanks, team Helsinki, for a fabulous conference!

Miska Luoto, one of the Finnish organizers, showing us his beloved Finland
Posted in General | Tagged , , , , , | Leave a comment