Non-native plants along mountain trails

We had been studying the role of mountain roads as drivers of non-native plant invasions in mountains all the way back till 2007. Heck, we just published a first manuscript on the decadal dynamics in those (Iseli et al. 2024)! Hiking through the worlds’ beautiful mountains, however, we soon started to wonder: do the same principles hold up along trails as well?

Already back in 2007, we started studying how mountain roads act as highways for non-native plants to invade pristine alpine ecosystems. Heck, we just published a first manuscript on the decadal dynamics in those (Iseli et al. 2025)! Hiking through our beloved mountains all over the world, however, a new question soon emerged:

What about trails?

Trails, like roads, are linear disturbances. They connect valleys with remote mountaintops, they carry humans (and their gear, boots, and seed-laden socks), and they alter local conditions in ways that could favor non-native species – opening up vegetation, increasing nutrient availability, and creating new microhabitats.

But trails are very clearly not roads – I don’t have to tell you that! The disturbance is softer. The infrastructure is minimal – often no gravel, no salt, no foreign materials. Hikers often wander off trail. There’s less edge, less management, and often fewer people. So, we suspected the same mechanisms would play out, but at a lower intensity. Fewer non-natives, lower cover, and smaller contrasts between trail edges and adjacent vegetation.

And so, an idea was born: take the MIREN road survey protocol and adapt it for trails.

Trails as linear disturbances in the mountains – hikers as vectors for non-native seeds

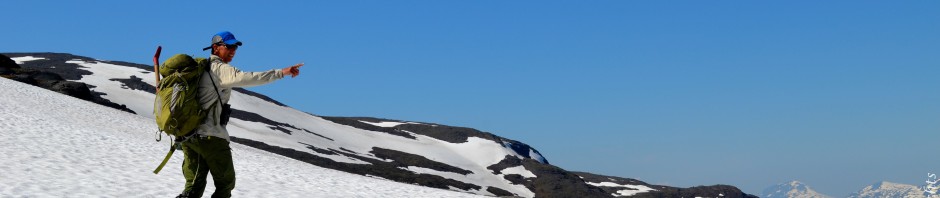
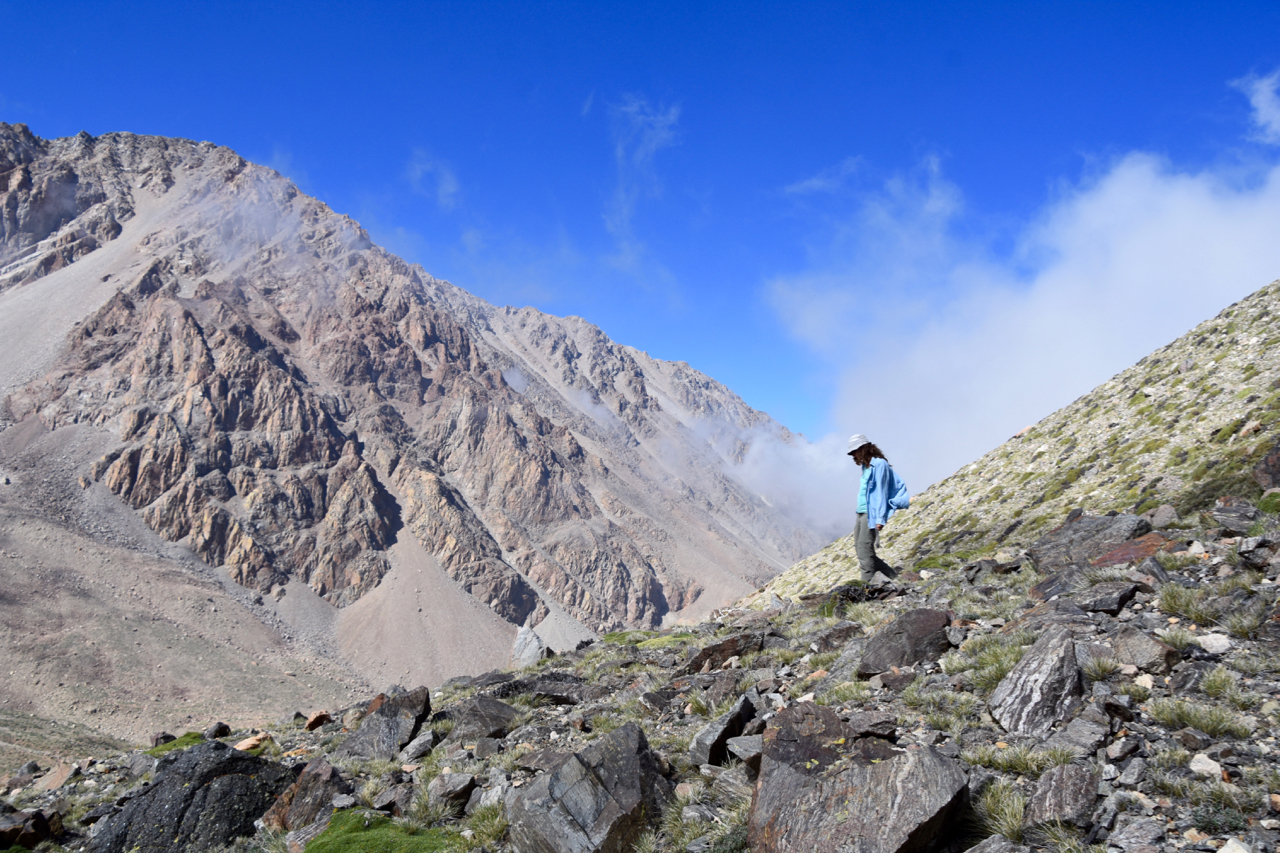
In 2016, without any dedicated funding – just shared enthusiasm and a love for mountains – we began surveying trails worldwide. Today, thanks to a remarkable effort relentlessly led by Agustina Barros and Eduardo Fuentes Lillo, we’ve surveyed 55 trails across 9 regions, and the first results are now published in Global Ecology and Biogeography.

So, what did we find?

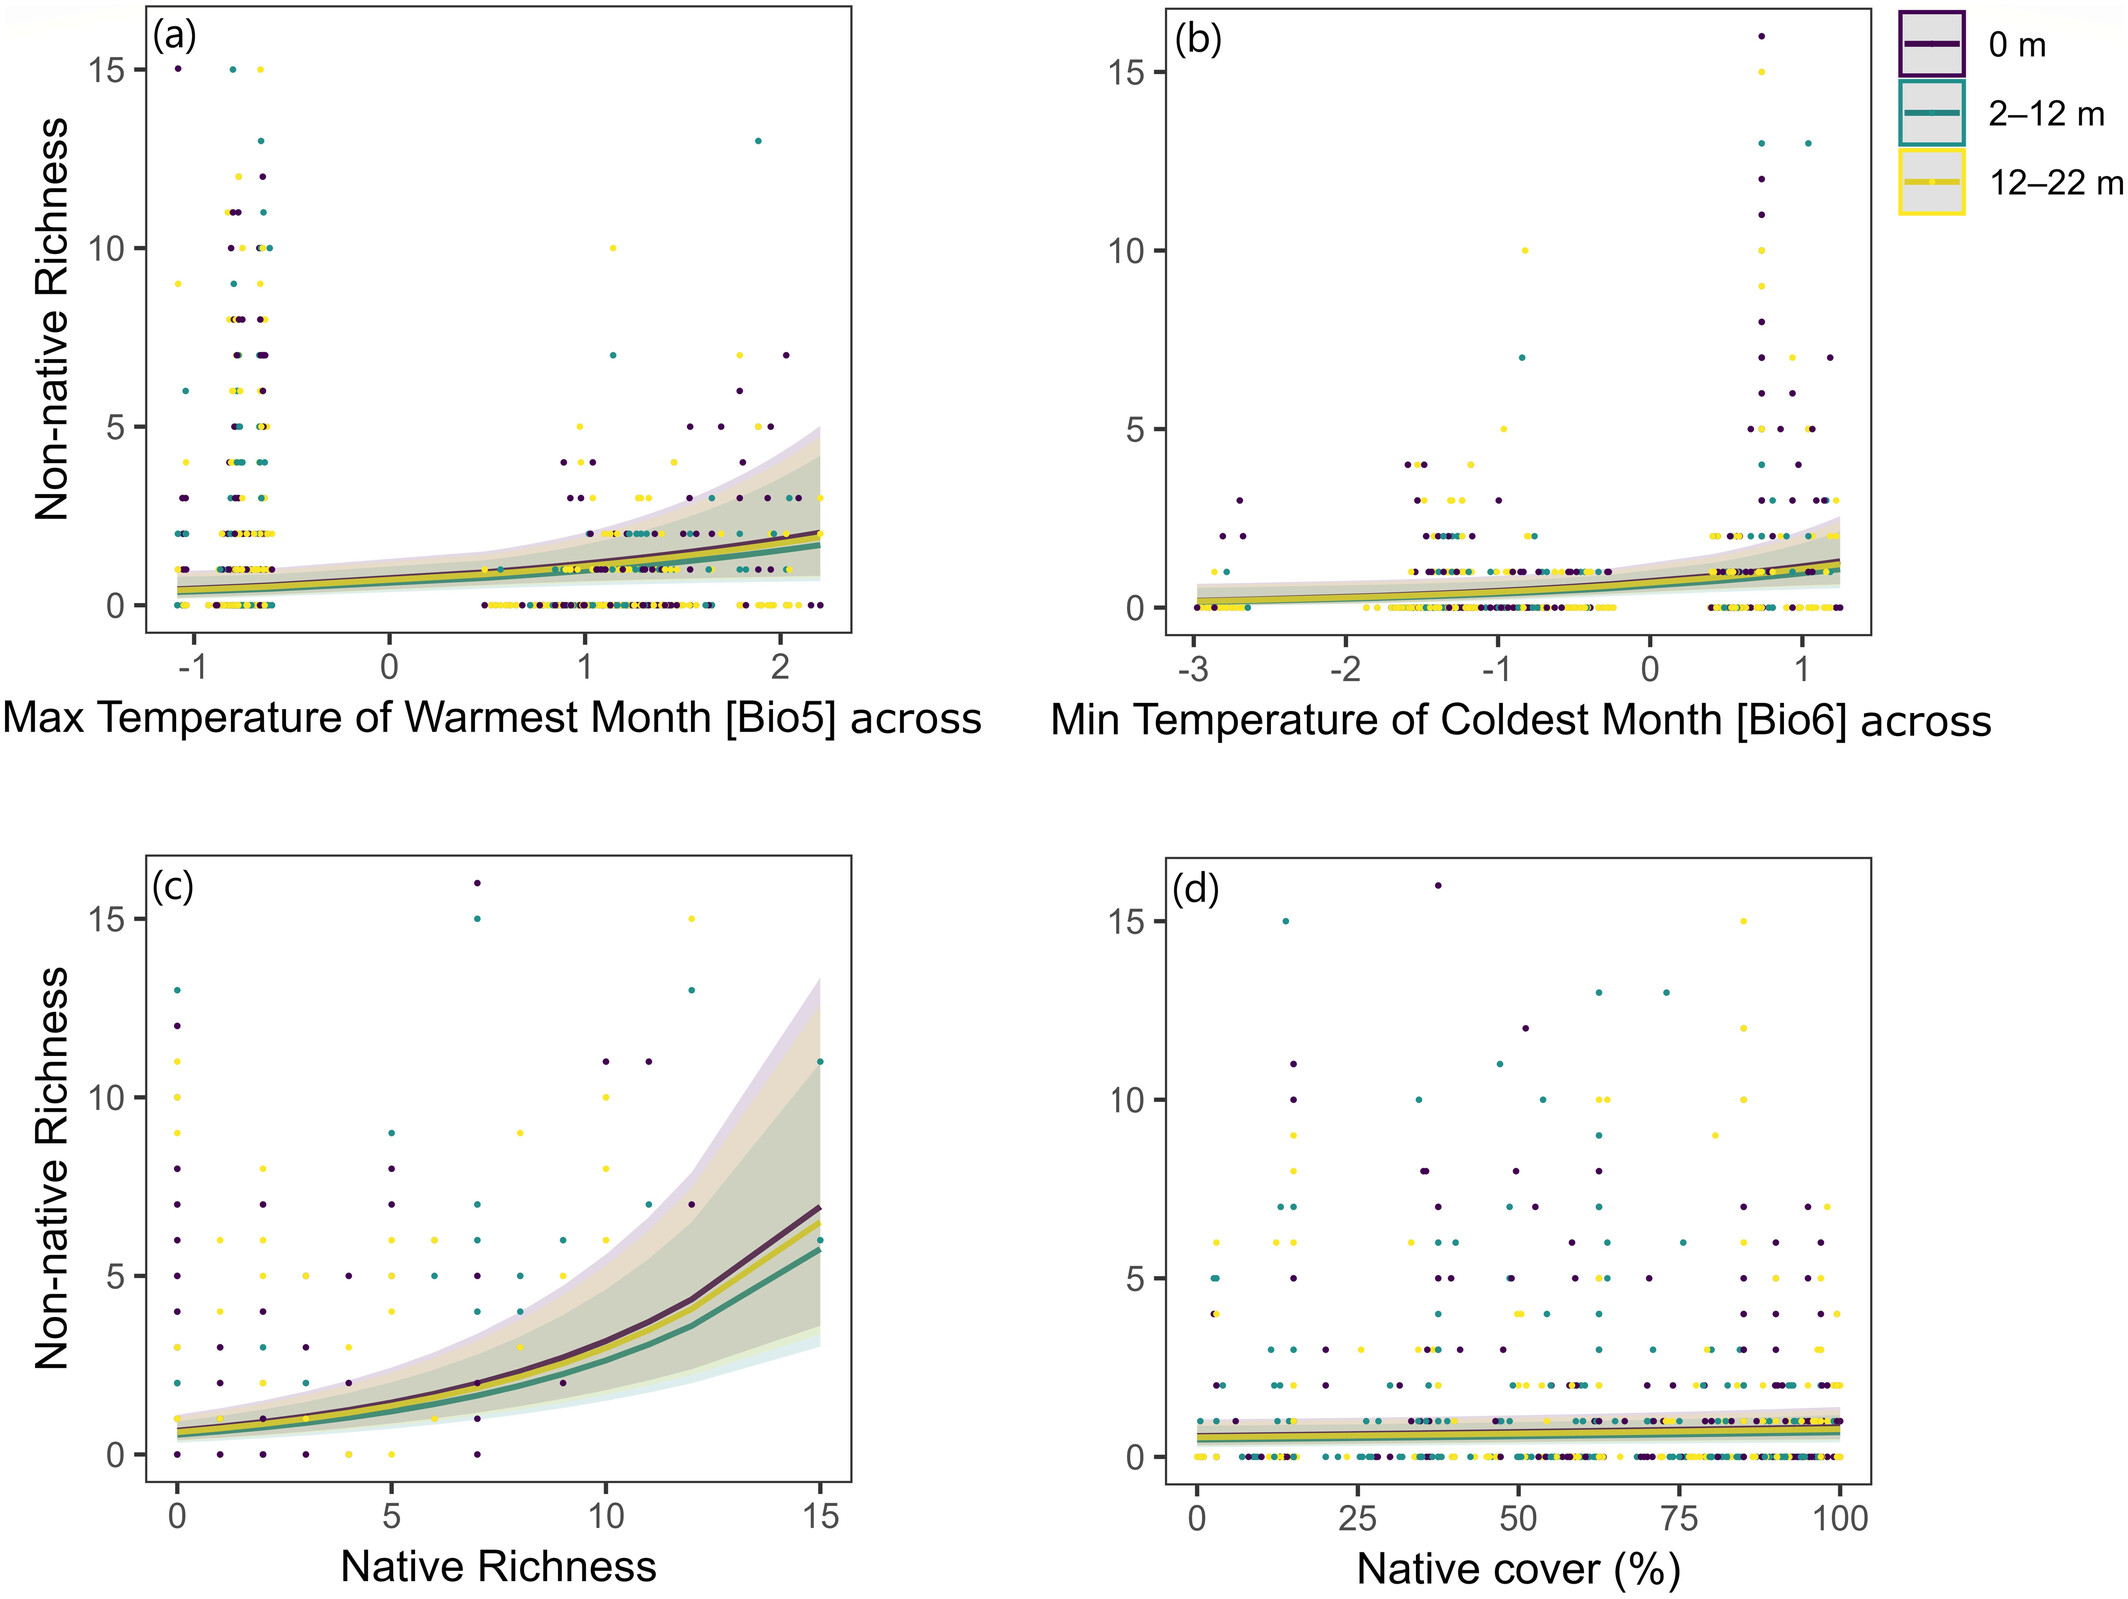
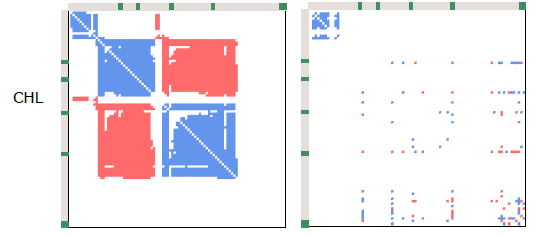
At the global scale, climate (especially temperature) explained most of the variation in non-native plant richness. Biotic factors – like the diversity of native vegetation – best predicted presence and cover. Human-related factors (trail use intensity, grazing, distance to the trail) also played a role, but less consistently.

Importantly, the patterns were strikingly similar to those we’ve seen along roads:

  • Fewer non-natives at higher elevations and latitudes
  • Fewer non-natives farther from the trail edge
Trends in non-native richness as a function of climate (top) and native biotic interactions (bottom), showcasing also the subtle but significant differences with distance to the trail (different lines).

This supports the idea of a “double filter” for non-native plants:

  1. Climate limits which species can survive as you go higher and colder.
  2. Distance from disturbance limits where they can establish, as native communities become more resilient, and propagule availability lower.

As expected, however, the impact of trails was indeed less intense than that of roads!

Especially at high elevations, trails are often barely distinguishable from the surrounding vegetation, resulting in smaller differences in non-native communities as well. Combined with a harsh climate and often substantially reduced human presence, in many sites – for example here in northern Sweden – the number of non-natives is simply close to zero.

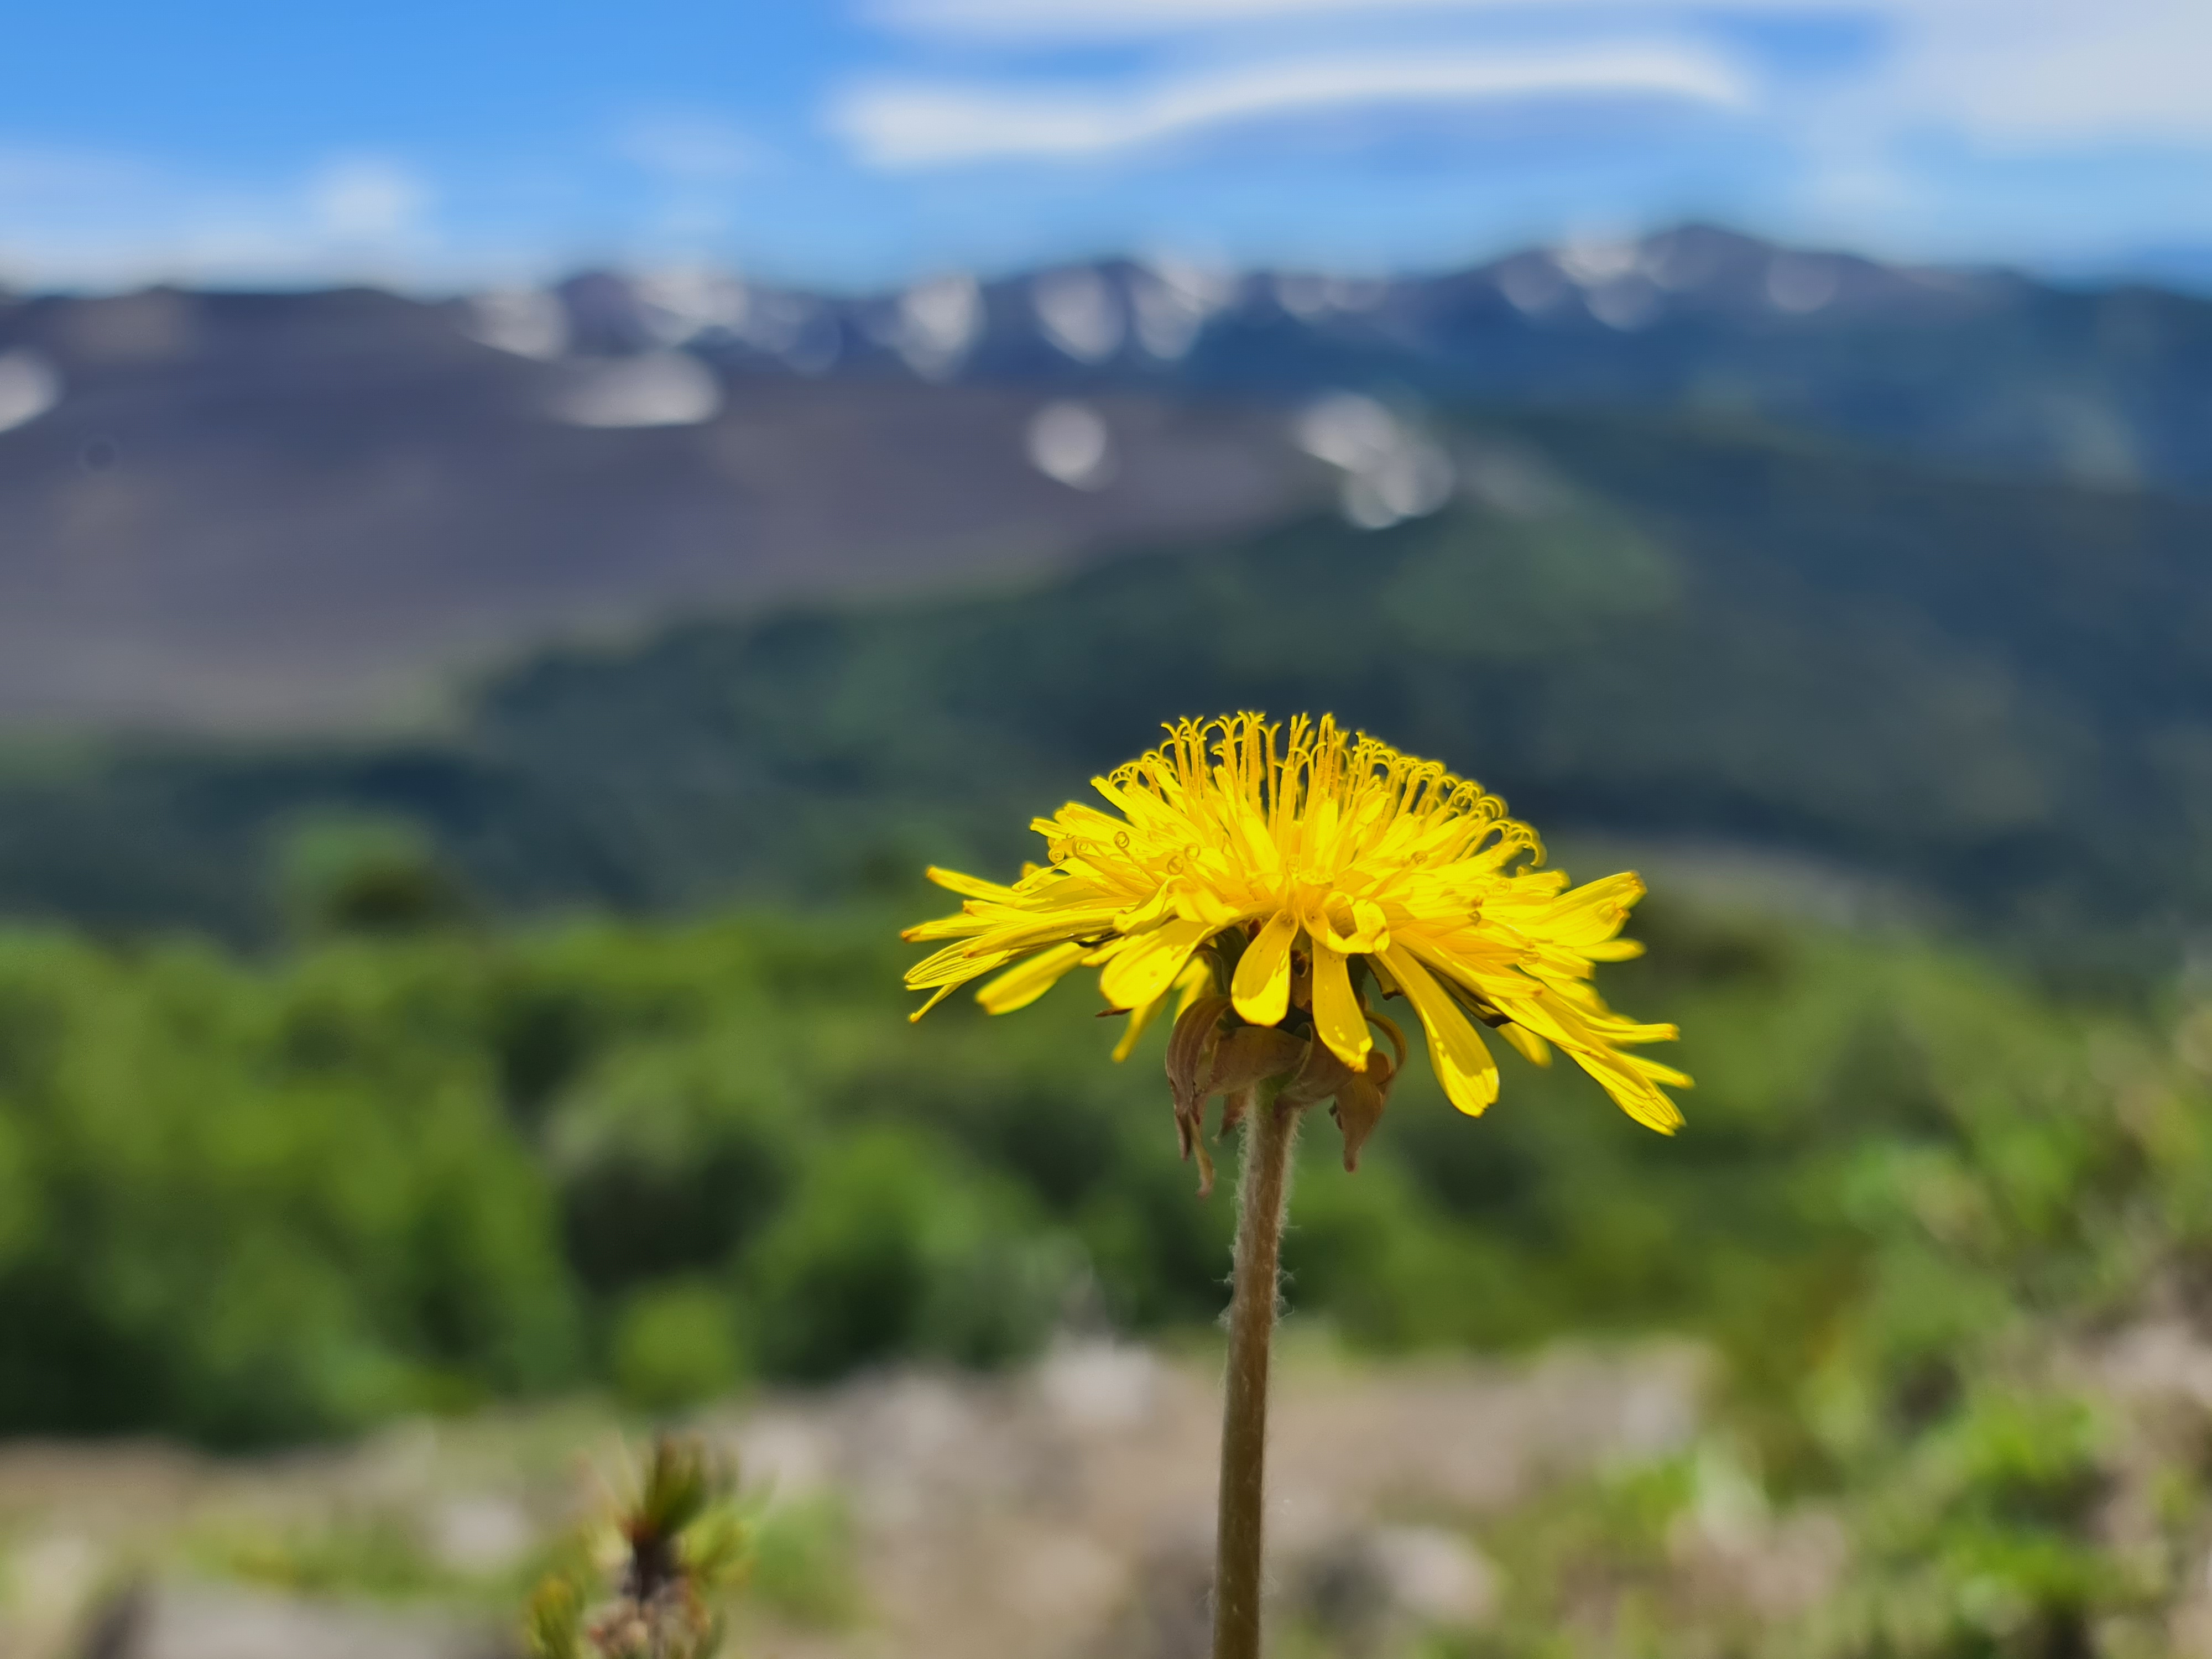
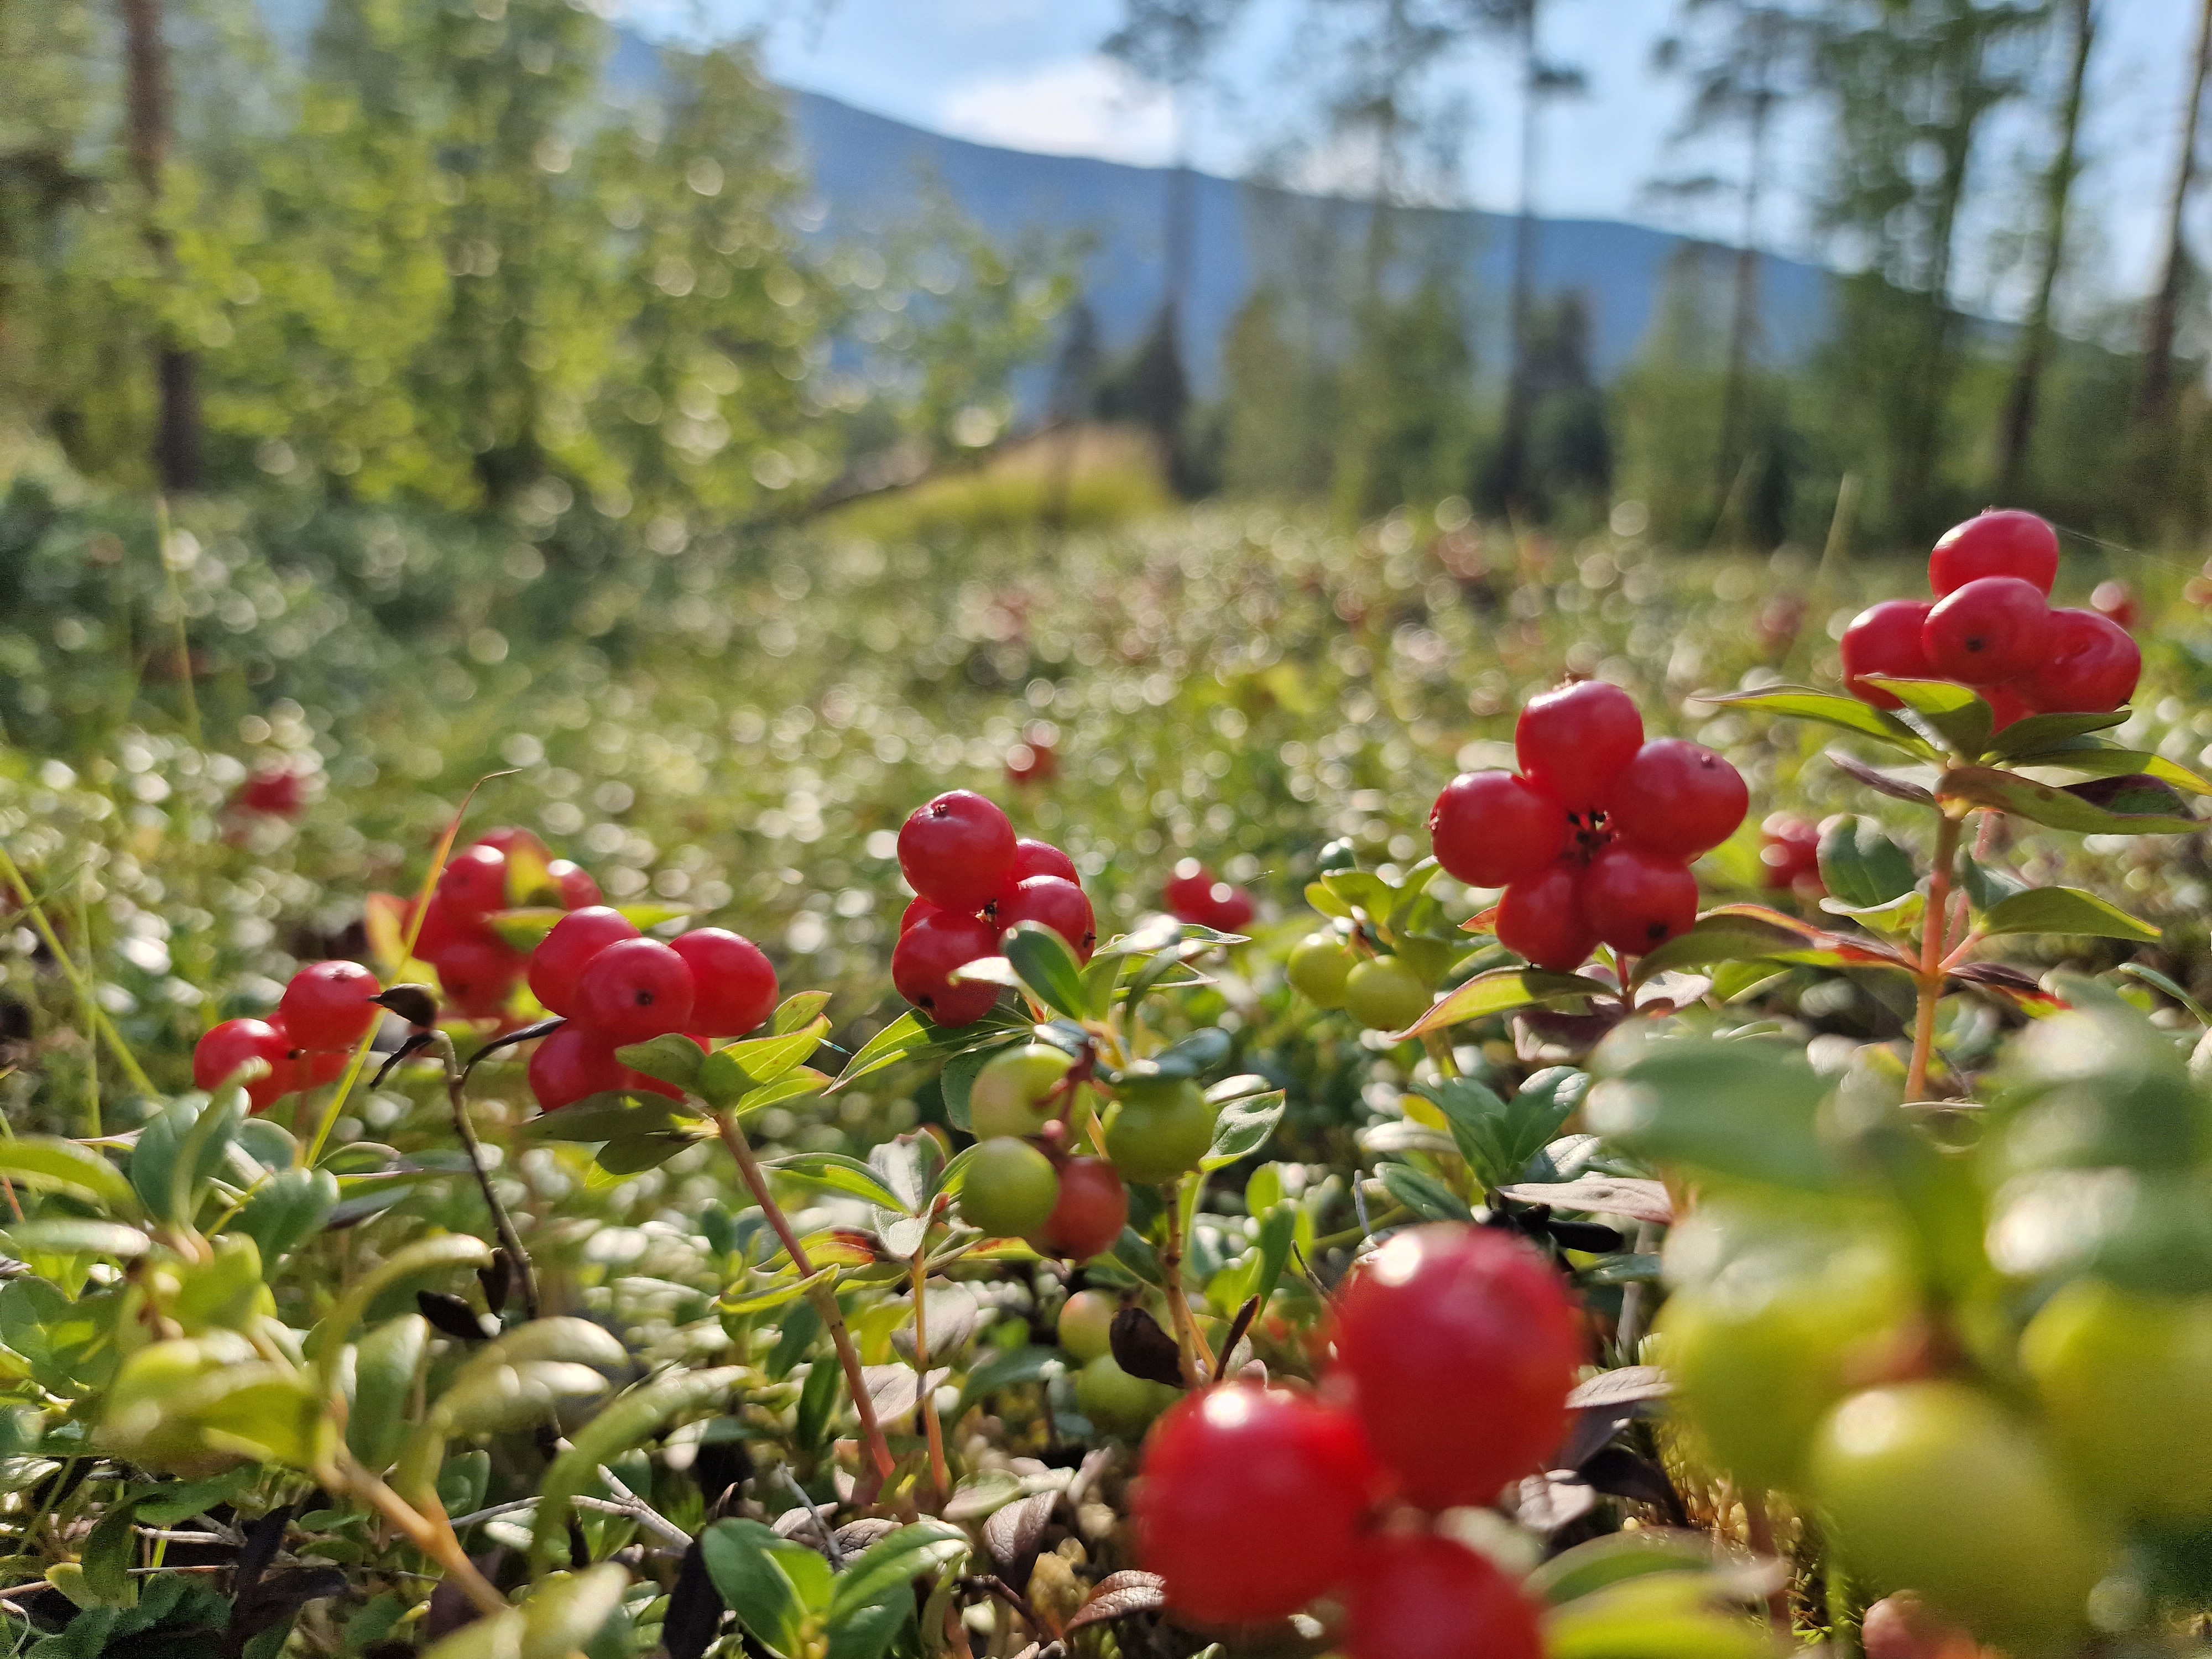
What’s also fascinating is that the same few non-native species – often hardy European forbs like Taraxacum officinale, Trifolium repens, and Rumex acetosella – pop up again and again, regardless of continent. These generalist species are good at exploiting disturbed habitats and are likely part of the global alpine invasion front.

Taraxacum officinale – the common dandelion – flowering at the top of a steep mountain trail in the Chilean Andes

So, should we worry?

Most of the non-native species we observed are not yet invasive. And we certainly recognize the many benefits of trails – for people, for recreation, and even for biodiversity in some contexts.

Trails can have positive effects on biodiversity as well! This trail in northern Sweden highlights how this may work, through the creation of microtopographical variation and variable levels of disturbance, they create a myriad of available niches.

But education matters. Encouraging hikers to stay on marked trails, limiting the expansion of trail networks, and raising awareness about their role in shaping ecosystems can help reduce further spread. Most of all, we need to focus on prevention – especially since the coldest, highest-elevation areas still remain relatively free of non-native species.

And while we may not stop every seed from catching a ride up the trail, this work shows we can still limit where it lands, and whether it takes root.

Reference: Barros et al. (2025). Beyond the Trail—Understanding Non-Native Plant Invasions in Mountain Ecosystems. Global Ecology and Biogeography. http://dx.doi.org/10.1111/geb.70060

Posted in General | Tagged , , , , | Leave a comment

SoilTemp is now MEB!

Over the past six years, I’ve poured my heart into SoilTemp. What started as a vision for a global soil temperature database quickly grew into something much more: a living, breathing community of researchers passionate about microclimate ecology.

From the beginning, we dreamed of SoilTemp as more than a dataset. It was meant to be a hub – a place where scientists from around the world could come together, share data, collaborate on methods, and push the field of global microclimate ecology forward.

We’ve come a long way. Together, we’ve consolidated methodological advances (think De Frenne et al.), launched workshops and conferences (the MEB-conference series!), and created a vibrant series of subgroups tackling diverse topics from cold-climate regions to peatlands. And recently, we’ve felt the shift – this is no longer just a project or a database. It’s a full-fledged network.

So today – as we shared by email to the whole network already before – I’m beyond excited to share a major milestone in this journey: SoilTemp is now MEB – the Microclimate Ecology & Biogeography network.

Our new logo!

This new name is more than just a name. It’s mostly a broader vision and a renewed commitment to collaboration, inclusivity, and openness. After months of discussion and feedback, we’ve redesigned the network to give people more ways to engage, contribute, and connect – wherever you are in your microclimate journey.


What’s new?

The ‘mycorrhizal mycelium’ of our new MEB-network, with all its branches that together support the ecosystem that is the global microclimate community

– A new name: MEB – Microclimate Ecology & Biogeography

We have long grown beyond soil temperature. MEB captures the full range of what we now study together: microclimate across ecosystems, across scales, and around the globe.

– A new database identity: MDB – the Microclimate Database

Our database is evolving too. MDB reflects the diversity of in-situ microclimate measurements we now host – from air to soil, from forests to tundra. We’re always welcoming new contributors. If you’ve got data, we’d love to include it!

– A fully integrated conference series

The MEB Conference series – always already explicitly part of SoilTemp – is now officially part of the network! After a fantastic launch in Antwerp (2022) and an exciting follow-up in Helsinki (2024), we’re thrilled to welcome you all at the next edition in Montpellier (1–5 June 2026). These events are about more than just presentations – they’re where we take the pulse of global microclimate research, and foster new collaborations.

– A new website: www.meb-network.com

Explore our new digital home for updates on the database, network activities, and upcoming events. You’ll also find our new visual identity here – inspired by the MEB conference series. Still some work to do to get all microclimate information in the same place, but we’ll continue updating it!

– New contact info

You can now reach us at MEB-network@outlook.com. Don’t worry – the old SoilTemp email is still monitored during the transition.


How to join?

And then, very importantly: we have created many more ways in which anyone from the community can get involved! One of the core values of MEB is openness. We want this to be a network for the community, by the community. Here’s how you can now get involved (in addition to submitting data to the database, that is):

  • Annual online general assembly – your chance to connect, share feedback, and help steer the network. If you’re in our mailing list, you’ll automatically receive the invite for this
  • MEB Scientific Committee – open to everyone who wants to get more deeply involved into strategic planning, scientific priorities and moving the field forward scientifically.
  • MDB Database Committee – help shape the future of our data infrastructure. This committee aims to be a balanced set of representative data contributors from all continents, as well as data users – who see most clearly what the database needs.
  • Tools & workshops – we’re building a resource hub with guidelines, webinars, and online workshops (coming in late 2025).
  • Topical subgroups – passionate about a specific environment or region? Join or start a subgroup! Current active ones include:
    1. Arctic/Antarctic & Above Treeline (AAAT)
    2. Drylands
    3. Peatlands

Want to start something new? Let us know – we’re here to support you.

More info and signup for any of these: Organisation – MEB Network


Looking ahead

We’re planning our first MEB celebratory general assembly for later this year – an open, online gathering for everyone in the network. It’ll be a chance to reflect, plan, and celebrate all we’ve built together. We hope to see many of you there!

To all of you who’ve contributed data, ideas, time, or support: thank you. This network exists because of you – and it’s only just getting started.

Let’s keep building the future of microclimate research. Together.

Posted in Science | Tagged , , , , | 1 Comment

BioTime 2.0

If we want to understand how biodiversity is shifting in this rapidly changing climate, we need two critical ingredients: microclimate time series and biodiversity time series. (And yes, let’s not forget good soil data – but let’s keep it simple for now).

For now, let’s celebrate a massive step forward for one side of that equation: the species. The long-anticipated release of BioTIME 2.0 is finally here – and it’s a game-changer.

BioTIME is the world’s largest database of biodiversity time series – carefully curated records tracking how species communities change through time across the globe. It spans nearly 150 years of observations, from the Arctic tundra to the Amazon rainforest, from 1874 right up to 2023. That’s 12 million records from over half a million unique locations, tracking more than 56,000 species across marine, freshwater, and terrestrial ecosystems.

This isn’t just a database – it’s the fingerprint of biodiversity change turned into numbers.

Unlike single-species records, BioTIME focuses on assemblages: communities of species living and interacting in the same place. That’s what makes it so powerful. Assemblage-level data lets us ask rich questions about species turnover, diversity, ecosystem function, and the often-surprising ways nature reshuffles itself in response to human pressure, climate shifts, and land use change.

Set up of the database, with repeated community surveys at the same location grouped per study, gathered from across the globe.

The new version – BioTIME 2.0 – massively expands both the taxonomic and geographic breadth of the database, and it wouldn’t exist without the collaboration of 485 co-authors from over 400 institutions across 40 countries. It’s beautiful open science in action, global cooperation and collective vision.

The mindboggling global coverage of BioTIME 2.0

And this isn’t just academic. BioTIME has already changed how we think about biodiversity change. It’s helped move the conversation beyond simplistic narratives of universal decline, showing instead the messy, complex, local realities of species redistribution, community reshuffling, and ecological reassembly. Exactly what we have been anticipating here on The 3D Lab due to the complexities of local microclimate and other environmental conditions. As such, BioTIME 2.0 is the tool we needed for thinking deeper about how the world is going to change in all its glorious chaos.

So what’s next? More data, of course. BioTIME is alive – actively growing, with new studies still being added. But also, the database is freely available for anyone to explore, and it’s already fueling everything from local conservation planning to global policy discussions. And then, there is my dream: easy integration of that database with the microclimate data (in-situ or modelled) we are generating in the Microclimate Ecology & Biogeography-community.

Indeed, for those of us in the world of species on the move, this new database can be a game changer. With high-resolution environmental data becoming more available, and now with BioTIME 2.0 in our toolbox, we’re again one step closer to scaling biodiversity science – across time, across space, and across systems.

We added repeated vegetation surveys from our long-term monitoring sites in northern Scandinavia to the database. Hopefully soon, our EcoFracNet-project can also add data!

Posted in Science | Tagged , , , , | Leave a comment

Reimagining species on the move

I still remember those first groundshattering papers showing the impact of recent climate change on biodiversity. For decades, climate change had been looming in models and predictions — but suddenly, the evidence was real, visible in the field. Species weren’t just coping; they were moving. Polewards. Upslope. Earlier in the year. The fingerprints of a warming world were showing up in ecosystems across the globe.

What started as a trickle of evidence has grown into a flood. Today, the effects of climate change on biodiversity are so marked that even the simplest analyses can reveal them: species shifting uphill or toward the poles, flowering earlier, or altering migration schedules.

But here’s the catch: most research captures these shifts along only one axis – usually space (e.g. latitude or elevation) or time (e.g. phenology). The reality is far more complex. And we think it’s time to change that.

We – the participants of the wildly successful Species on the Move conference – came together to understand how species are responding to our rapidly changing world. The conference series has become a central hub for this kind of work, bringing together ecologists, biogeographers, and conservation scientists from around the globe. Two years ago, we gathered under the blazing Florida sun to take stock of where the field stood. (More on that memorable meeting here: https://the3dlab.org/2023/06/02/species-on-the-move-2/.)

Green anolis, one of the many animals around our Florida meeting reminding us vividly what we are fighting for

Following that conference, a focused workshop sparked a key realization: while we’ve long known species are on the move, we’ve vastly underappreciated how multidimensional that movement might be.

Species don’t just move north or bloom earlier — they respond to climate across multiple axes and at multiple scales. Some shift upwards in the canopy or burrow deeper into the soil. Others track temperature changes within a growing season, or even across the day–night cycle. From daily rhythms to elevational climbs, organisms navigate a multidimensional thermal landscape.

 Species track temperature in both space and time, at varying scales. This tracking could happen the ‘traditional way’, to higher latitudes or up the mountain, but also vertically within the vegetation or under water, or within the growing season or even within a day – species have a whole multidimensional climate space available to them to move in.

This has quite important implications, you know. It means, for example, that we may be underestimating species’ capacity to track climate change. A species might not shift northward as expected, but may instead emerge earlier in the season, find cooler microhabitats nearby, or shift into new life-history timings – adaptations that go unnoticed if we’re looking in only one direction.

The way a species responds depends deeply on its ecological context — the landscape, the climate, the traits. In some systems, spatial shifts dominate; in others, time is the primary axis of change. Often, it’s both — and more.

To capture this complexity, we argue for a paradigm shift: one that recognizes that species are moving not just in one direction, but across multiple dimensions of space, time, and thermal scale. In our recent synthesis, we outline a conceptual framework that reflects this – highlighting how species can and do respond to directional climate change along intertwined spatial and temporal gradients, from the macro to the micro.

Why does this matter? Because future conservation and management strategies depend on our ability to anticipate where, when, and how species will respond to continued climate change. A multidimensional understanding allows us to improve our attribution, sharpen our predictions, plan better interventions and make better use of the complexity of ecological landscapes to protect biodiversity there where it wants to be.

Species are moving. But to keep up, we need to follow them not just north, but up, down, deeper, earlier – and in every direction climate change makes available!

Check out the full paradigm shift in our recent publication: Fredston, A. L., Tingley, M. W., Neate-Clegg, M. H., Evans, L. J., Antão, L. H., Ban, N. C., … & Scheffers, B. R. (2025). Reimagining species on the move across space and time. Trends in Ecology & Evolution.

Posted in General | Tagged , , , , | 1 Comment

What mountain roads do to root-associated fungi

Some papers just hit harder than others. And this latest one – just out in Molecular Ecology – sits right at the top of the epic scale. The topic? The impact of mountain roads on plant-fungal interactions.

Here’s the thing: we’ve been looking at the effects of mountain roads for years – since 2007, in fact, when the first surveys of the Mountain Invasion Research Network (MIREN) kicked off. And over time, we learned a lot: changes in plant communities, upslope and downslope shifts in distributions, effects on functional traits – you name it. But one thing remained a mystery: what was going on belowground.

So, we decided to go digging. Literally.

We set out with an ambitious plan: sample roots from long-term MIREN plots – both roadsides and adjacent vegetation, across elevation gradients and multiple regions. The goal? To understand how root-associated fungi respond to road disturbance, and whether these patterns shift with altitude or across continents.

A Norwegian forest understory of Cornus suecica and Vaccinium vitis-idaea, one of the vegetation types of interest in our study.

Solid idea, right? But then came the execution.

Enter the epic field trips: Norway, Chile, Argentina. Samples flown in from Tenerife and the Czech Republic. Sorting root samples. Washing them. Cutting them into tiny pieces. Amplicon sequencing to reveal the fungal communities hiding inside. Add in a freezer disaster that cost us an entire region’s worth of samples (yep, that happened!), and then the analytical rabbit hole: plant species, fungal species, interactions, co-occurrence patterns… A deep dive into Joint Species Distribution Modelling to figure out what we can and cannot tease apart from this complex mess.

Scouting for plants in the Andes

Honestly? Easily the most time-consuming paper I’ve worked on so far. And that doesn’t even count the countless hours of meticulous, patient work by first author Dajana – without her expertise in soil microbial ecology, this paper simply wouldn’t exist.

But oh boy, was it worth it.

For the first time, we can now see the belowground implications of these heavily studied mountain roads. And the impact? Brutal. Roadside plots consistently showed a collapse in the complexity of plant-fungal and fungal-fungal co-occurrence networks – by 66–95% and 40–94% in total edge density, respectively. And yet, interestingly, fungal richness didn’t go down. Many of the key taxa were still present.

What this tells us is that the species are still there – just like aboveground, where we often see even more plant species in roadsides than in adjacent plots. But their networks are gone. Their roles, their interactions – the whole belowground social fabric – has unraveled. They’re in the roots, but they’re not doing what they’re supposed to be doing.

Example plot visualizing the loss of interactions in Chile. Each blue dot is a negative link between two species, each red dot a positive link. The left side shows the situation in the adjacent vegetation, where two groups of co-occurring species are clearly identified. The right side is the situation in the roadside, where that whole interaction network is disrupted and only some scattered points remain.

And in that ecological vacuum, the usual suspects step in: generalists like arbuscular mycorrhizae, who aren’t very picky about their plant partners, and pathogens with low host fidelity. They thrive. But more host-specific fungi – like ectomycorrhizae – don’t. Just like we saw in several of Jan Clavel’s PhD papers (e.g., here), those specialists don’t fare well in these unpredictable, human-altered environments.

Echium vulgare, one of the many European non-native species in Chilean roadsides. New species bring new belowground interactions, and networks that are often substantially less mature.

Our takeaway? Road disturbance leaves a consistent negative imprint on the connectivity between plants and fungi. It’s a stark reminder that even systems with high species richness can be fundamentally unstable and vulnerable – especially when facing additional pressures like climate change and biological invasions.

Road disturbance in action high in the dry Andes west of Mendoza, Argentina

So yes – please take the time to dive into this paper. We poured our hearts into it.

Reference: Radujkovic et al. (2025). Road Disturbance Shifts Root Fungal Symbiont Types and Reduces the Connectivity of Plant-Fungal Co-Occurrence Networks in Mountains. Molecular Ecology. https://doi.org/10.1111/mec.17771

Posted in Science | Tagged , , , , | Leave a comment

The Tea Bag Index: simple on the surface, complex beneath

Oftentimes the simplest scientific methods hide a whole iceberg of complexity. The Tea Bag Index (TBI) is no exception. On the face of it, it’s brilliantly straightforward: bury some green and rooibos Lipton tea bags, dig them up after about 90 days, and compare how much they’ve decomposed. What could be easier?

Well… as always in science, a lot, actually.

Our recent paper in Ecology Letters, based on a whopping 36,000 tea bags, sparked some healthy scientific debate. In a follow-up response to critiques by Mori (2025), we now dove deeper into the assumptions behind the TBI and clarified what this method can and cannot tell us.

At its core, the TBI is designed to give everyone – from scientists to students and citizen scientists – an accessible way to study decomposition across environments. It does this by estimating two key values:

  • S_TBI: how much material resists decomposition (a stabilisation factor)
  • k_TBI: how quickly decomposition starts (an initial rate)

The method’s strength lies in its simplicity and global standardisation. It allows us to compare results across locations and climates without the messy variation of local litter types. That makes it incredibly useful for large-scale studies. But because it’s such a simplification of the real world, it’s important to use it with care.

What the TBI tells us – and what it doesn’t

Plant material, including tea, breaks down in stages. Some parts go fast, others hang around for years. The TBI focuses on the early, fast stage, but in the real world, the slow stuff might start decomposing earlier than assumed. So, while the TBI gives us a valuable snapshot of early decomposition, it doesn’t reflect the full timeline of what happens to organic matter in soil.

Simplified TBI-model (left and middle) versus a more realistic decomposition model (right).

Rethinking the assumptions

The TBI assumes that 90 days is enough for green tea to reach a stabilised phase (so you can measure S_TBI) and that rooibos tea is still in its early phase (so you can measure k_TBI). Our data confirm that green tea generally fits this assumption well. Rooibos tea, however, shows more variation – and that variation isn’t always easy to explain.

Another assumption is that we can use green tea’s stabilisation factor to estimate that of rooibos tea. But our findings show that the predicted stabilisation (S_TBI) doesn’t always match what’s actually observed in long-term rooibos data. In fact, applying S_TBI early on might inflate k_TBI. However, since k_TBI tends to underestimate actual decomposition rates (k_real), this may not be a major issue.

So, what can we trust?

Despite its imperfections, the Tea Bag Index remains a valuable tool. It captures short-term decomposition well and enables comparisons across environments by using a consistent material. It’s not meant to replace more detailed, site-specific studies – it’s meant to complement them.

For future work, we suggest treating the two TBI parameters – k and S – as distinct components shaped by different environmental drivers. Combining TBI results with chemical analyses and longer-term studies could help bridge the gap between simplicity and ecological realism.

In the end, the Tea Bag Index doesn’t capture the whole story of decomposition – but it does capture a really useful chapter. And sometimes, that’s exactly what you need.

Posted in General, Science | Tagged , , | Leave a comment