One of my dreams since the start of the SoilTemp project: bringing all microclimate enthusiasts together at their own dedicated conference…
Now, this dream will become a reality with #MEB2022, an international conference on Microclimate Ecology & Biogeography which we will host here at the University of Antwerp.
Today, we launched the website (www.meb2022.com) and abstract submission, hoping to attract up to 100 international experts to Antwerp.
Now crossing fingers on this exciting ride to March 28th, 2022.
Consider development of microclimate sensors a closed and finished field: the ultimate product is now on the market!
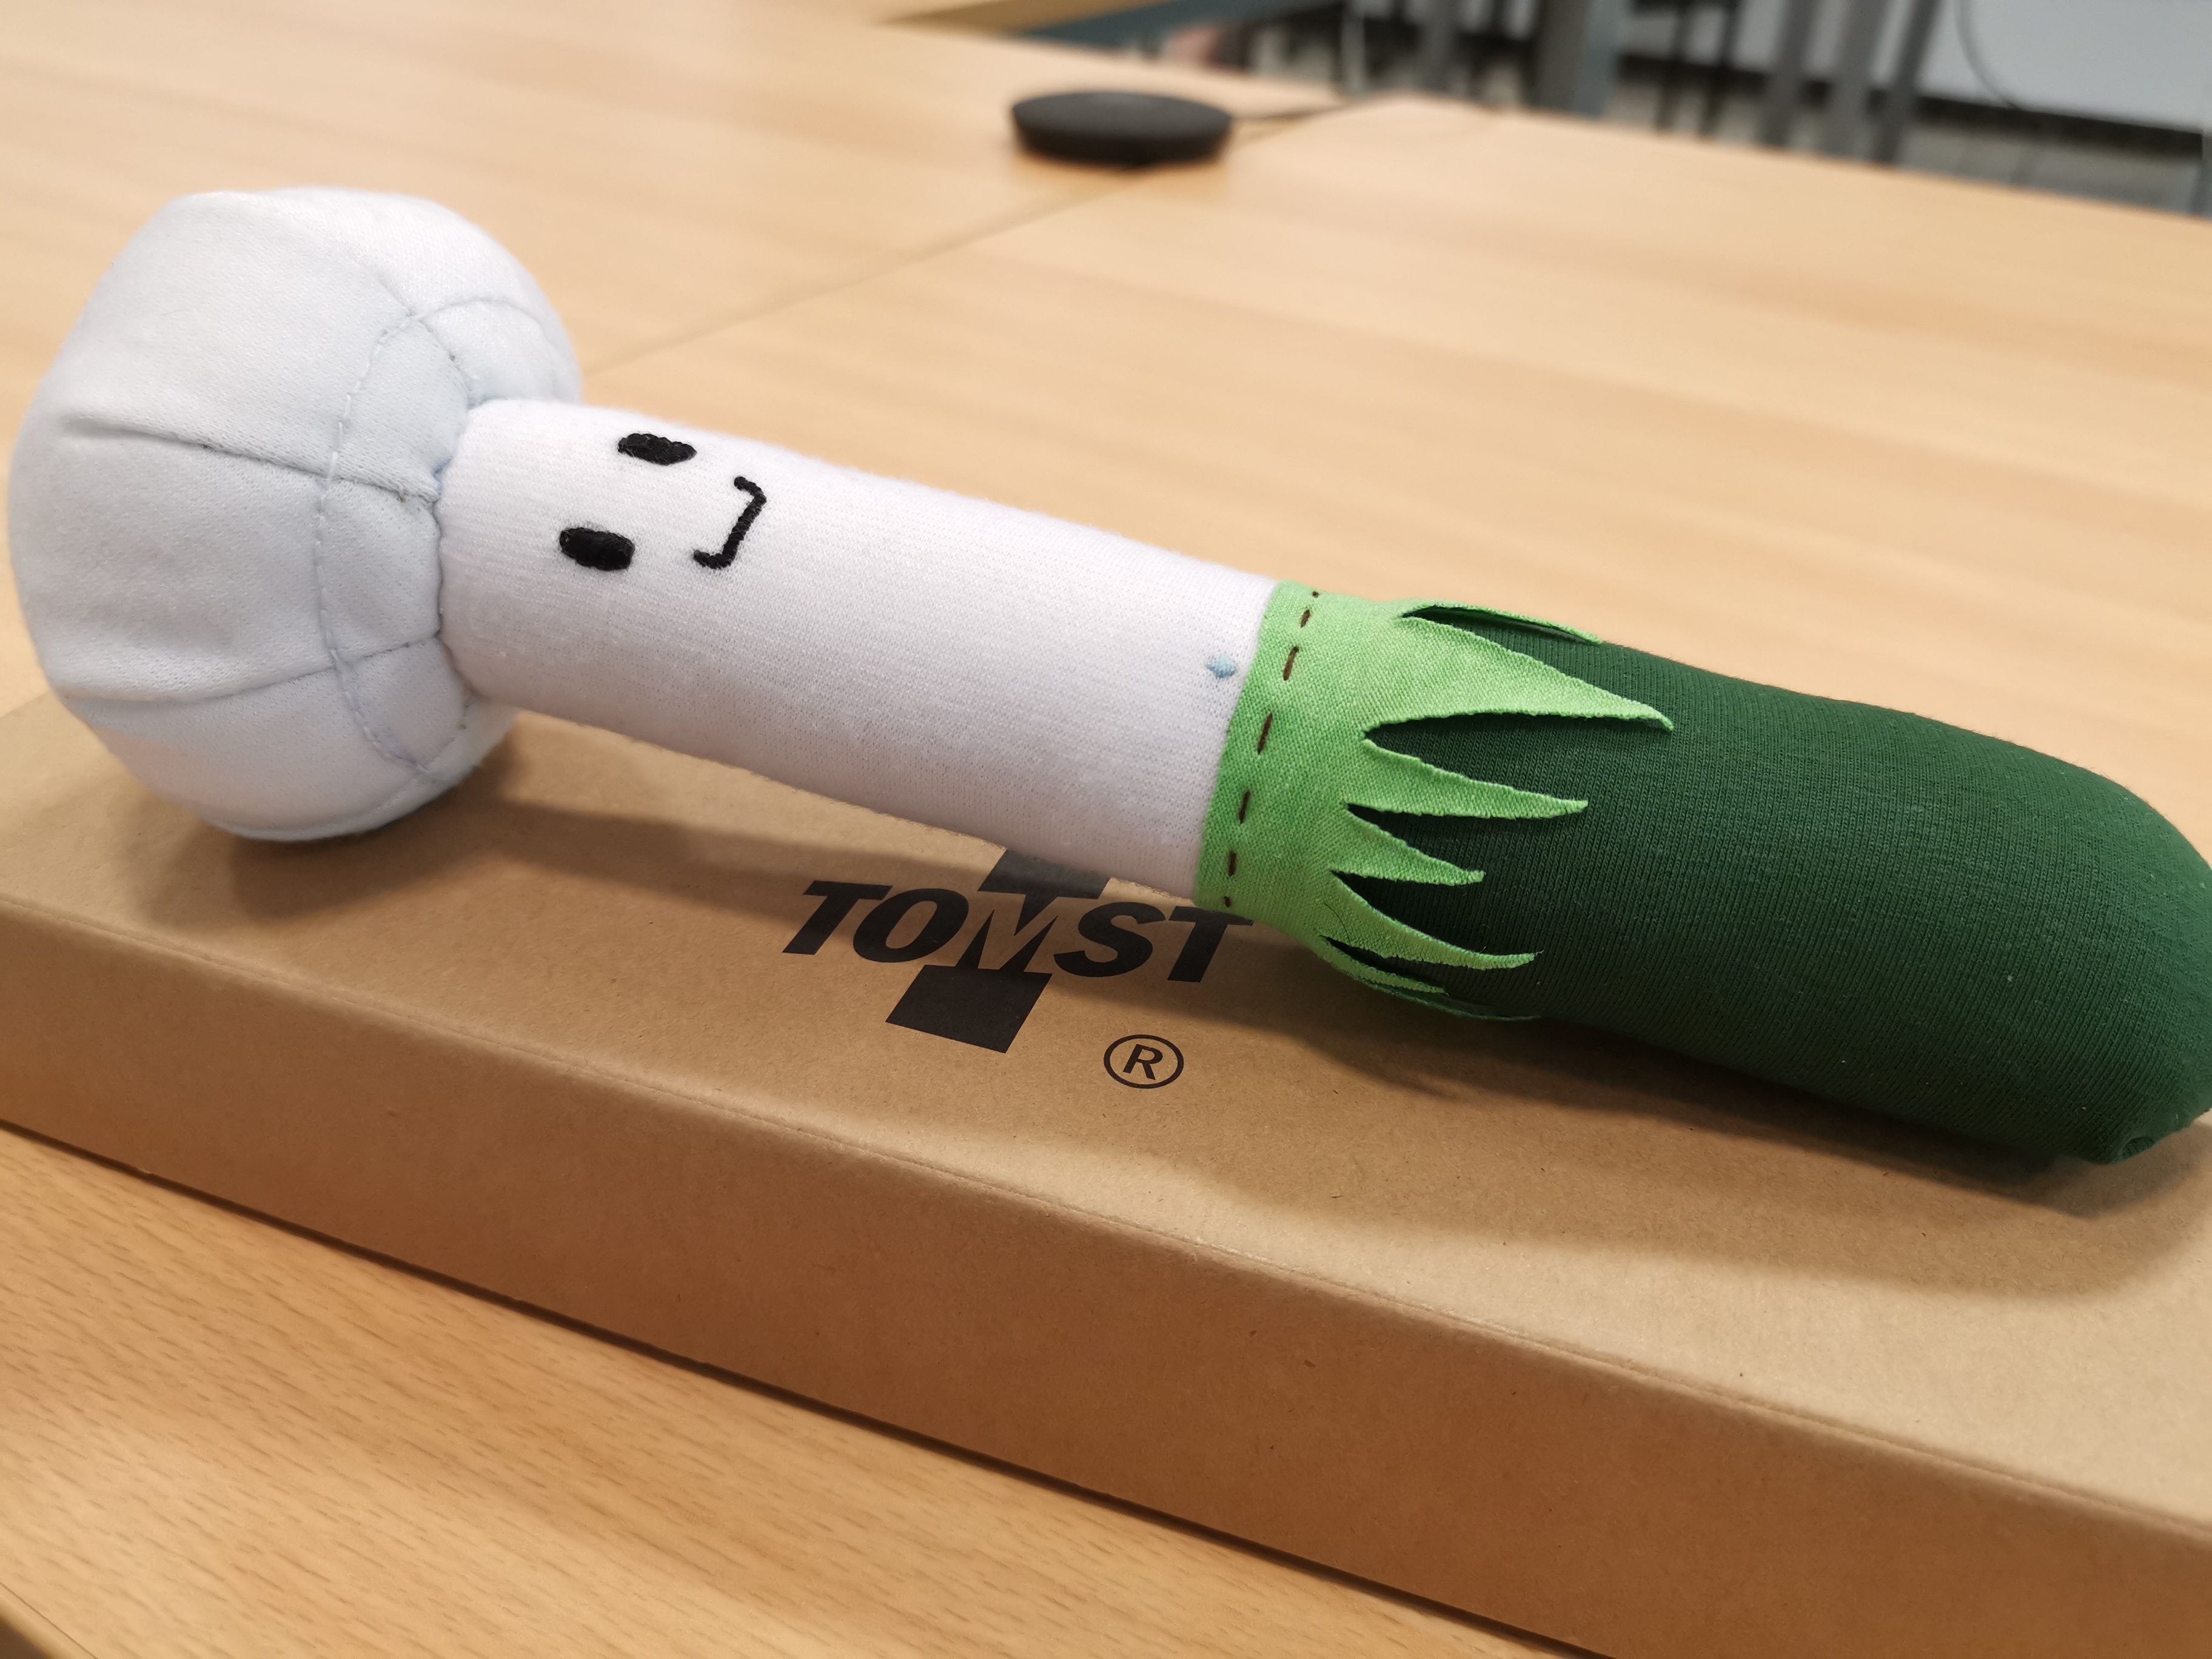
Thanks to the partner of our colleague Stijn, I got the most beautiful pluche version of a TMS-version, which we immediately bombarded to the mascotte of our citizen science project.
Look what an absolute cutie!
The youngest microclimate ecologist here at home is in any case a big fan of the new ‘mushroom’, although she still really loves those funny ones with the blue blinking light that daddy distributes all through the garden.
EDIT: baby 2 wants me to publicly apologies as I made a mistake in the calculations with her data (for the R-people, as.POSIXct got me). Post now updated!
This summer, we doubled the sample size of our offspring experiment. We now have a sample size of n=2, so data analyses are really gearing up now!
The two test subjects interacting
First up, that crucial question: how are the nights? Are you getting some sleep? And most importantly, is baby 2 giving you a harder time than baby 1?
I’ll tell you our hypothesis first: we are feeling much better. Baby 2 seems to be giving us much more solid blocks of sleep than baby 1 did. We have vague memories of these first weeks with the first one, where we were bouncing a child through the living room in the middle of the night, trying in vain to get her screams to stop.
Baby 2 also has some issues (reflux is a bitch, I’ll tell you), but overall crying feels much lower, and sleep patterns more consistent. But does the data agree with our analysis? Let’s dive in!
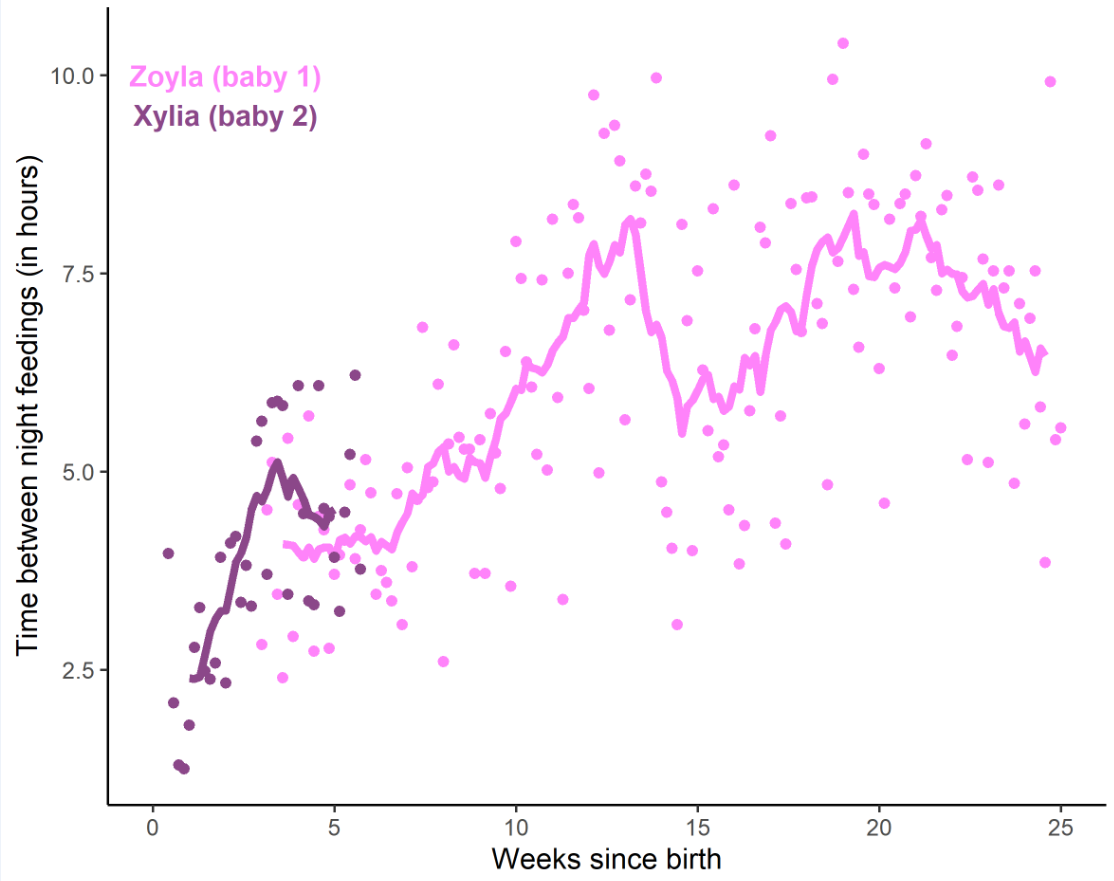
Proxy of how much sleep we have been getting at night over time, using the hours between the two main night feedings (evening and early morning). Data for two different babies relative to their respective birth date. Note that we started tracking much earlier for baby 2, yet that she is obviously much younger at the moment.
After a first erroneous analysis which seemed to prove our hypothesis wrong, we can now proudly say that baby 2 indeed seems more parent-friendly! With things rapidly improving during the first few weeks (note that we were too flabbergasted to track those with baby 1), baby 2s performance has at first been more than an hour and now still on average more than 15 minutes above the one from baby 1.
Of course there is more to the night than the time between the two main feedings. While baby 1 always had a lot of trouble in the morning (so after that nightly feed), baby 2 also seems to be struggling through these hours a lot more independently. As a result, I now often find myself in bed at 6h30 in the morning, a rare sight with baby 1! So yes, life with baby 2 is a lot more livable than it was with baby 1.
Life with 2 is in any case much better than with 1!
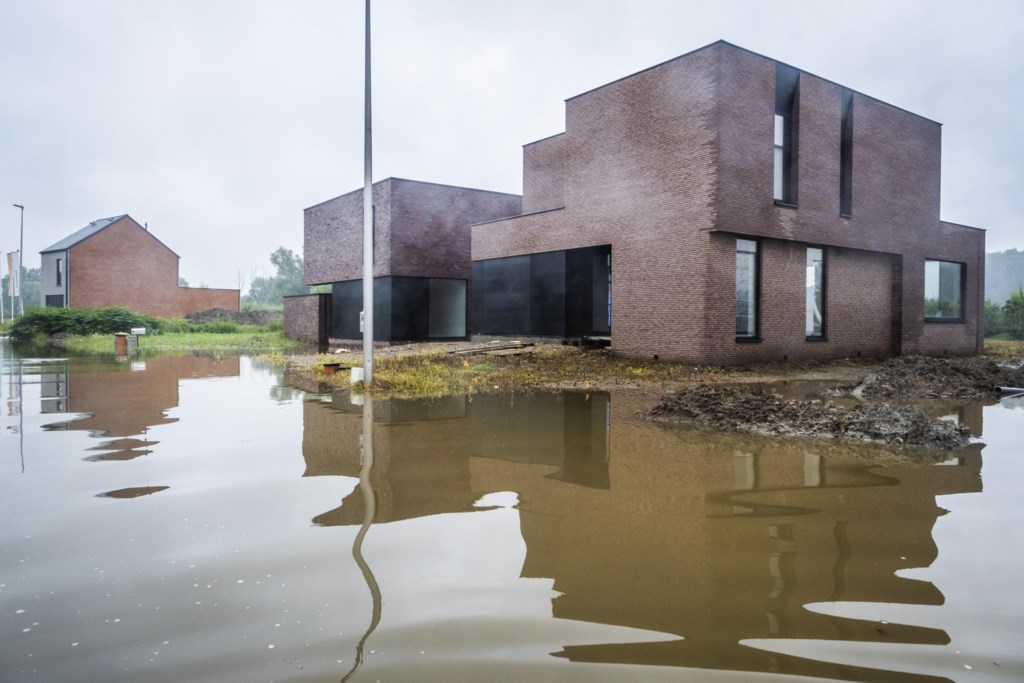
The wettest summer in two centuries is an unexpected windfall for our citizen science project ‘CurieuzeNeuzen in de Tuin’ (CNidT). Our garden sensors fill a black hole in our knowledge: how can gardens act like sponges and buffer extreme rainfall?
Check out the original article from De Standaard, in Dutch, by Ine Renson!
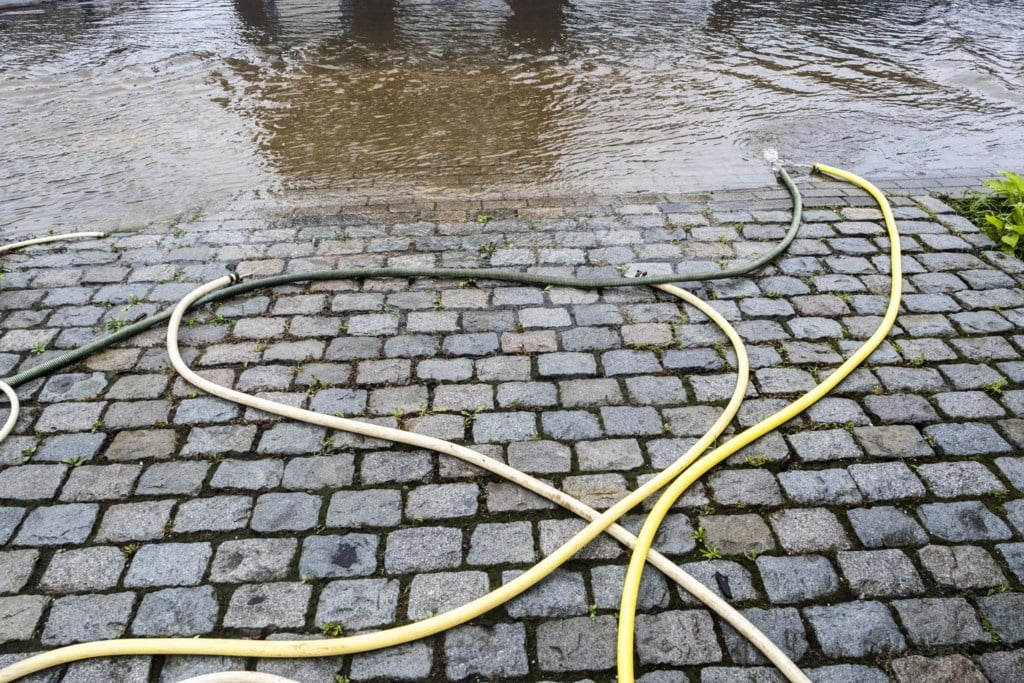
Every liter of water sucked up by a garden results in less inconvenience during extreme rainfall. Copyright Dieter Telemans for De Standaard
An unexpectedly wet spring, which cumulated in the extreme precipitation of mid-July with a hopeless string of crappy days in August: for a large-scale citizen science project on heat and drought in gardens and parks, it seems like a worst-case scenario. But the climate researchers of the University of Antwerp who are responsible for the project show no sign of panic. On the contrary.
‘This is better than we could dream of,’ says Jonas Lembrechts, who is the scientific coordinator of the project. ‘With CNidT we are investigating how gardens can arm themselves against extreme weather conditions. Given the trend of recent summers, the focus was on heat and drought. But our soil sensor, which records moisture and temperature, can tell us as much about wet and cold. Because of this summer’s exceptional situation, we are therefore happily switching the focus to extreme precipitation. It’s just the other side of the same coin.
For scientists, this is a golden opportunity. This is the wettest summer in two centuries, and just now we have 5,000 sensors in the soil all over Flanders. We were unexpectedly handed a unique dataset,’ says Lembrechts. ‘With unprecedented accuracy, we can map out how our gardens are able to accommodate large amounts of precipitation.’
“Snertzomer”
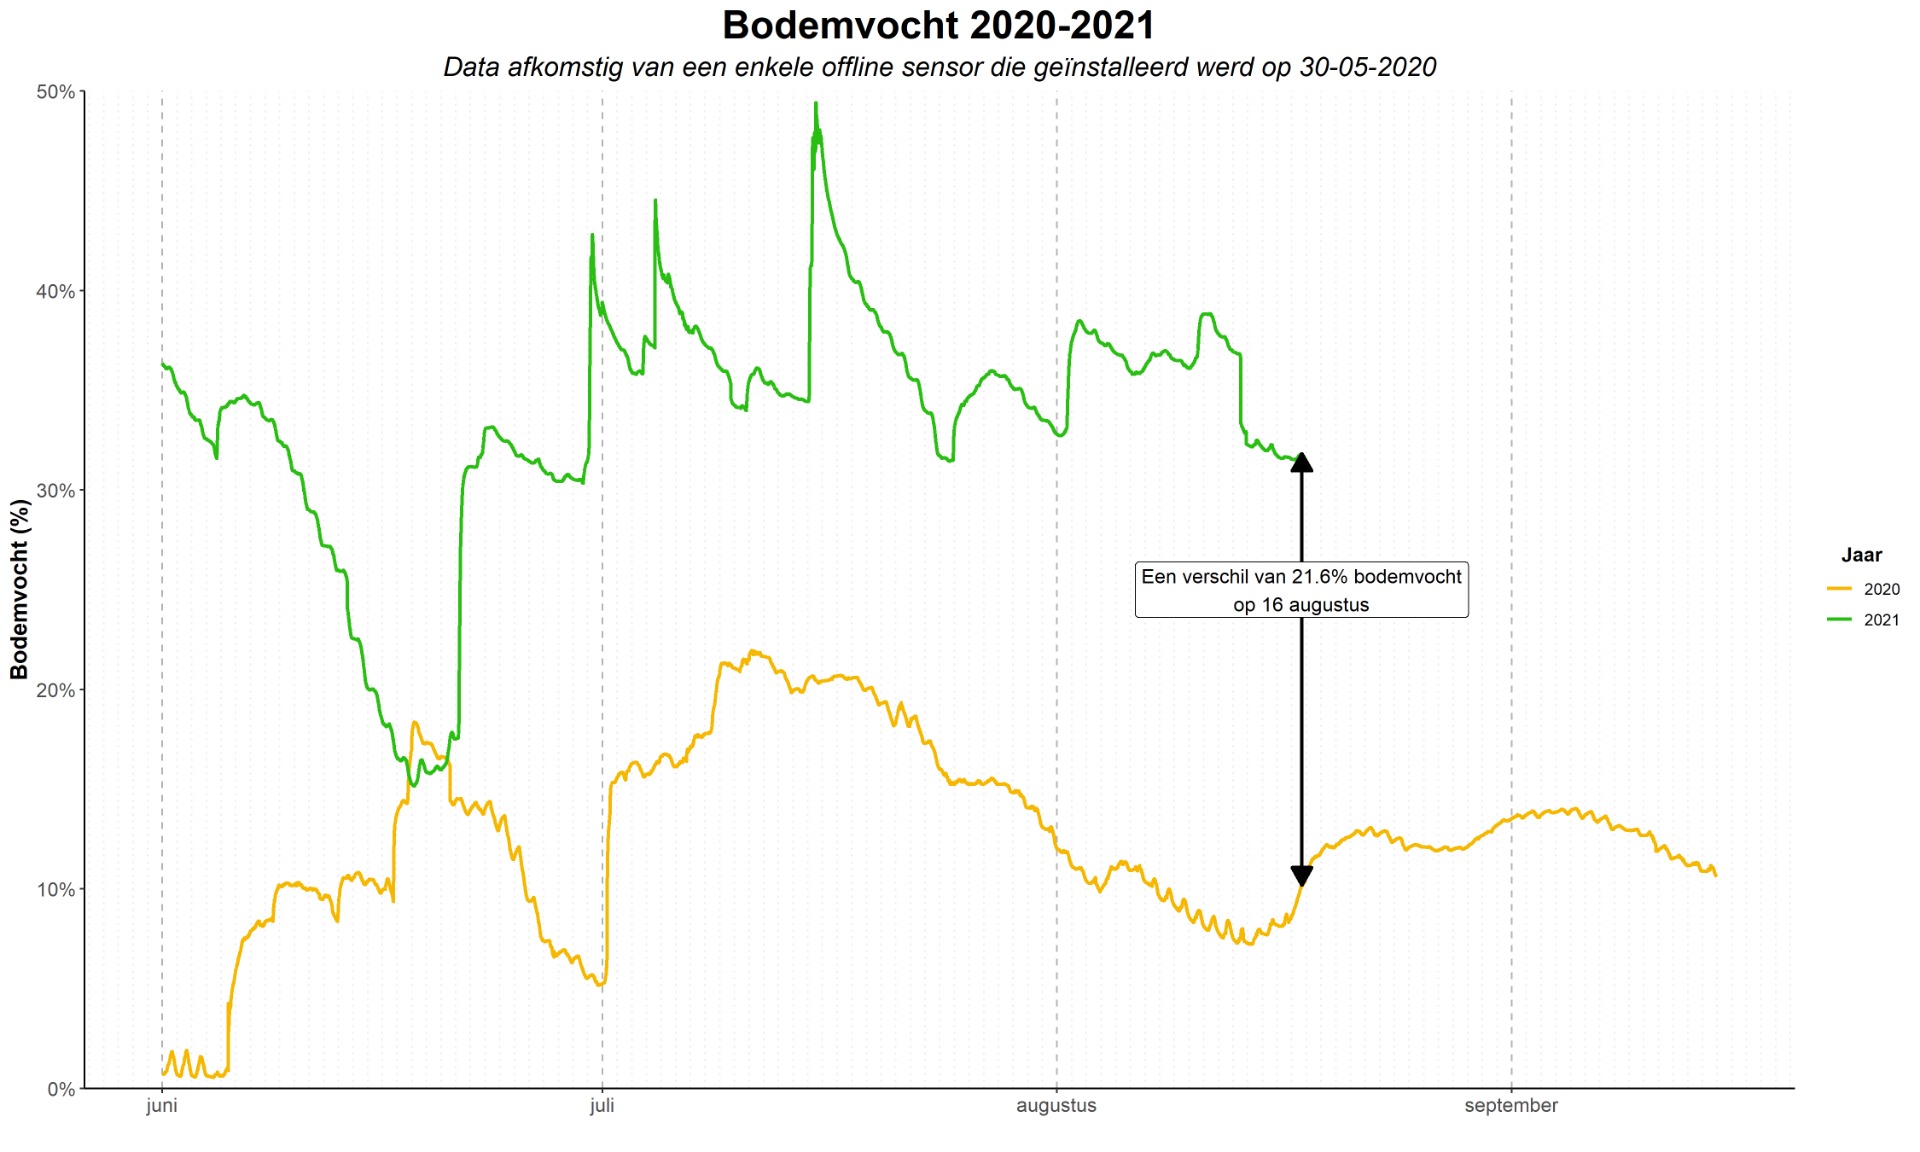
Just how extreme this summer was can be seen from the graphs drawn by Stijn Van de Vondel. As a test case, the researcher had already installed a TOMST TMS-sensor in his Kempish garden last summer. This allows us to visually compare the wettest and one of the driest summers of the past century. ‘Except for a few June days, this summer was much wetter than the previous one,’ he says. According to the data from the Royal Meteorological Institute (RMI), June and July had exactly the same number of rainy days as the previous year. But when it did rain, a lot more fell from the sky. This is also evident from my soil sensor: the humidity level at the end of June shot up to 30 percent and has not dropped below that since, with peaks in July between 40 and 50 percent. Imagine a sandbox with half sand and half water in it: that’s a mud puddle. We were at the limit of what a soil can swallow in July.’
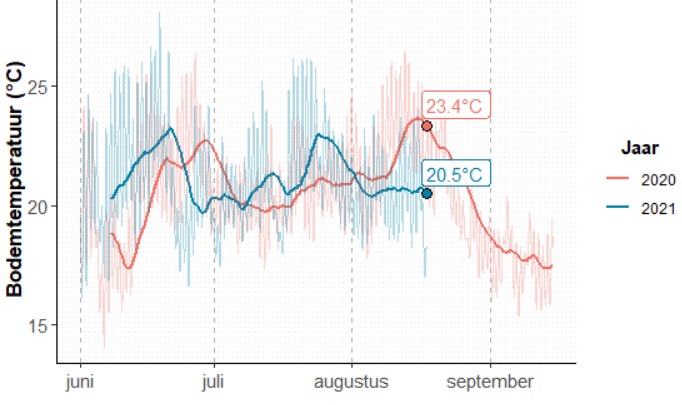
Soil temperature in a Flemish garden in 2020 (red) and 2021 (blue)
But contrary to popular belief, this summer was no cooler than the last. The temperature curves of 2020 and 2021 above are playing leapfrog. This pattern is also confirmed by the figures from the RMI. ‘Because of the rain, we have the idea that it is a thoroughly crappy summer,’ says Van de Vondel. But as far as the temperature is concerned, that’s not true: this drizzly summer was not colder than average. That too is relevant in the light of climate change: we won’t get really cold summers very often anymore.’
Pavement
Concerning that extreme wetness, CNidT brings fascinating insights. ‘The RMI data tell us where exactly how much precipitation has fallen,’ says Van de Vondel. ‘The Vlaamse Milieumaatschappij has accurate data on groundwater levels. But there is a blind spot in between: how much of the precipitation that has fallen is actually stored in the soil and transported to the deeper layers of the ground, e.g. via our gardens? And what proportion flows away via sewers, canals and rivers?’
Copyright Dieter Telemans for De Standaard
For the first time, we are going to be able to fill in the missing link in detail and on a large scale,’ nods Lembrechts. We can indicate which gardens store a lot of water and which do not. And, importantly, why. Because there are often large differences between two gardens in the same municipality. Insights into these dynamics is essential if we are to pursue a good water policy.
From previous ecological research we know that the same factors that protect our lawns from extreme drought are also decisive in the fight against flooding. One hypothesis is that the degree of hardening in a garden or its surroundings plays a crucial role. ‘The degree of paving seems essential to determine how much a garden can buffer, and thus to what extent you can avoid the risk of flooding,’ says Lembrechts. ‘It determines how hard a garden has to work to handle the falling water. For example, in a highly sealed region with small gardens, each garden will have to swallow more. We’re trying to put that into numbers now.’
Whereas in Wallonia it was mainly the topography that determined the consequences of the flooding (extreme precipitation running down the slopes and converging at the lowest point in the valley), in Flanders it is mainly the large and spread-out paved surfaces that are the Achilles’ heel, in addition to the fact that we continue to build in flood plains.
But vegetation also explains how well a garden can buffer water. Lembrechts: ‘Rain sticks to the leaves of trees and plants, it always takes a while for the drops to fall through. This causes a delay in the peak of the water flow, which can make a crucial difference during a cloudburst. Trees and plants therefore form an initial buffer. Moreover, through their roots they suck some of the water out of the soil, and evaporate it through their leaves.’
4,100 Olympic swimming pools
De-watering, greening: the measures to be taken against drought and heat will also protect us against the consequences of extreme precipitation. Next month, the researchers hope to come up with accurate figures and insights into the sponge effect of our green spaces. ‘But already it is clear how important they are as a lever in the fight against climate change,’ says Van de Vondel. ‘During the mid-July flood, the garden complex, along with the parks and natural areas, buffered 4,100 Olympic-sized swimming pools of water, according to an initial estimate. That’s huge. That volume would otherwise have run off and put extra pressure on our sewers and roads. Every gallon of water sucked up by a garden results in less inconvenience during extreme rain events.’
Soil moisture in a Flemish garden in 2020 (orange) and 2021 (green)
The defense against the consequences of severe weather or rising sea levels is therefore not only in ‘gray infrastructure’ such as dikes, dams and sewers, but increasingly also in ‘green infrastructure’ such as gardens, wetlands, wadis and flood plains. The realization is dawning that we no longer need to defend ourselves against water, but that we must learn to live with water and the opportunities it offers. The data from CuriousNoses provides insight into how we can do that more efficiently.
This is actually a story of collective responsibility’, says Lembrechts. The question is not so much which Flemish garden functions best as a sponge or air-conditioning system, but how we can use the garden complex as a whole to optimally store water or cool cities. Some gardens buffer more than others, but each contributes its own bit. We don’t always realize it, nor do you see it from the street. But together we have a big impact. If we were to pave over our gardens and green spaces en masse, the news would be even more dramatic in the next extreme rain event. If we do the opposite, we can mitigate its impact. The decisions you make in your garden thus make a huge difference in economic and ecological cost, and most importantly in the human suffering involved.
That wonderful feeling when my R-code can help the local animal shelter with their hundreds of kittens.
Fostering kittens to health and to a safe home; getting as many as possible of the street and neutered
I have been monitoring the number of foster kittens in our local animal shelter for 4 years in a row now, keeping track of how many come in and go out. While it’s impossible to predict exactly how many and when they will come in, it’s clear that there is a strong seasonality to the kittens: by May it takes off with the first bottle-feeders, and things rapidly accumulate till mid July, when around 100 foster cuties at the same time are being nursed towards a good home.
Number of kittens fostered on each day of the year by the foster parents of the animal shelter, from 2018 to 2021
But then there was last year, 2020 (the red line in the curve above), a year we all know as quite unique, with a global pandemic keeping everyone at home. A year that was different in many aspects and, turns out, also in its foster kittens: the peak stayed out, with number of kittens in the shelter around 60 throughout the whole summer.
Our hypotheses? Either 1) the animal shelter was actually winning the fight against the feral cats, and numbers of kittens would go down further, or 2) kittens were there in 2020, but there was nobody to find them and bring them in, due to that wretched pandemic.
Cute and off the streets, that’s how we love our kittens
The important consequence of those very different hypotheses? When preparing for the summer of 2021, we needed to know how many foster parents would be needed. Basically: fewer (in case of hypothesis 1) or more (in case of 2).
We thus decided to keep very close track of the numbers, using the nice little graph above, that I could update repeatedly. In early May we already started to see the first signs: the black line was peaking upwards faster than it’s red precessor. That’s when the red flags already started to go off: we were likely heading for scenario 2) and had to bring in a lot more help: a massive flood of kittens, as all those unchecked feral cats from last year had started breeding.
Now, mid August, the second hypothesis is clearly confirmed: we are already 25% above the summer peaks from last year, and the foster families are scrambling to keep up. The global pandemic indeed left its footprint on our data for two years in a row
Luckily we came into the year hypothesis- and data-based, as now we were a lot better prepared and ready to react quickly!
If you run out of human foster parents, get the animal ones on board!
In 2016, we published the results from a much-needed experiment. We had sown seeds in two extreme environments: the north of Scandinavia, and the very south of Chile, to answer a fundamental research question in invasion ecology: what is the most important driver of plant invasions in mountains?
Results of that experiment were overwhelming: whatever the temperature – both regions have a harsh climate that should limit plant invasions – human disturbance always came out on top: if humans disturbed the vegetation, plant invasions soared. No disturbance made successful establishment of non-native species virtually impossible; and that all along the elevation gradients in both Chile and Scandinavia.
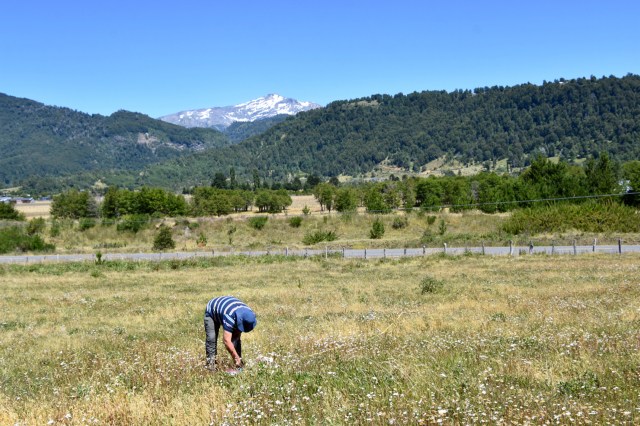
A plot of our seed-addition experiment overlooking the Street of Magellan in the very south of Chile
However convincing, those results were ‘only’ experimental. Question remained if that dominance of anthropogenic disturbance would hold up in a real setting. To settle that argument, we went to the Chilean Andes, where we monitored non-native plant richness and abundance along three mountain roads using the trusted survey design of the Mountain Invasion Research Network (MIREN, www.mountaininvasions.org). Along these roads, we assessed the relative importance of anthropogenic (human disturbance), abiotic (e.g. the climate, but also soil nutrients), and biotic (interactions with the native vegetation) factors as drivers of plant invasions.
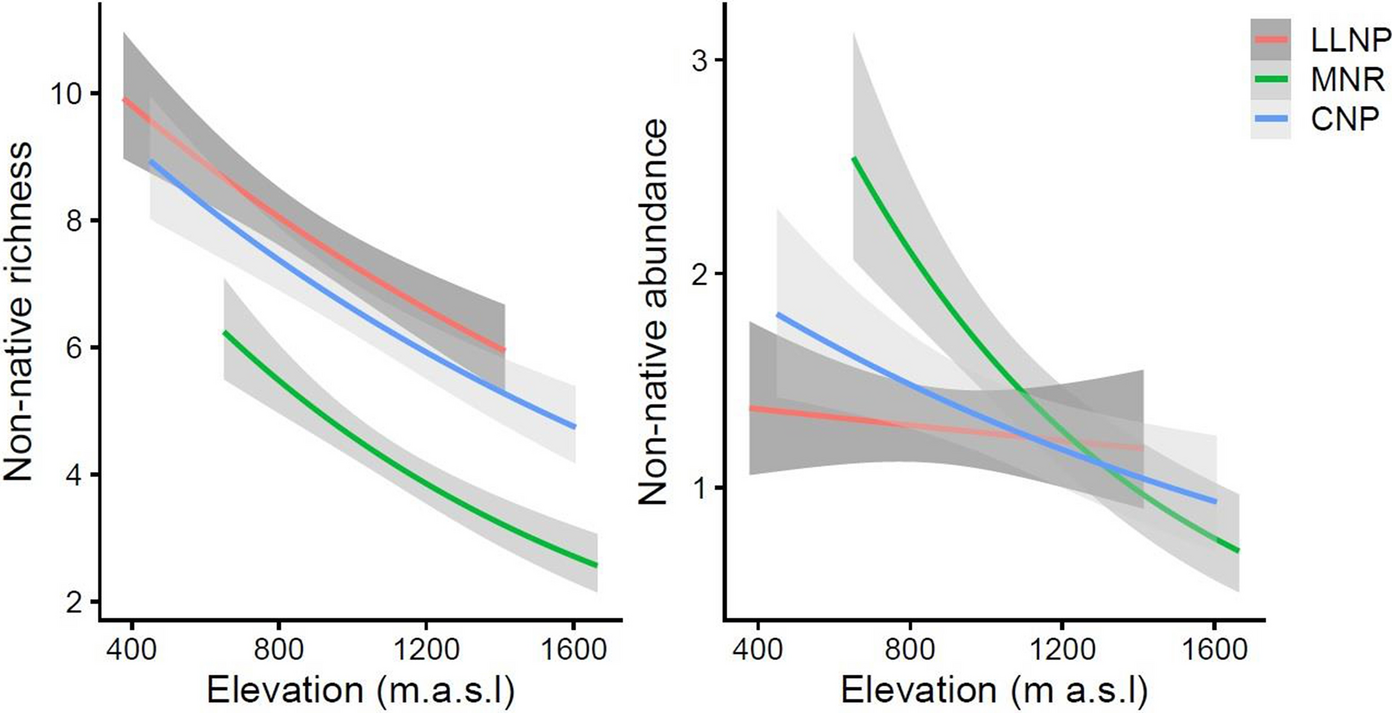
And indeed, as hypothesized based on our experiment from half a decade ago, anthropogenic drivers here again came out on top. While low elevation areas were the most invaded – suggesting perhaps that cold climate at high elevations would be limiting invasion – patterns in non-native species distributions were driven mainly by anthropogenic factors, which explained between 20 and 50% of the variation along the three roads.
Non-native richness and abundance dropped with elevation along the mountain roads. Nevertheless, anthropogenic factors and not the climate were the most important drivers of the distribution patterns.
At the regional scale, the abundance of non-native species was again explained best by anthropogenic factors (24% of the variance), yet non-native richness was driven most strongly by abiotic factors such as soil nitrogen content and pH (15% of the variance).
These results thus elegantly confirm the conclusions from our 2016 experiment that anthropogenic factors largely override abiotic factors as drivers of plant invasions in mountains, both at the local and the regional scale. Importantly, these results also imply that non-native plant invasion in mountains is currently not strongly limited by climate, suggesting that with further increases in disturbance in the Andes, increased plant invasion will most likely quickly follow.
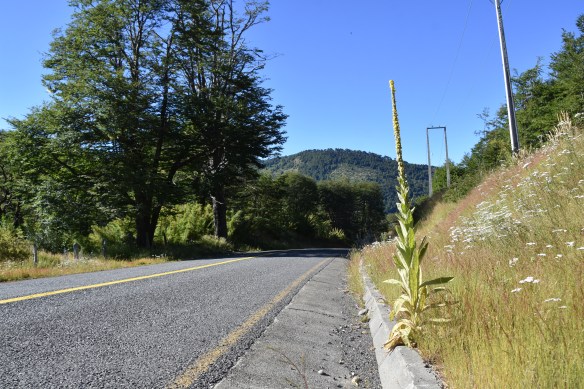
The European herb Verbascum thapsus thriving in a Chilean mountain roadside
These results should thus serve as an important warning: we urgently need better biosafety protocols and control of tourism and agricultural activities in the Chilean Andes, where human influence keeps expanding into natural areas. Only with coordinated efforts like these that keep disturbance at bay, we can limit the risks of further spreading of invasive plant species in the vulnerable Andean landscape.
Lake Törnetrask, Abisko Research Station, Abisko, Sweden
Angelica archangelica along mountain road in the northern Scandes, Norway
Abisko, Sweden
Summer in the Skjomen valley, northern Norway
Narvik, Norway
Norway
Lake Törnetrask, Abisko Research Station, Abisko, Sweden
Lake Torneträsk, Abisko, Sweden
Lake Torneträsk, Abisko, Sweden
Luscinia svecica
Phyllodoce caerulea
Narvik, Norway
Skjomen valley, northern Norway
Laktatjakka valley
Diapensia lapponica in one of our plots
Hallerbos 2017
Young bluebell (Hyacinthoides non-scripta) surrounded by flowers of yellow archangel (Lamium galeobdolon)
The common bluebell (Hyacinthoides non-scripta), the signature flower of the Hallerbos
Single bluebell flower surviving on a wetter spot, as indicated by the field of wild garlic (Allium ursinum)
A really wet patch of forest, with giant horsetail (Equisetum telmateia) in a field of wild garlic (Allium ursinum)
Wild garlic (Allium ursinum) in the Hallerbos flowers a bit later than the bluebells, yet this one was already in full bloom
A bumblebee visiting yellow archangel (Lamium galeobdolon)
A bumblebee visiting yellow archangel (Lamium galeobdolon)
Wild garlic (Allium ursinum)
Wild garlic (Allium ursinum)
Weirdly beautiful, the inflorescence of pendulous sedge (Carex pendula), typical for the wettest spots in the forest
Weirdly beautiful, the inflorescence of pendulous sedge (Carex pendula), typical for the wettest spots in the forest
A little stream in the Hallerbos, surrounded by endless fields of wild garlic (Allium ursinum)
The herb-paris (Paris quadrifolia), less common in the forest
Wild garlic (Allium ursinum)
Bluebells (Hyacinthoides non-scripta)
Weirdly beautiful, the inflorescence of pendulous sedge (Carex pendula), typical for the wettest spots in the forest
Another one from the wet plots: large bitter-cress (Cardamine amara)
Another one from the wet plots: large bitter-cress (Cardamine amara)
Young beech leaves, as soon as they are fully grown, spring in the understory is over
A beech forest without understory, most likely too dry and too acid for any survivors
A young beech seedling (Fagus sylvatica), looking nothing like a beech, yet everything like a tiny dancer
Young beech seedling (Fagus sylvatica)
Bluebells (Hyacinthoides non-scripta)
Bluebells (Hyacinthoides non-scripta)
Bluebells (Hyacinthoides non-scripta)
Mountain melick (Melica nutans), a grass in the most amazing green
Bluebells (Hyacinthoides non-scripta) in a rare patch of mountain melick (Melica nutans), a grass in the most amazing green
Bluebells (Hyacinthoides non-scripta)
Bluebells (Hyacinthoides non-scripta)
Montpellier 2017
The entrance to the cathedral of Montpellier
The cathedral of Montpellier
The entrance to the cathedral of Montpellier
The cathedral of Montpellier
Narcissus poetics
The cathedral of Montpellier
The botanical garden of Montpellier
The botanical garden of Montpellier
The botanical garden of Montpellier
Brackish Camargue vegetation
Brackish Camargue vegetation
Brackish Camargue vegetation
A typical lagune
Brackish Camargue vegetation
Camargue horses
Camargue horses
Camargue horses
Brackish Camargue vegetation
Brackish Camargue vegetation
Brackish Camargue vegetation
Camargue horses
Brackish Camargue vegetation
Little egret in the evening sun
Flamingo’s in the evening sun
A typical lagune
Dandelion fuzz
Grass lily
Grass lily
Dandelion fuzz
Veronica in a sea of poplar fluff
Euphorbia in a sea of poplar fluff
Poplar
Gare du Midi, Brussels
Gare du Midi, Brussels
Gare du Midi, Brussels
Gare du Midi, Brussels
Sweden autumn 2016
Autumn in Abisko
Yellow leaves of mountain birch, with lake Torneträsk in the background.
Lapporten, the gate to Lapland, in Abisko
Rain blowing over the Abisko National Park
The colours of the north: red fireweed and yellow mountain birches, with lake Torneträsk on the background
Yellow leaves of mountain birch, with lake Torneträsk in the background.
Rain on the background, the ski lift in Abisko on the foreground
The steep slope of mount Nuolja on a dramatic looking morning
The beautiful colors of lake Torneträsk in Abisko
A little stream on top of the mountain, with a view on Lapporten, the gate to Lapland
Well, that is a beautiful table with a nice view on lake Torneträsk in Abisko
Our little experiment on top of the mountain in Abisko, with a view on Lapporten
Autumn in Abisko is extremely colorfull
The ski lift with a view on Abisko National Park and Lapporten
Hiking dowhill towards lake Torneträsk
This green is greener than the greenest green: moss on top of mount Nuolja
Well, that is a beautiful table with a nice view on lake Torneträsk in Abisko
The ski lift with a view on Abisko National Park and Lapporten
The ski lift with a view on Abisko National Park and Lapporten
The most beautiful hiking trail of the world: Nuolja in Abisko
Angelica archangelica, often the biggest plant of the Arctic
The most beautiful hiking trail of the world: Nuolja in Abisko
Cirsium helenioides, the melancholy thistle
Hiking down mount Nuolja
The steep slope of mount Nuolja on a dramatic looking morning
The colours of the north: red fireweed and yellow mountain birches, with lake Torneträsk on the background
The prettiest yellow and blue: autumn in Abisko
Fireweed, Epilobium angustifolium
Campanula or bellflower, I think ‘uniflora’
Vaccinium myrtillus
Cornus suecica, the prettiest red of the world
Hieracium alpinum, alpine hawkweed
Carex atrata, one of my favourite sedges
Alpine clubmoss, Diphasiastrum alpinum
Agrostis capillaris, bentgrass
Common yarrow (Achillea millefolium)
Anthoxanthum odoratum, sweet vernal grass, fully grown and mature
Snow scooter trail
Our plot in the mids of a field of horsetails (Equisetum pratense)
Equisetum pratense
Cliff overlooking the valley with the road to Norway
Seedling of Taraxacum officinale, the dandelion, after two years of growing in bad conditions
Poa alpina, the alpine meadow-grass, with its viviparous seeds
Massive flowerhead of Angelica archangelica
Angelica archangelica
Blueberry (Vaccinium myrtillus) in autumn
A lowland marsh in Abisko in autumn
Installing the plots of our trail observations on top of mount Nuolja
Installing the plots of our trail observations on top of mount Nuolja
Tanacetum vulgare (Tansy), non-native for the high north
Autumn forest down in the valley
The valley of Nuolja to Björkliden
Summer on the Nuolja-side
A full rainbow behind mount Nuolja in Abisko
It’s raining in the west, clouds trapped behind the mountains
A strong wind blowing rain from behind the mountains to our side
A strong wind blowing rain from behind the mountains to our side
Betula nana, the dwarf birch, mini autumn forest
Betula nana, the dwarf birch, mini autumn forest
The valley of Björkliden in autumn
The valley of Björkliden in autumn
The valley of Björkliden in autumn
The valley of Björkliden in autumn
Sweden spring 2016
Bartsia alpina
A rainy hike
Silene acaulis
Eriophorum vaginatum
Salix reticulata
Cornus suecica
Rubus arcticus
Oxyria digyna
Silene suecica
Overlooking the valley of Laktajakka
Ranunculus glacialis
Dryas octopetala
The valley of the lakes
Although the alpine zone has been harder for invasives to access than most places, human structures like trails are often an easy gateway for the invaders to get up there. Picture from Abisko, Swedish Lapland.
Western European species like the red clover (Trifolium pratense) here are often listed as non-native species in mountain regions.
Trifolium pratense
Ranunculus glacialis
Melting snowpatch on a lake
Trifolium repens
Amiens
Cold!
Cathedral at night
Cathedral seen from the frozen Parc Saint-Pierre
View from my office window
House on the square before the cathedral
Sunny but cold, the Quai Bélu
Maria without a shirt
Winter sun on the Place du Don
Just outside of Amiens
Cathedral with a glimpse of spring
Frozen mirror
Cathedral at night
Cathedral at night
Almost cold enough for ice-skating
View from my office window
Cathedral at night
Gargoyle planning to eat the cathedral
Amiens is filled with cute little houses
Enjoying silence and the morning sun
Colourful mirror
The museum behind the beautiful gates
Frozen to the bone
Sunny but cold, the Quai Bélu
Nice architectural curve
Sun rising above the water
Le Club d’Aviron in winter weather
The southern side
Sweden autumn 2015
Lichen
Sweden summer 2015
View on the 1000 meter plots
Doing research on a cold Arctic morning
Plots flooded by the snowmelt
Flooded by the snowmelt
Meltwater river, racing down the mountain
After a hike, even the most basic house looks cosy. Little hut in the mountains, open for everybody
Snowbridge, maybe don’t cross…
Snowbridge
View from a cliff
Silene acaulis or cushion pink, cutest plant of the Arctic
Two seasons in one image
Steep slope
Hiking down
Narvik Kirche, church of the subarctic
Narvik Kirche
Reindeer on top of the mountain
Narvik Kirche
Summer at the church
Summer flowers
Massive waterfall
Young willow catkins
View from Narvik’s hospital, with lilac flowers
Building a bridge over the fjord will gain al drivers at least an hour
Norwegian fjord
Posing with the water, getting soaked
Minimalistic mountains
Insect investigating our reindeer antler
Catching mosquitoes with our license plate, harvest of the year!
Posing with the plot
Fieldwork on the most beautiful spot of the world
Fieldwork on the most beautiful spot of the world
Summer bridge – still next to the sadly impassable river
Rhinanthus flower in the mountains
Plateau in the valley, beautiful brown
Experimental view from my favourite plot
Salix catkins
Extremely old Betula tree
Waterfall from a cliff
Buttercup is the earliest in spring, here
Rocks!
Alpine views
Views!
Fieldwork
Jumping over rivers
Plot
Golden plover
Angry lemming
Green, the whole north is green!
Snow, so much snow left!
Minimalistic mountain moments
Fieldwork
The research center
Red clover – focal invader
Look at this tiny cute snail!
Massive floods of melting water
Bartsia alpina
Hooray, a toilet!
Dryas octopetala
Lowest elevation plots
Butterball!
That’s a lot of water
Midnight sun is the best
At the lakeside
Beautiful Bistorta vivipara
Don’t fall in the water
Midnight sun
Wild river
Art – made by ages of wild rivers
Baby firework for America’s independence day
Midnight sun at the lake
The Abisko canyon was wilder than ever
That’s a crazy amount of water!
The Abisko canyon was wilder than ever
The Abisko canyon was wilder than ever
Black and white
Stone-man overlooking Abisko
Nothing as soft as a willow catkin
Label and soil temperature sensor attached
I’d drive to the top every day
Reflections
Rocks and clouds
Brave little birch
Brewing our camping poison
Basic camping stuff
Camping in Norway
Home-made temperature houses
Roadside research at its best
Norway is crazy
Horsetail is so funny
Little creek in magical forest
Birches, birches everywhere
Beautiful rock, a gift from the river
Another roadside fellow
Lichen
Ready to rock the summer
Collecting mosses
That’s a crazy old lichen
Tiny tiny piny trees, but old, so old!
Ready to jump into the fjord?
Ready to jump into the fjord?
That’s a spiky stone!
Views on Norwegian fjords
Silene in the mountains
Cute little orchid
Skua
Attacking skua, mind your heads!
Watch out for the attack of the fierce skua!
Black snail
New plot!
Still a lot of snow to melt, but this spot was free for a new plot
Reindeer are better than people
Two seasons in one picture
Let’s see what is happening to the balance in mountains! Is this a starting avalanche, or will it last a bit longer?
Cute little hut
Climbing mountains by car
Softest moss in history
Drosera in the marsh
Hiking in no-man’s land
The clouds are coming
Abisko valley
‘Butterball’
Fieldwork in the tundra
Abisko valley
Little plot
Clouds and sun and mountains
Making soup on a campfire with a view
Little creek on high elevations
Skua on the look-out
Melting snow in a river
Rhodiola rosea and the Törnetrask lake
Beginning of spring
Flooded plots, melting snow, impassible wetness
Ferns and horsetails
Chile 2015
Trips to the field sites were sometimes a real adventure, especially right after snowmelt
Lunch made by our local colleague, with funny bread (tasty as well!)


")


")
")


")


")


")


")


")


