
When we designed our large-scale citizen science project ‘CurieuzeNeuzen in de Tuin’, we soon realized we had a problem on our hands: if we wanted to get an accurate idea of soil temperature and especially soil moisture from our 5000 measurement locations, we needed to have data on local soil conditions, and at least the soil texture.
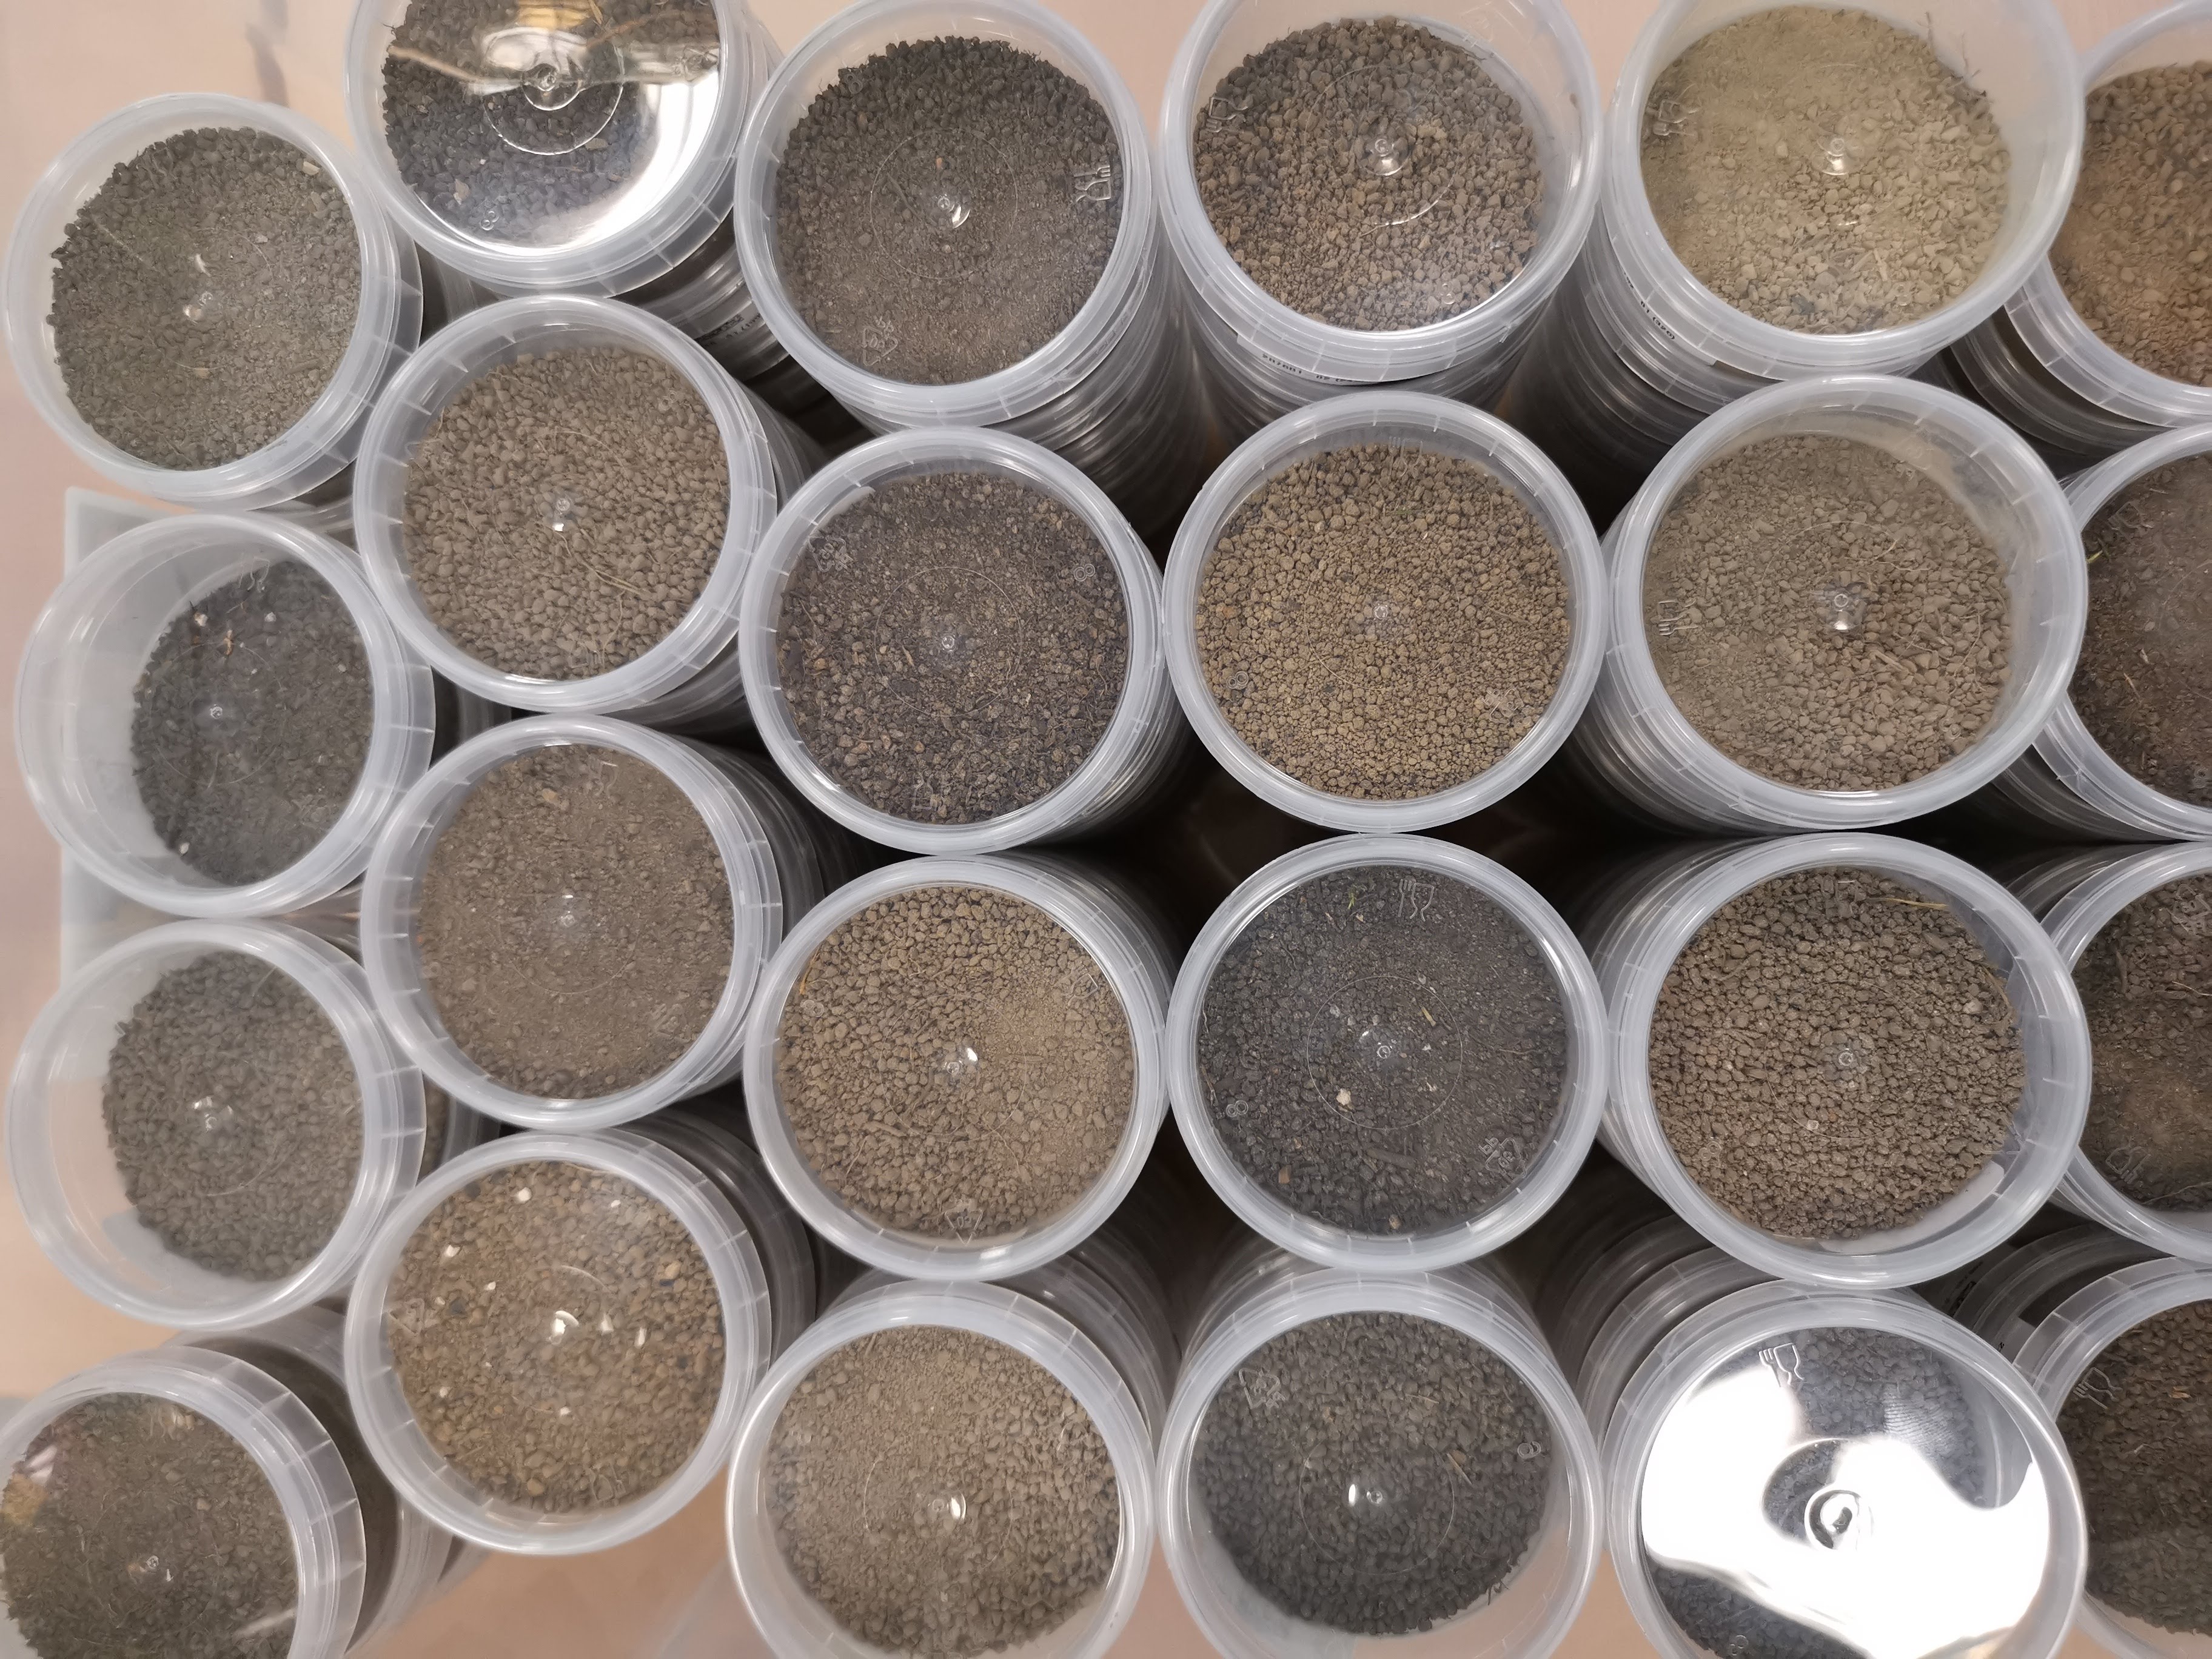
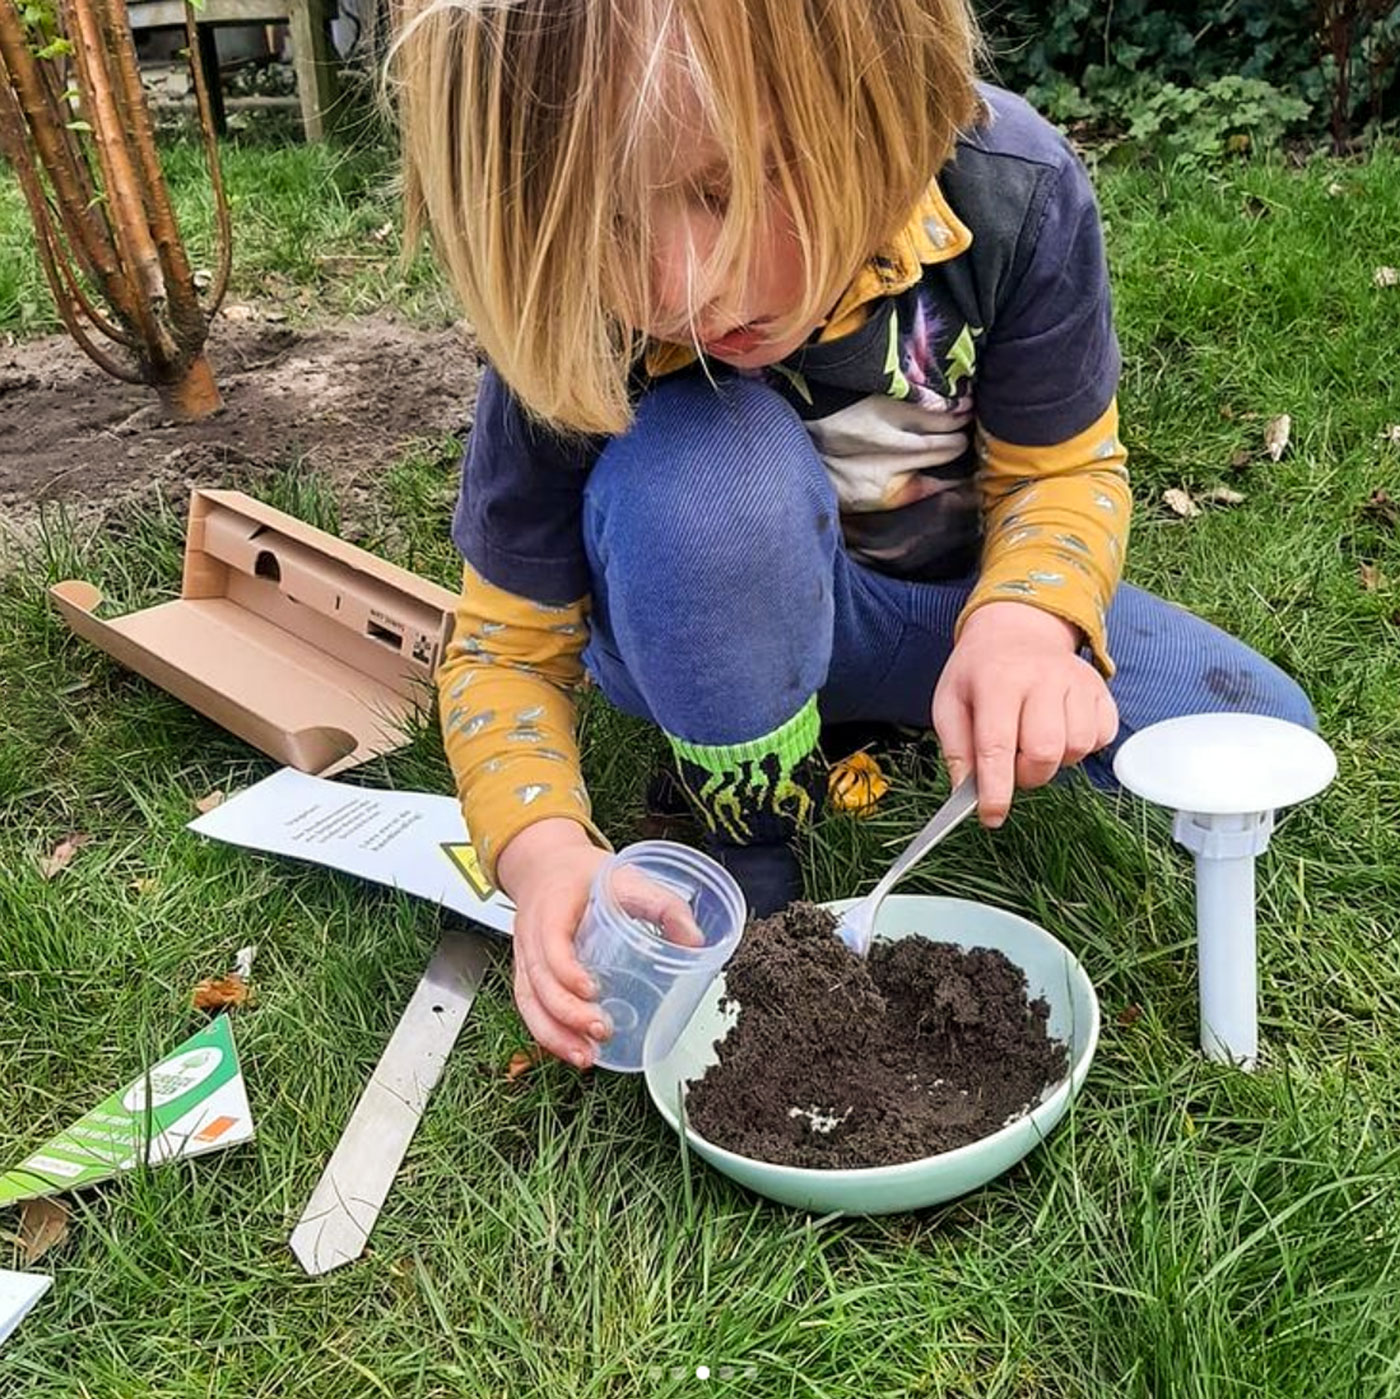
That was not entirely impossible, we thought, as we had a laser diffraction device in the lab to assess soil fractions that could be used. We just had to ask all citizens to take a soil sample and send it to us. The problem came to the surface when we calculated our time investments: most laser diffraction analyses – at least those we knew of – could handle four samples per hour. And that was at their best behaviour only, excluding errors, cleaning of lenses, replacing of components etc.

Now, four samples an hour for 5000 samples gives a total of 1250 hours of soil texture analyses, which is 156 days of relentless work, or 8 months of continuous labwork for a lab technician; if not beaten to death halfway through by the extreme dullness of the task at hand.

It was obvious that we needed a better solution. That solution was found with our colleagues at the Earth and Life Institute of UCLouvain. They had a different way of measuring soil texture, using visible near-infrared spectroscopy. This technique was much faster – in a blink of an eye a soil sample could be scanned.

Spectroscopy works fast, but the results need to be calibrated. For a subset of the data – say 10% – the traditional laser diffraction method still needs to be used, which can then provide you with a calibration curve to identify the fractions of clay, silt, and sand in your sample.
In a new paper together with the team at UCLouvain, we now provide a better calibration formula for this spectroscopical analysis, which takes into account one mathematical issue with texture data: the sum of clay, silt and sand is always 100%, so you need to model them together to avoid impossible soils with more (or less) than 100% of volume.
That issue has now been solved and published in the journal ‘Soil and tillage research’. Thanks to this fabulous method, our citizen participants also had to wait only four months to get information on their garden soil texture on their dashboard, a most remarkable achievement they are probably not even aware of.


")


")
")


")


")


")


")


")


