
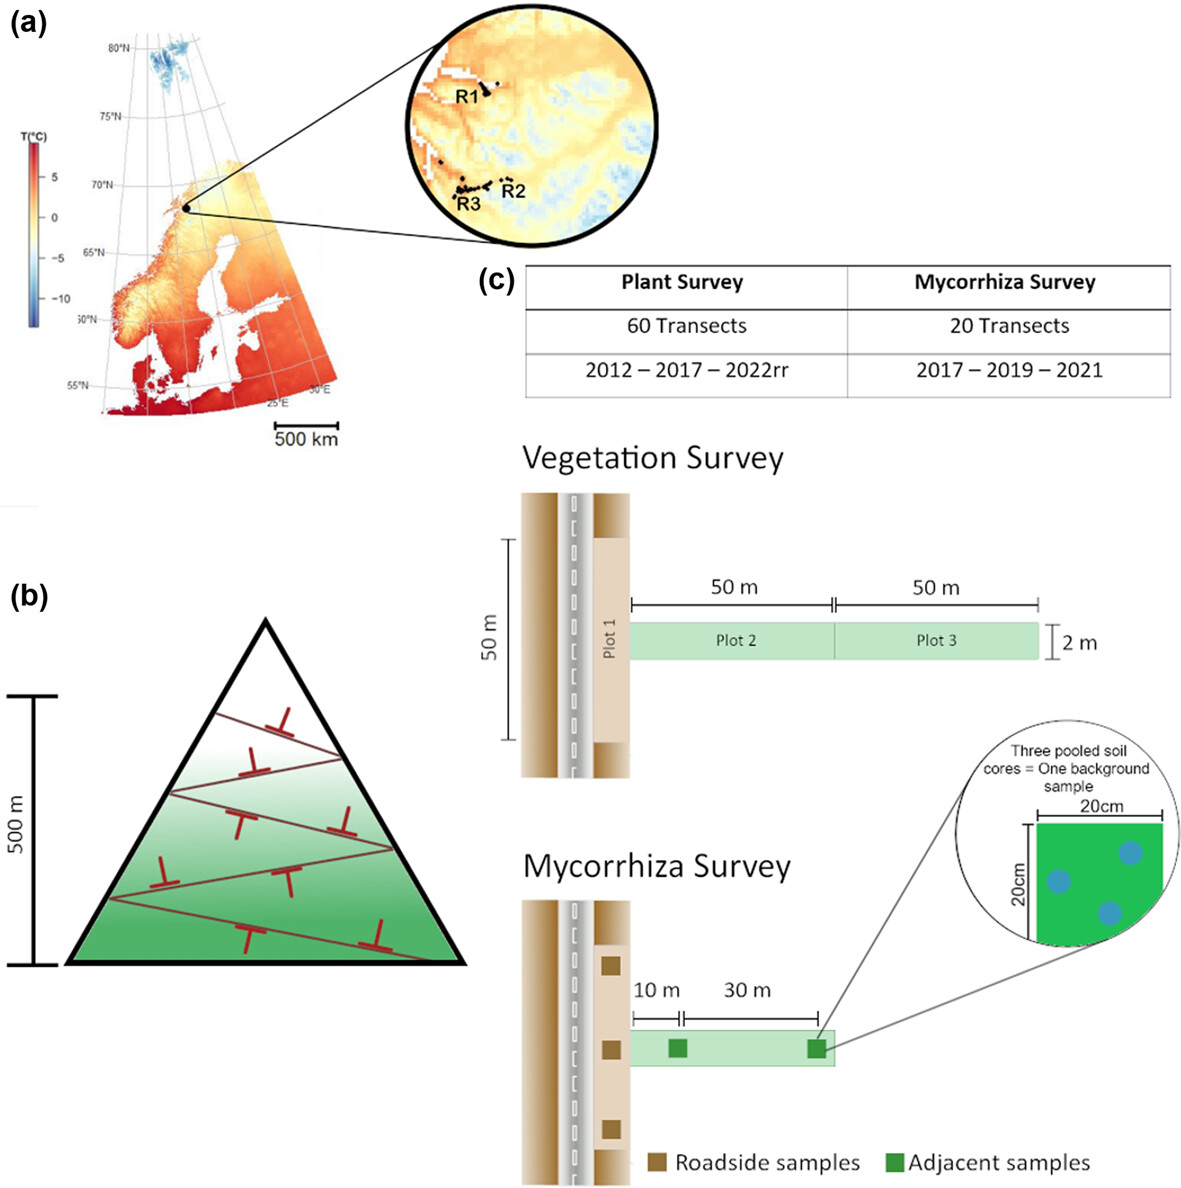
In 2012, during my master’s thesis, we began monitoring vegetation along three Norwegian mountain roads with a clear goal: to track how these plant communities would change over time. Time, of course, is a relative concept, and nature operates on a much slower clock than we do. Now, over a decade later—after one PhD, two postdocs, and six months as an assistant professor—we’ve finally published the first temporal analysis of those roads, covering the initial decade of monitoring (Clavel et al. 2024 in Oikos, here).

Naturally, we were curious to see whether a decade would be enough to reveal significant changes, particularly in the spread of non-native species. After all, much of my PhD work revolved around the hypothesis that plant invasions in these Norwegian mountains were relatively recent, spurred by a warming climate and possibly increased human activity in the region. My experiments had shown that some key non-native species in the area, like Achillea millefolium and Trifolium repens (and pratense), could thrive hundreds of meters above their current elevational limits—provided they found nutrient-rich disturbed plots (Lembrechts et al. 2016). Furthermore, a global study from the Mountain Invasion Research Network (MIREN), which includes our region, indicated that a decade was often enough to detect increases in non-native species richness and elevational limits along mountain roads (Iseli et al. 2023).
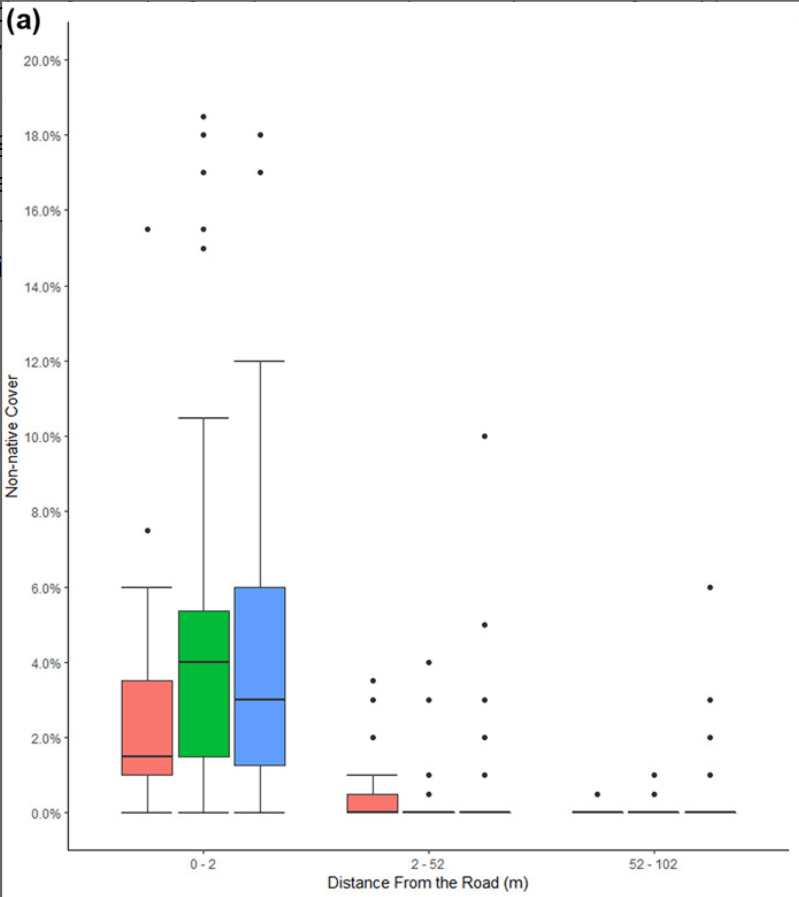
So, what’s happening with these non-native species in northern Norway? First, the headline result: we found no evidence of an upward shift in their elevational limits or increased invasion into adjacent, undisturbed vegetation. This stability aligns with another study we published earlier (Wiegmans et al. 2024), which showed that non-native species in northern Sweden have been present since the early 20th century, coinciding with railroad construction, and that their presence has actually declined slightly over the last century. This raises an intriguing possibility: perhaps these species have already reached their elevational limits, finding equilibrium with the current climate. If that’s true, their upward expansion may proceed only slowly, in step with climate warming, rather than leaping ahead as non-native species do in the early phases of their introduction.
However, we did observe two clear signs of change: non-native species increased significantly in cover, and their richness rose from 17 to 23 species—a 35% increase! This could indicate that notable shifts are happening despite the lack of upward movement. But caution is warranted. These roads undergo periodic cycles of intensive roadside management, including the addition of fresh gravel, which resets succession along the roadsides. With only three time points over a decade, it’s too early to say whether these observed changes are part of a longer-term trend or simply a result of disturbance cycles. For now, the evidence suggests the area isn’t facing imminent danger from invasive species running rampant. Yet, if these species are currently at their climatic comfort zone, accelerating climate warming—as we fully expect—could quickly change the situation.
In earlier work, we also investigated whether the upward expansion of non-native species might be limited by a lack of suitable mycorrhizal fungi. We hypothesized that these species might be missing their underground partners, crucial for survival at higher elevations. Surprisingly, that wasn’t the case (Clavel et al. 2020). All the non-native species associate with arbuscular mycorrhizal fungi (AMF), which are present along the entire elevational gradient and flexible enough to pair with these plants. The native vegetation, however, is dominated by ericoid and ectomycorrhizal fungi, which seem to create a substantial barrier to non-native expansion away from the roadsides.

To delve deeper into this relationship, we conducted three surveys over five years to assess mycorrhizal diversity in plant roots along the roads. We wanted to tackle the chicken-and-egg question: do AMF facilitate non-native species expansion, or does non-native expansion drive AMF proliferation? Interestingly, we found an increase in AM fungal abundance at lower elevations along the roadsides over the past few years, which may correlate with the rise in non-native species cover. However, when we tested these relationships at the plot level, our results suggested that changes in non-native species cover didn’t drive AM fungal abundance. Instead, the shifts might rather be linked to changes in the native roadside community, which is itself more AMF-dominated than the surrounding natural vegetation.
And so, here we are, over a decade after my first tentative steps along these Norwegian mountain roads, with some initial conclusions: no rapid upward shifts in non-native species so far, but a clear expansion in their cover and richness. Whether this is due to rapid niche filling or simply interannual variations in disturbance is something we’ll need another decade of monitoring to unravel. For now, it seems unlikely that AM fungi are playing a leading role in this story.
Reference:
Clavel et al. (2025) Temporal effects of road disturbance on the spread of non-native plants and arbuscular mycorrhizal fungi in subarctic mountain ecosystems. Oikos https://doi.org/10.1111/oik.11075


")


")
")


")


")


")


")


")


