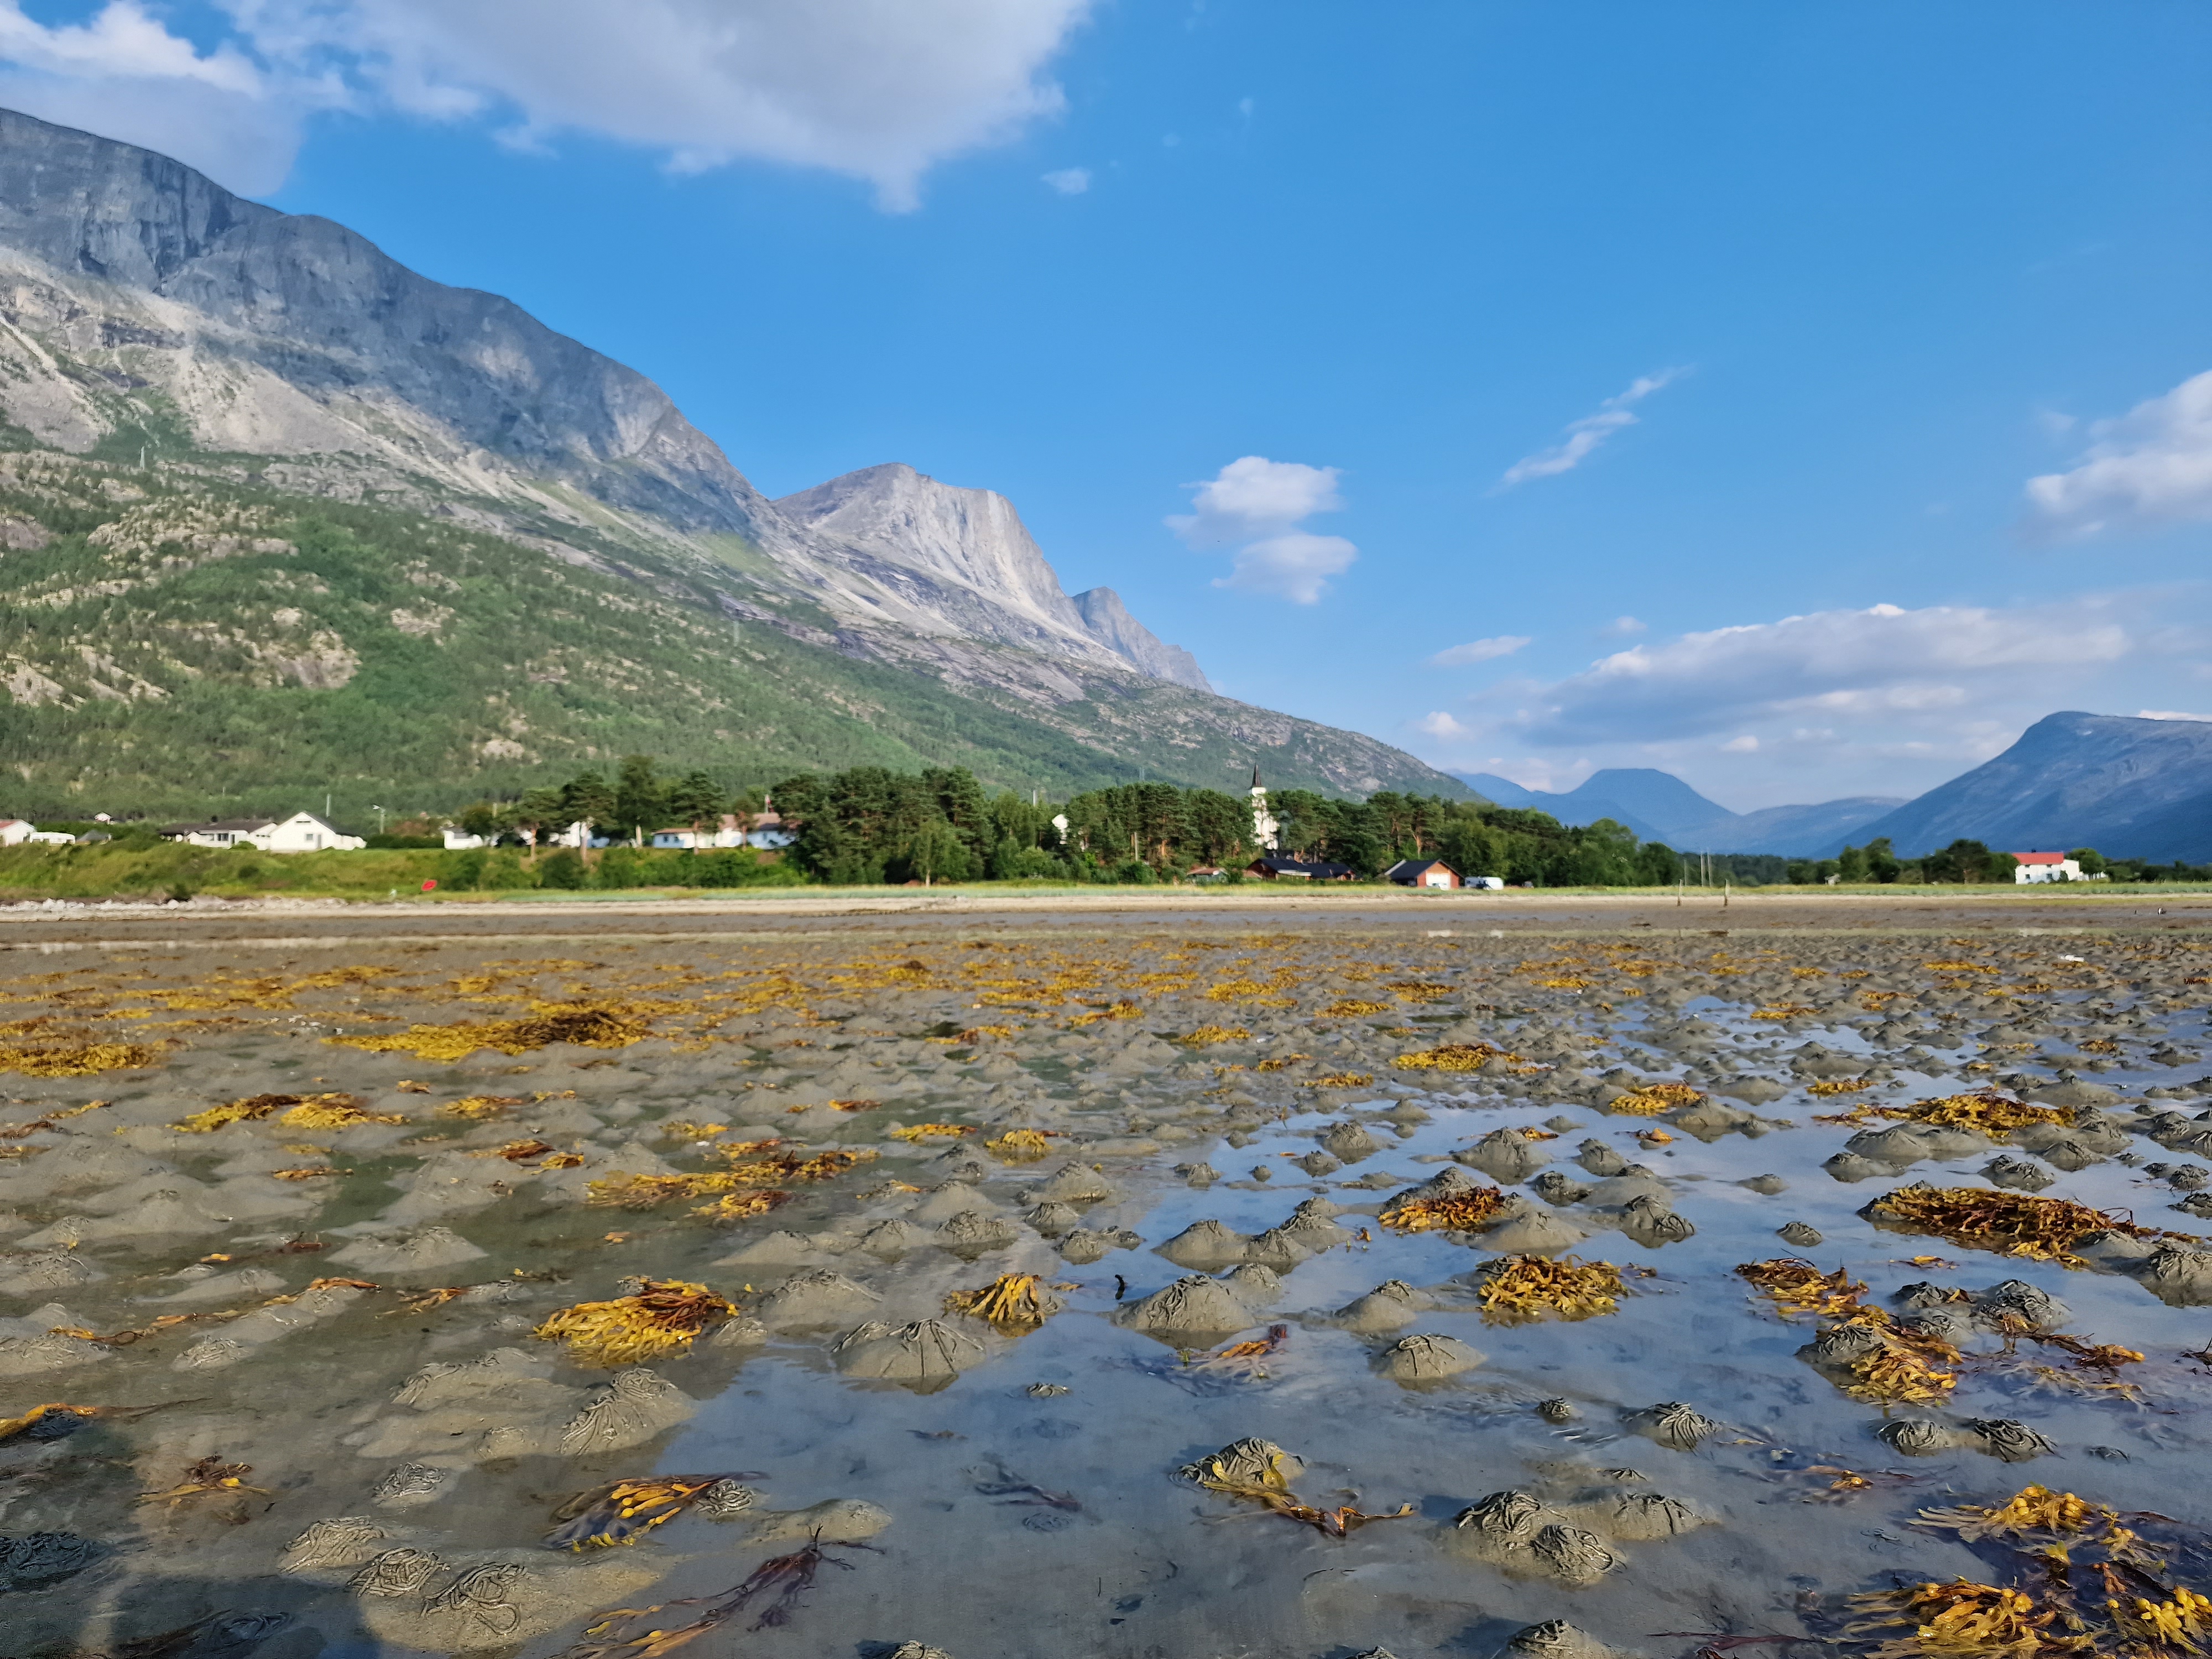
I will never get used to the absolute beauty of this place.
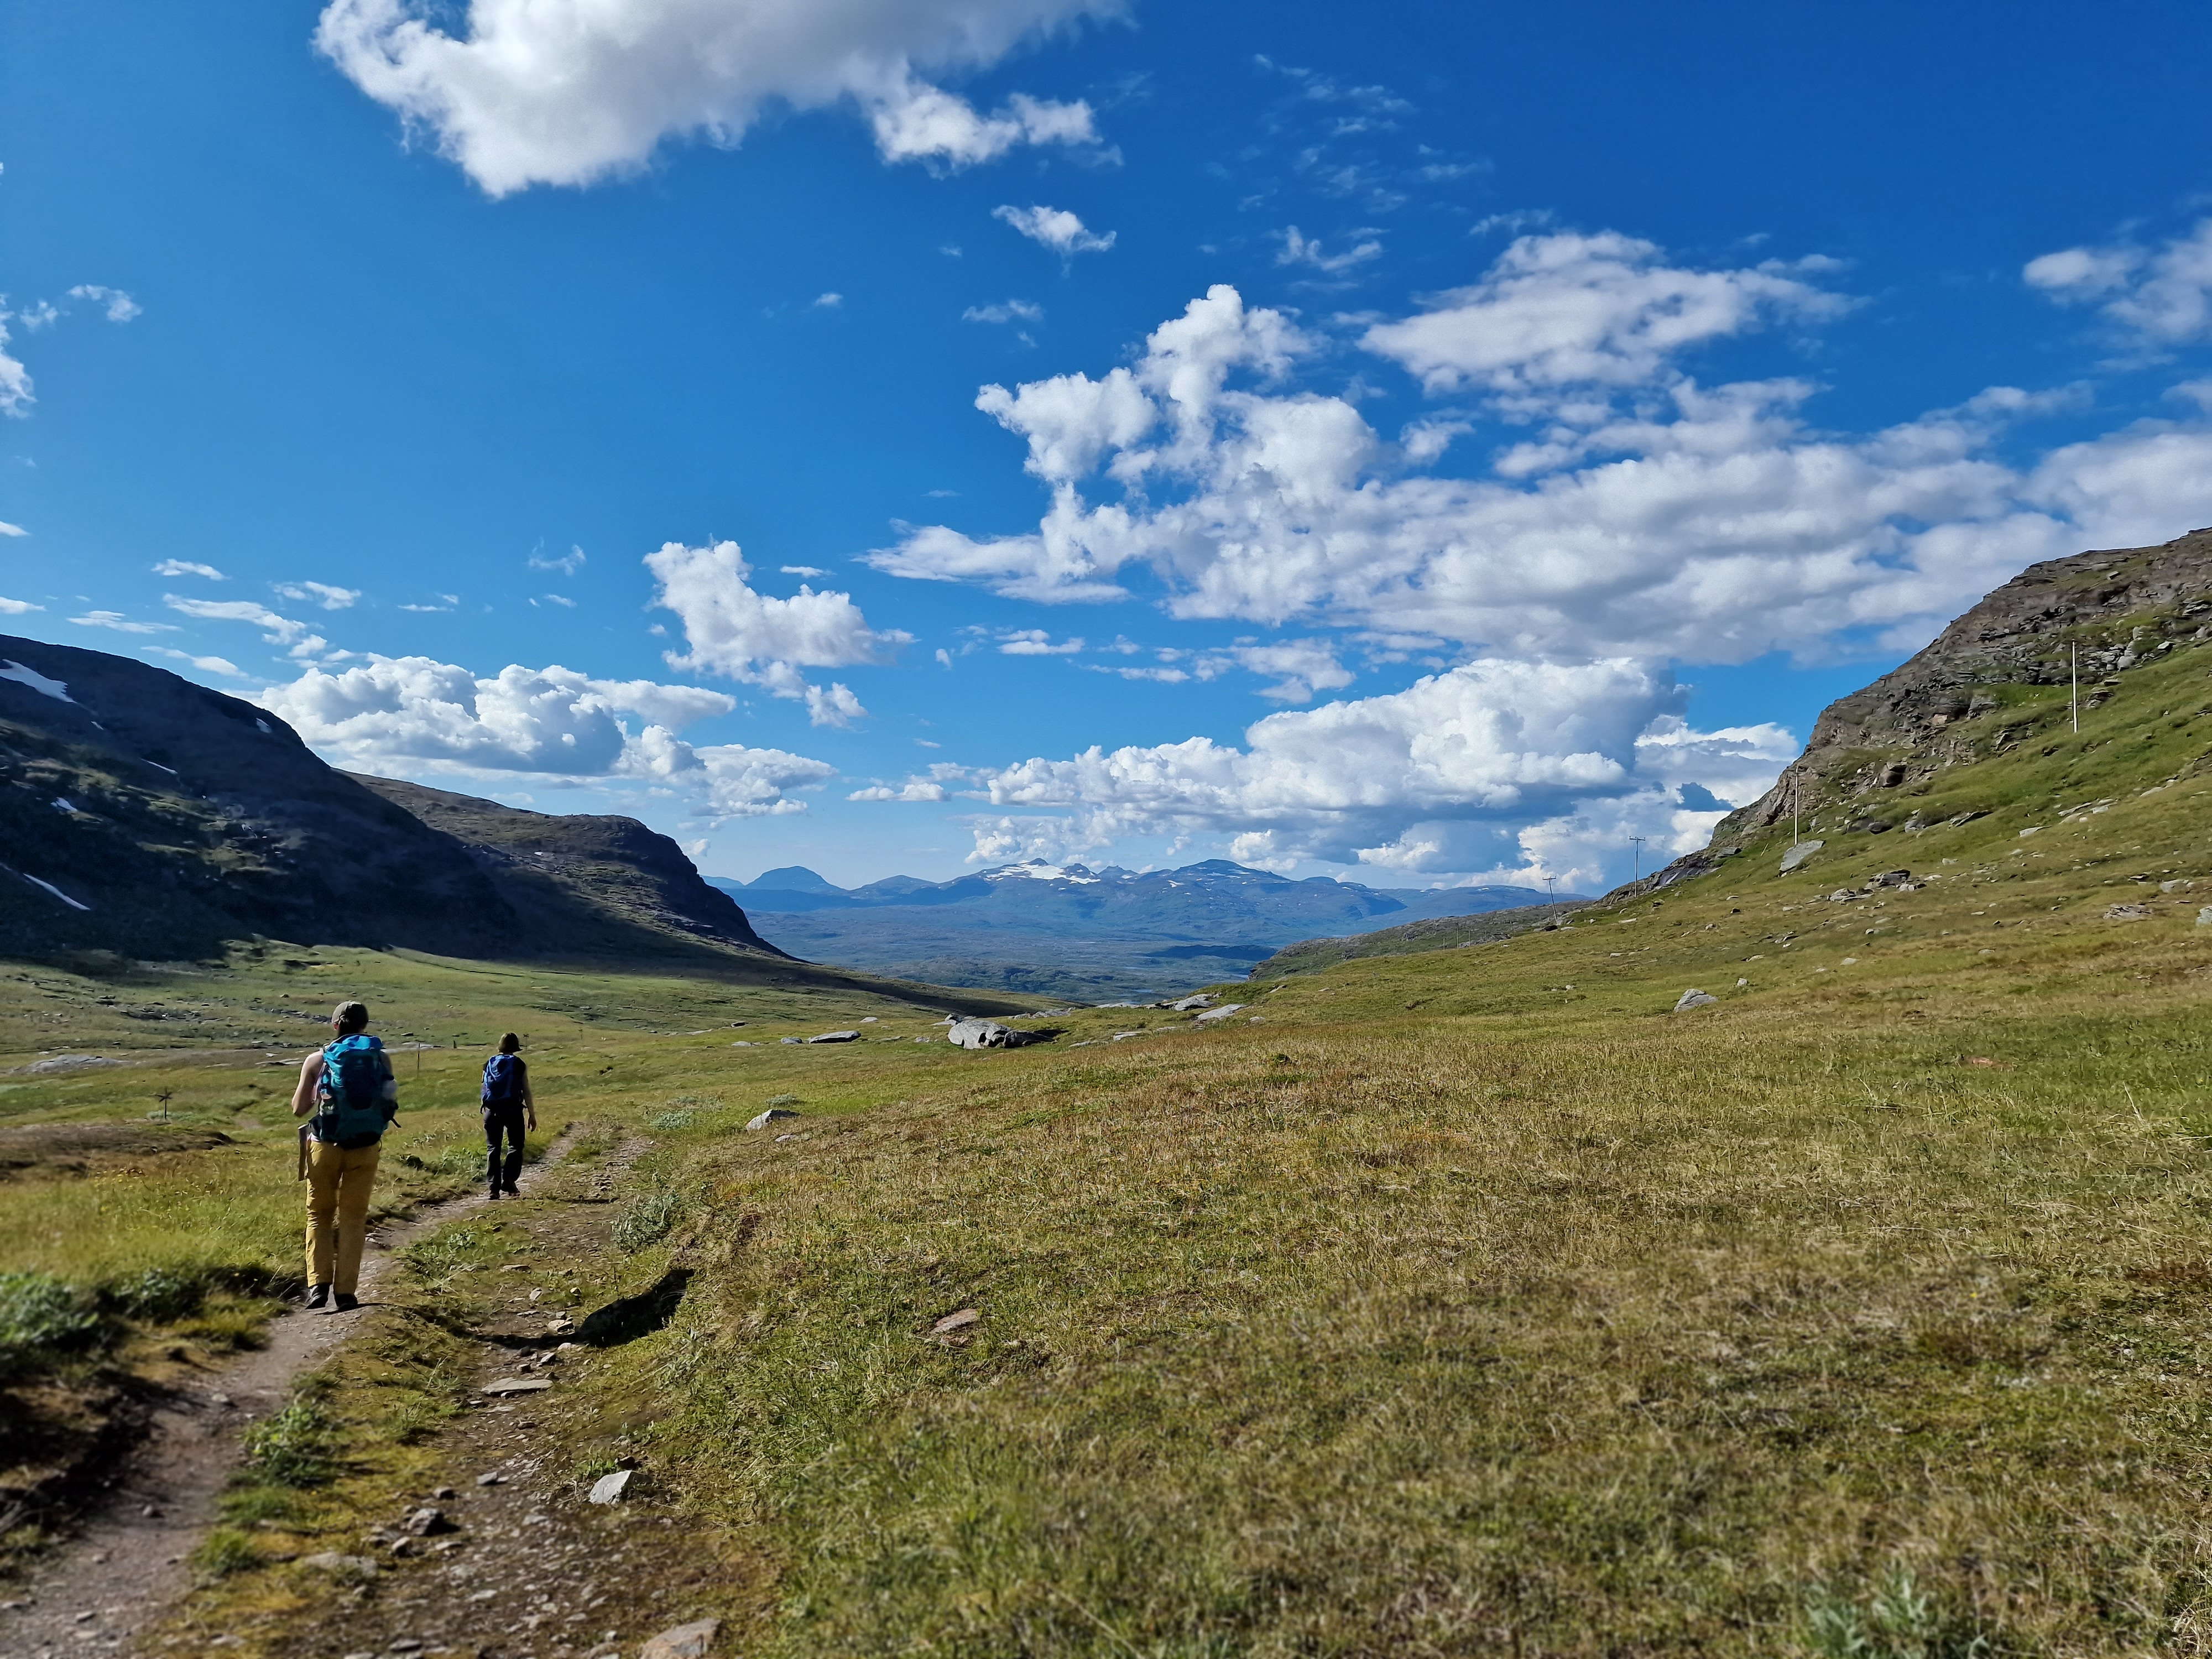
Where are we? The ‘Skjomdal’, a long valley cutting through Norway, just south of Narvik. A stream, a river and a fjord, all surrounded by stunning mountains.
It is here that it all started for me. This valley is home to two of our Norwegian MIREN roads, which we started monitoring back in 2012. It also hosted some of the first microclimate sensors back in 2016, for a project that later grew into SoilTemp.
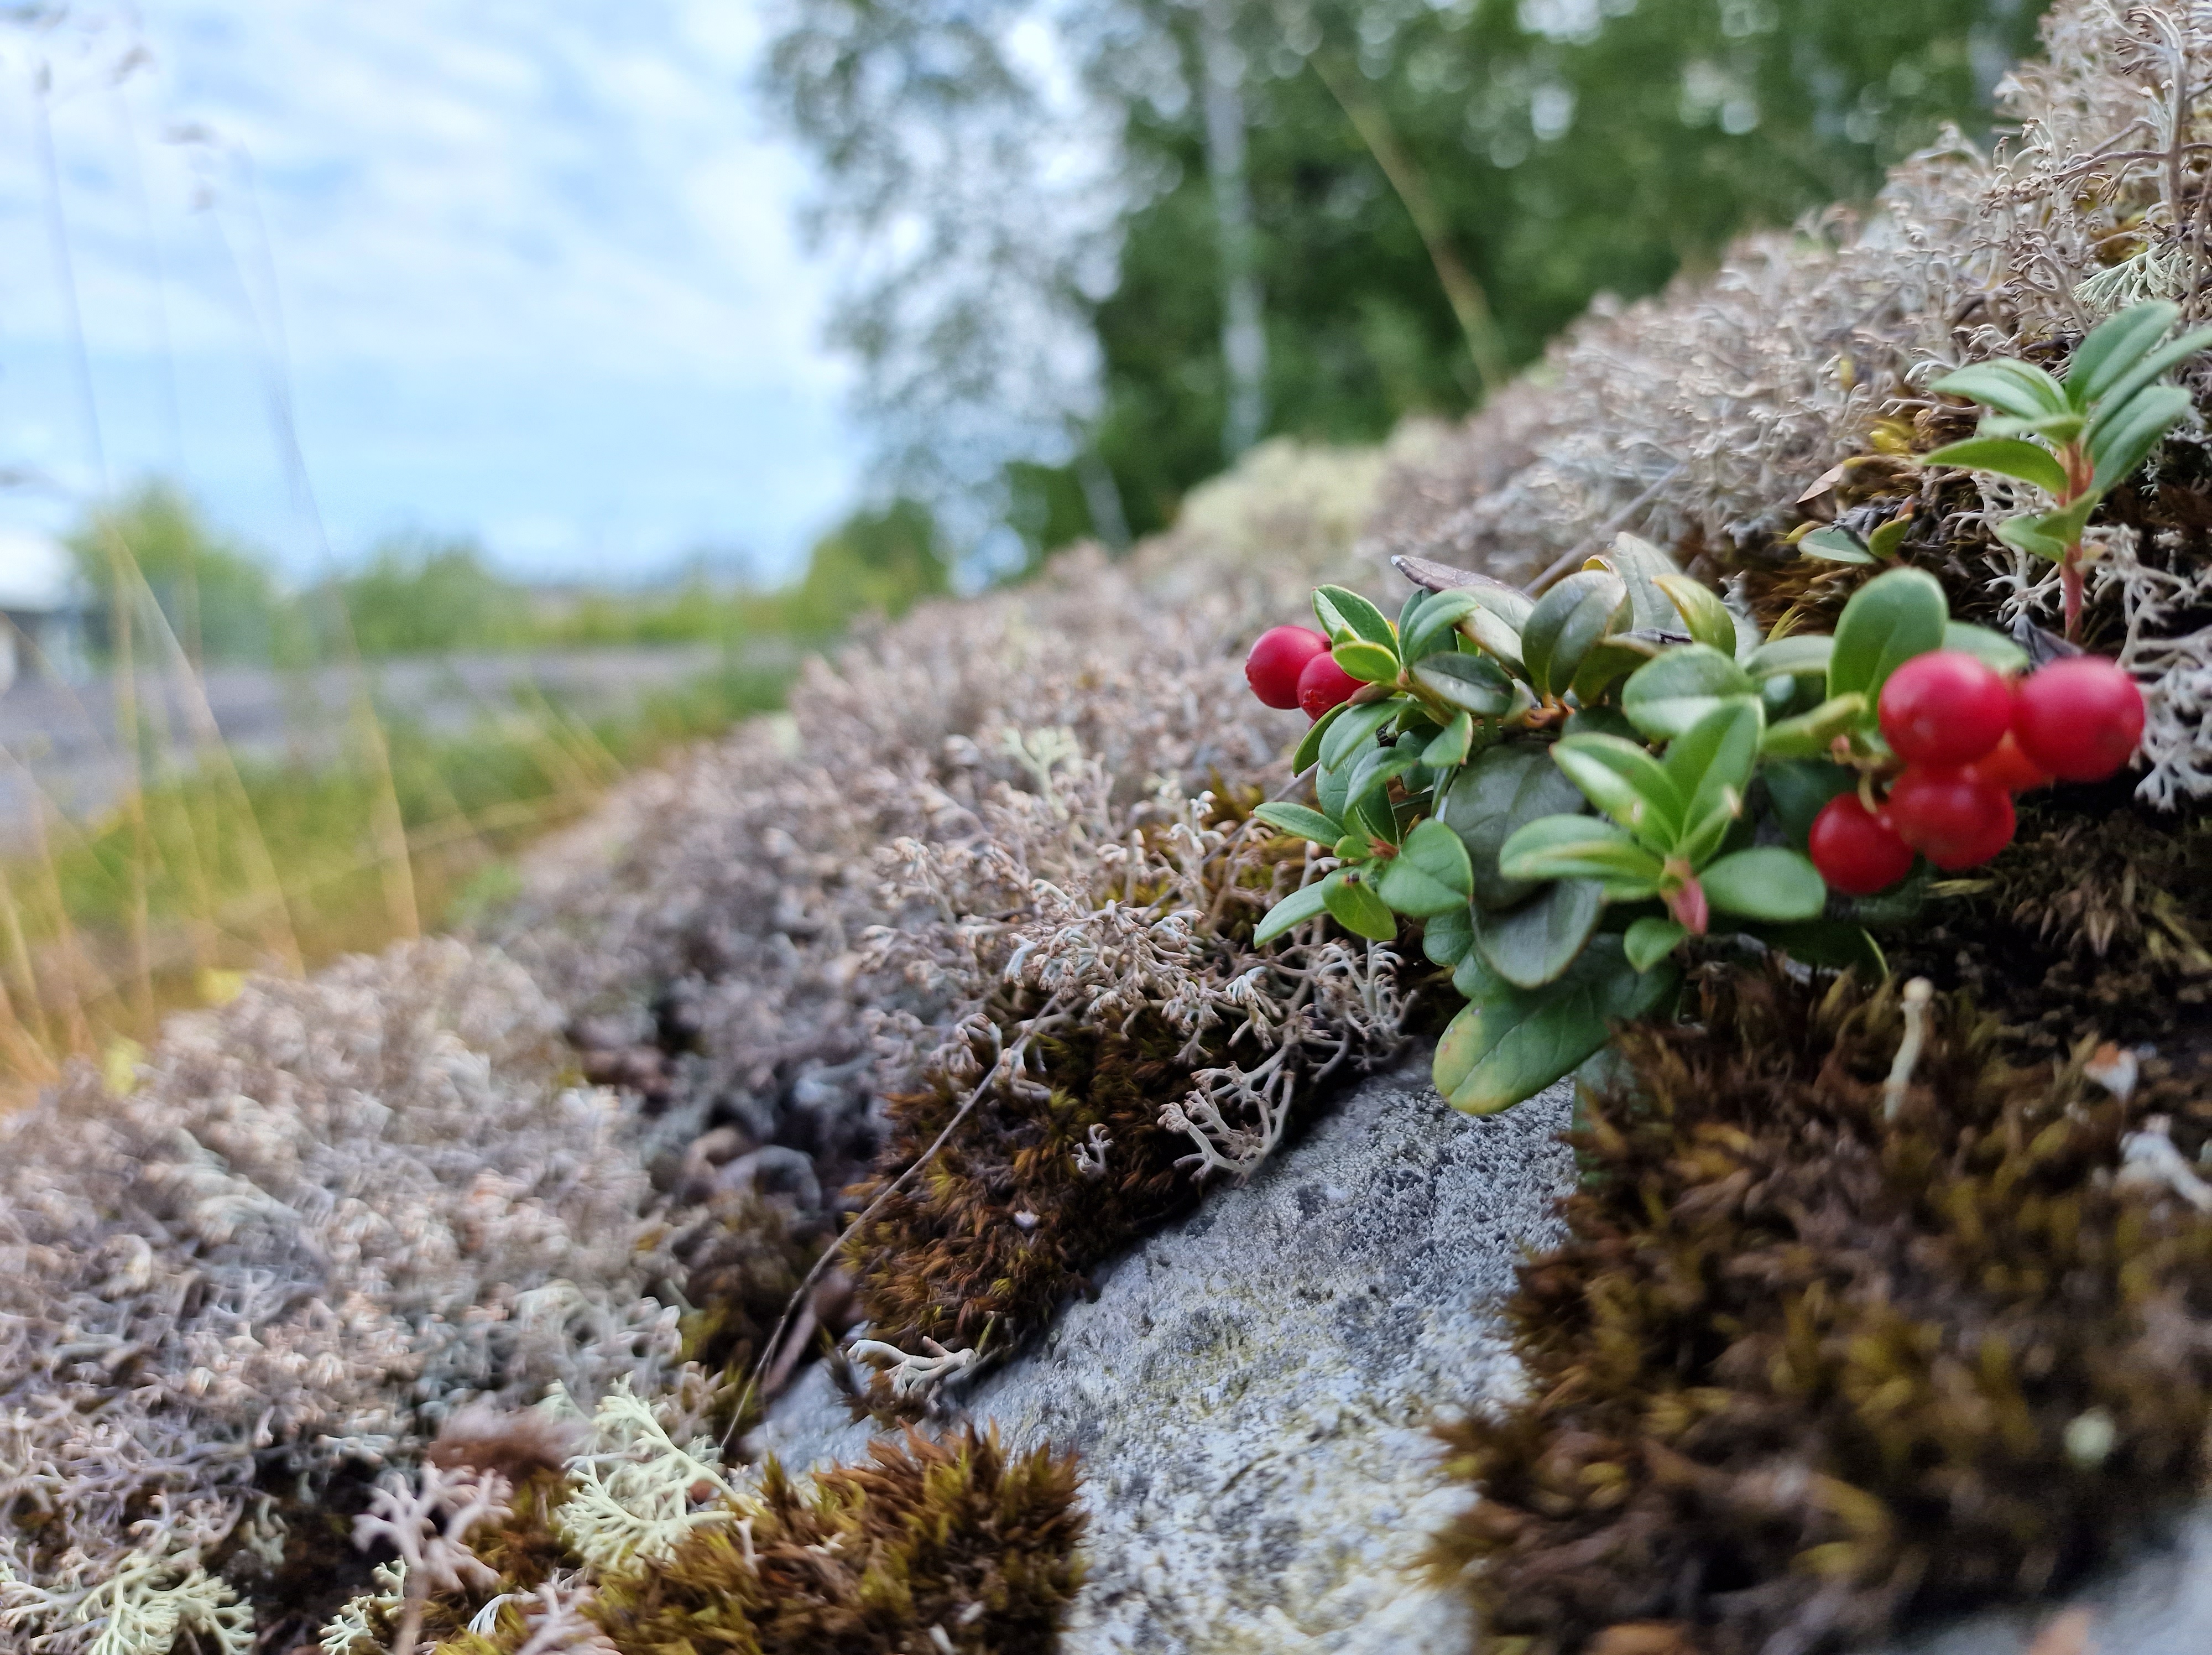
Autumn vibes in our MIREN plots, thanks to the very red berries of Cornus suecica
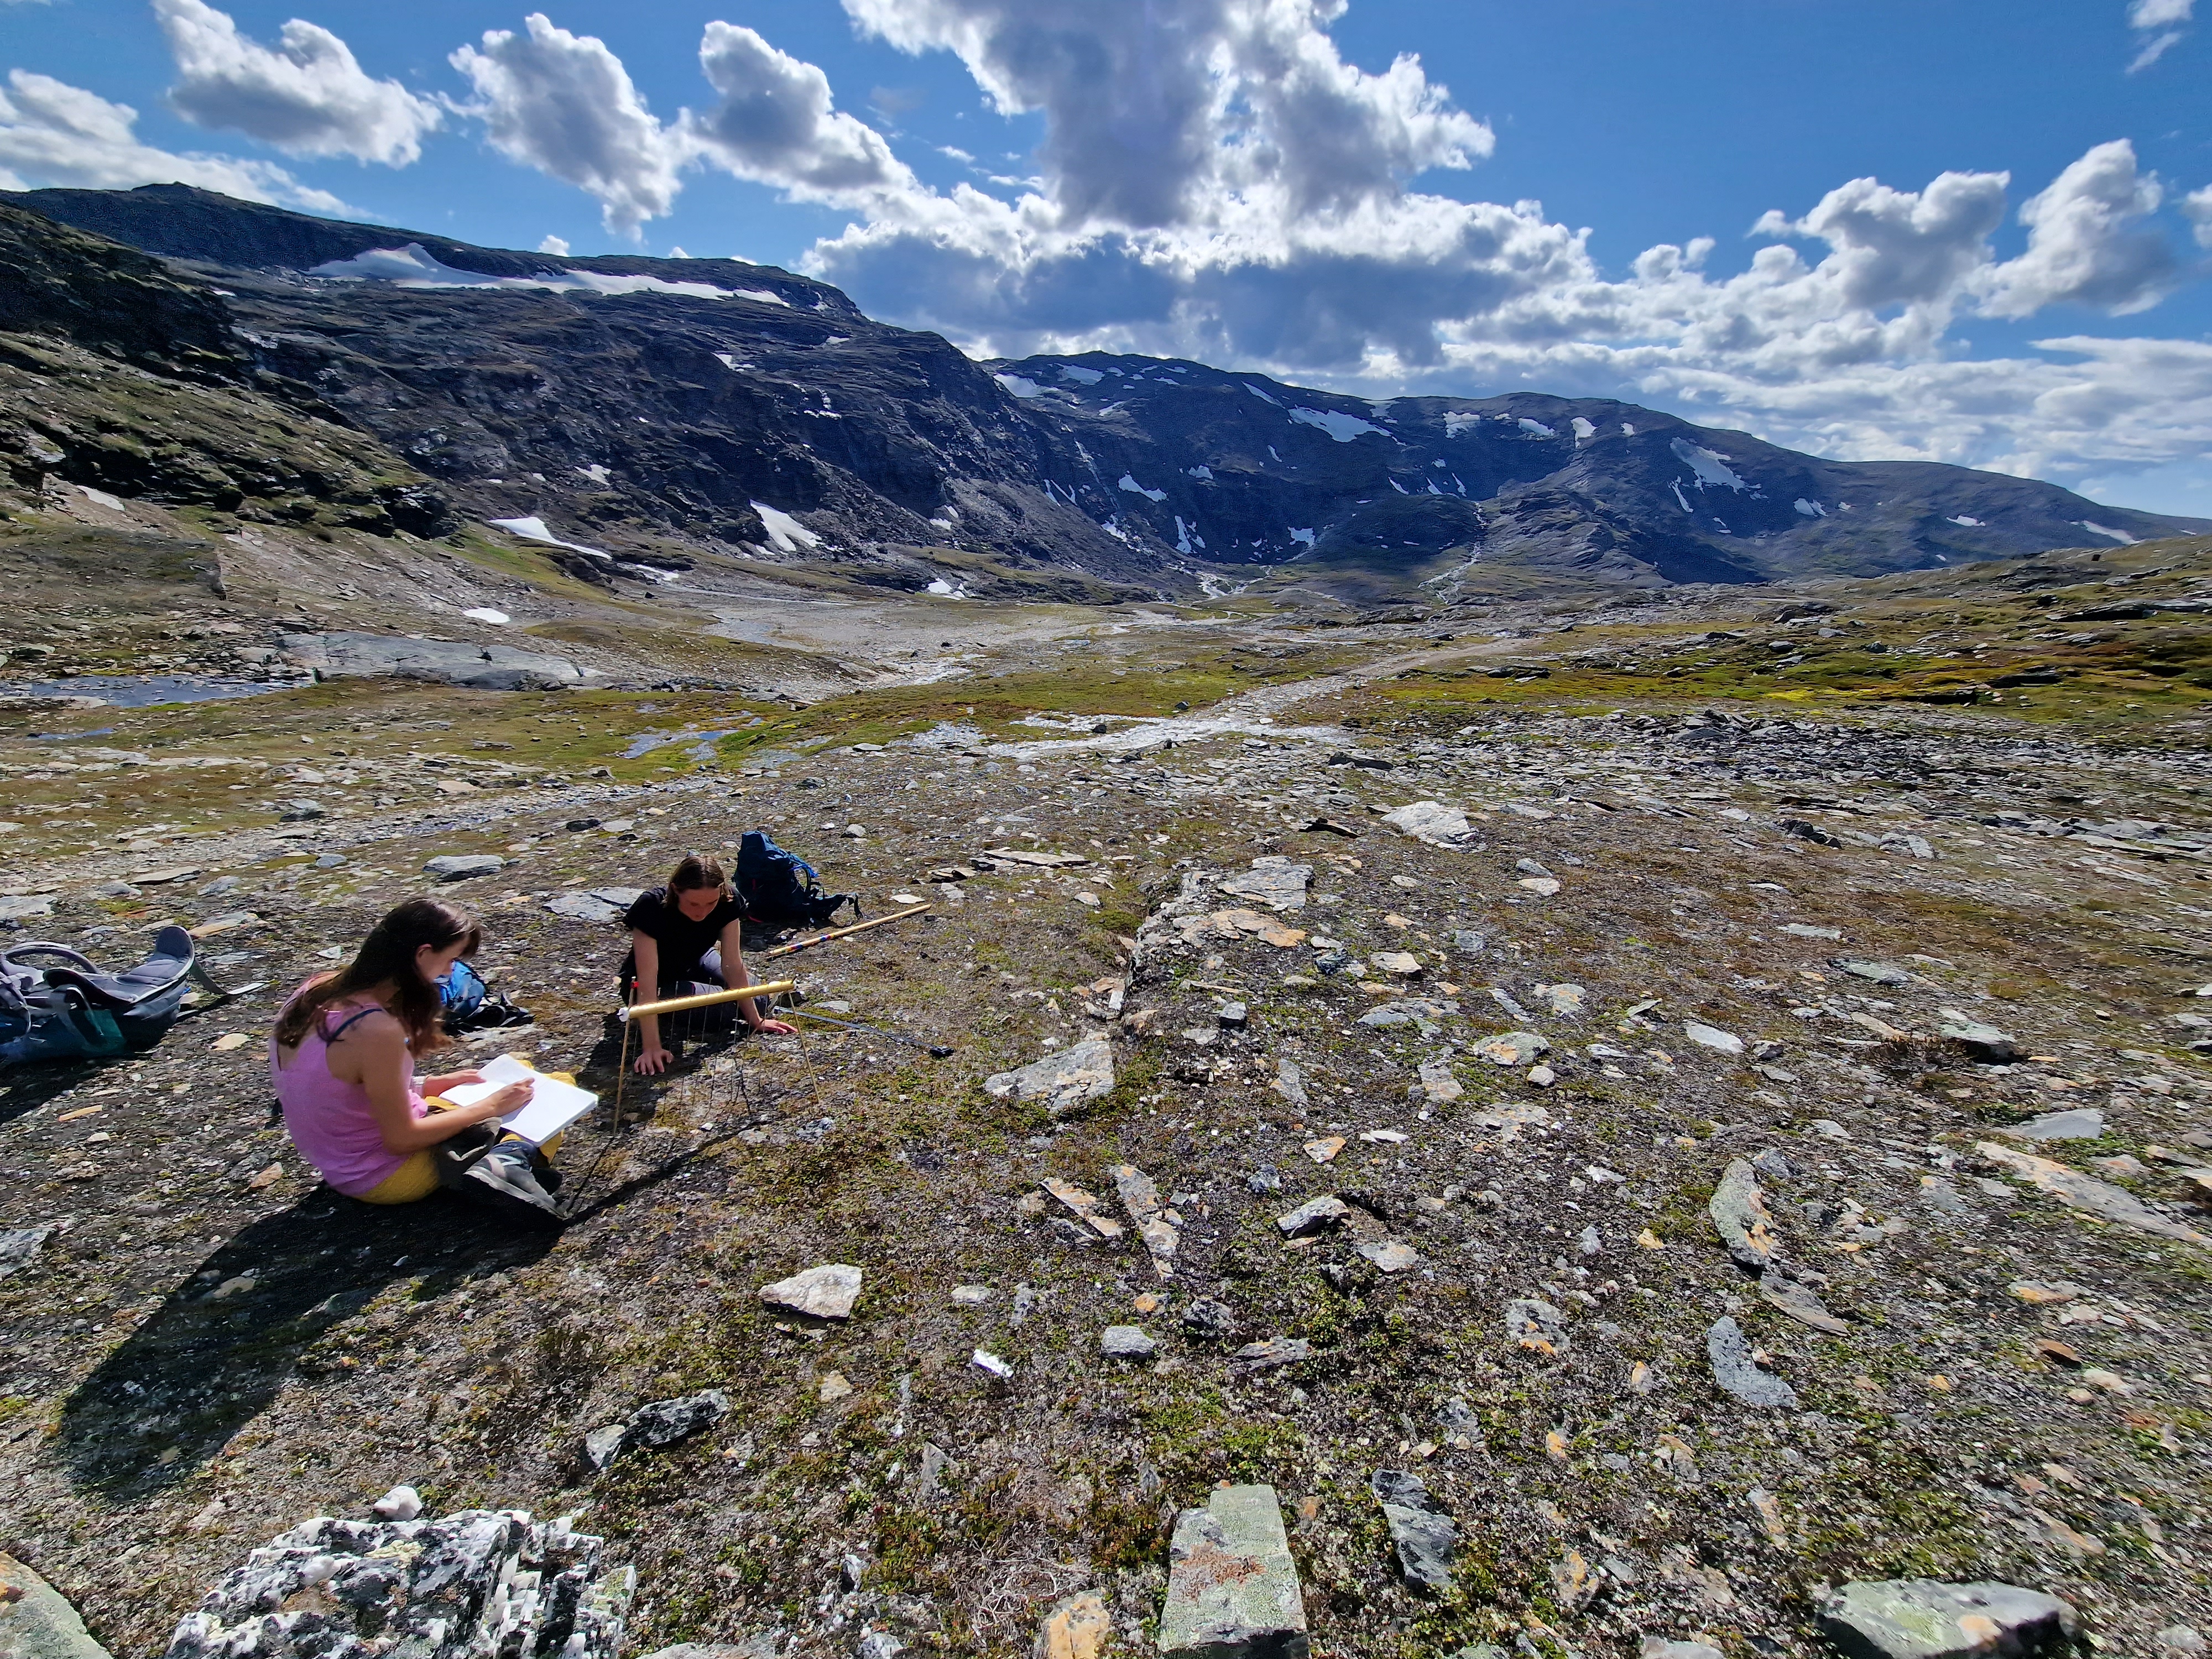
Now, it is mostly in charge of bringing us two days of happiness each year, as we enjoy its beautiful sites while reading out microclimate sensors and collecting vegetation data.
The road affectionately called ‘NO’, one of the cornerstones of our research since 2012Our home for the night in the Skjomdal. Upgraded with a solar panel this year, the homely light inside for the first time didn’t have to come from candles.
On our way to Abisko, northern Sweden, a massive early-morning thunderstorm in Brussels was the start of a 28-hour travel delay: we missed our next flight with a margin of just 10 minutes, and as such ended up too late for the last flight of the day to the little airport of Kiruna. Most of that delay was spent at Stockholm Arlanda, the giant travel hub just north of Swedish capital. There, we had to put up quite the fight to keep the delay at 28 hours only, as the initial proposition was closer to 72…
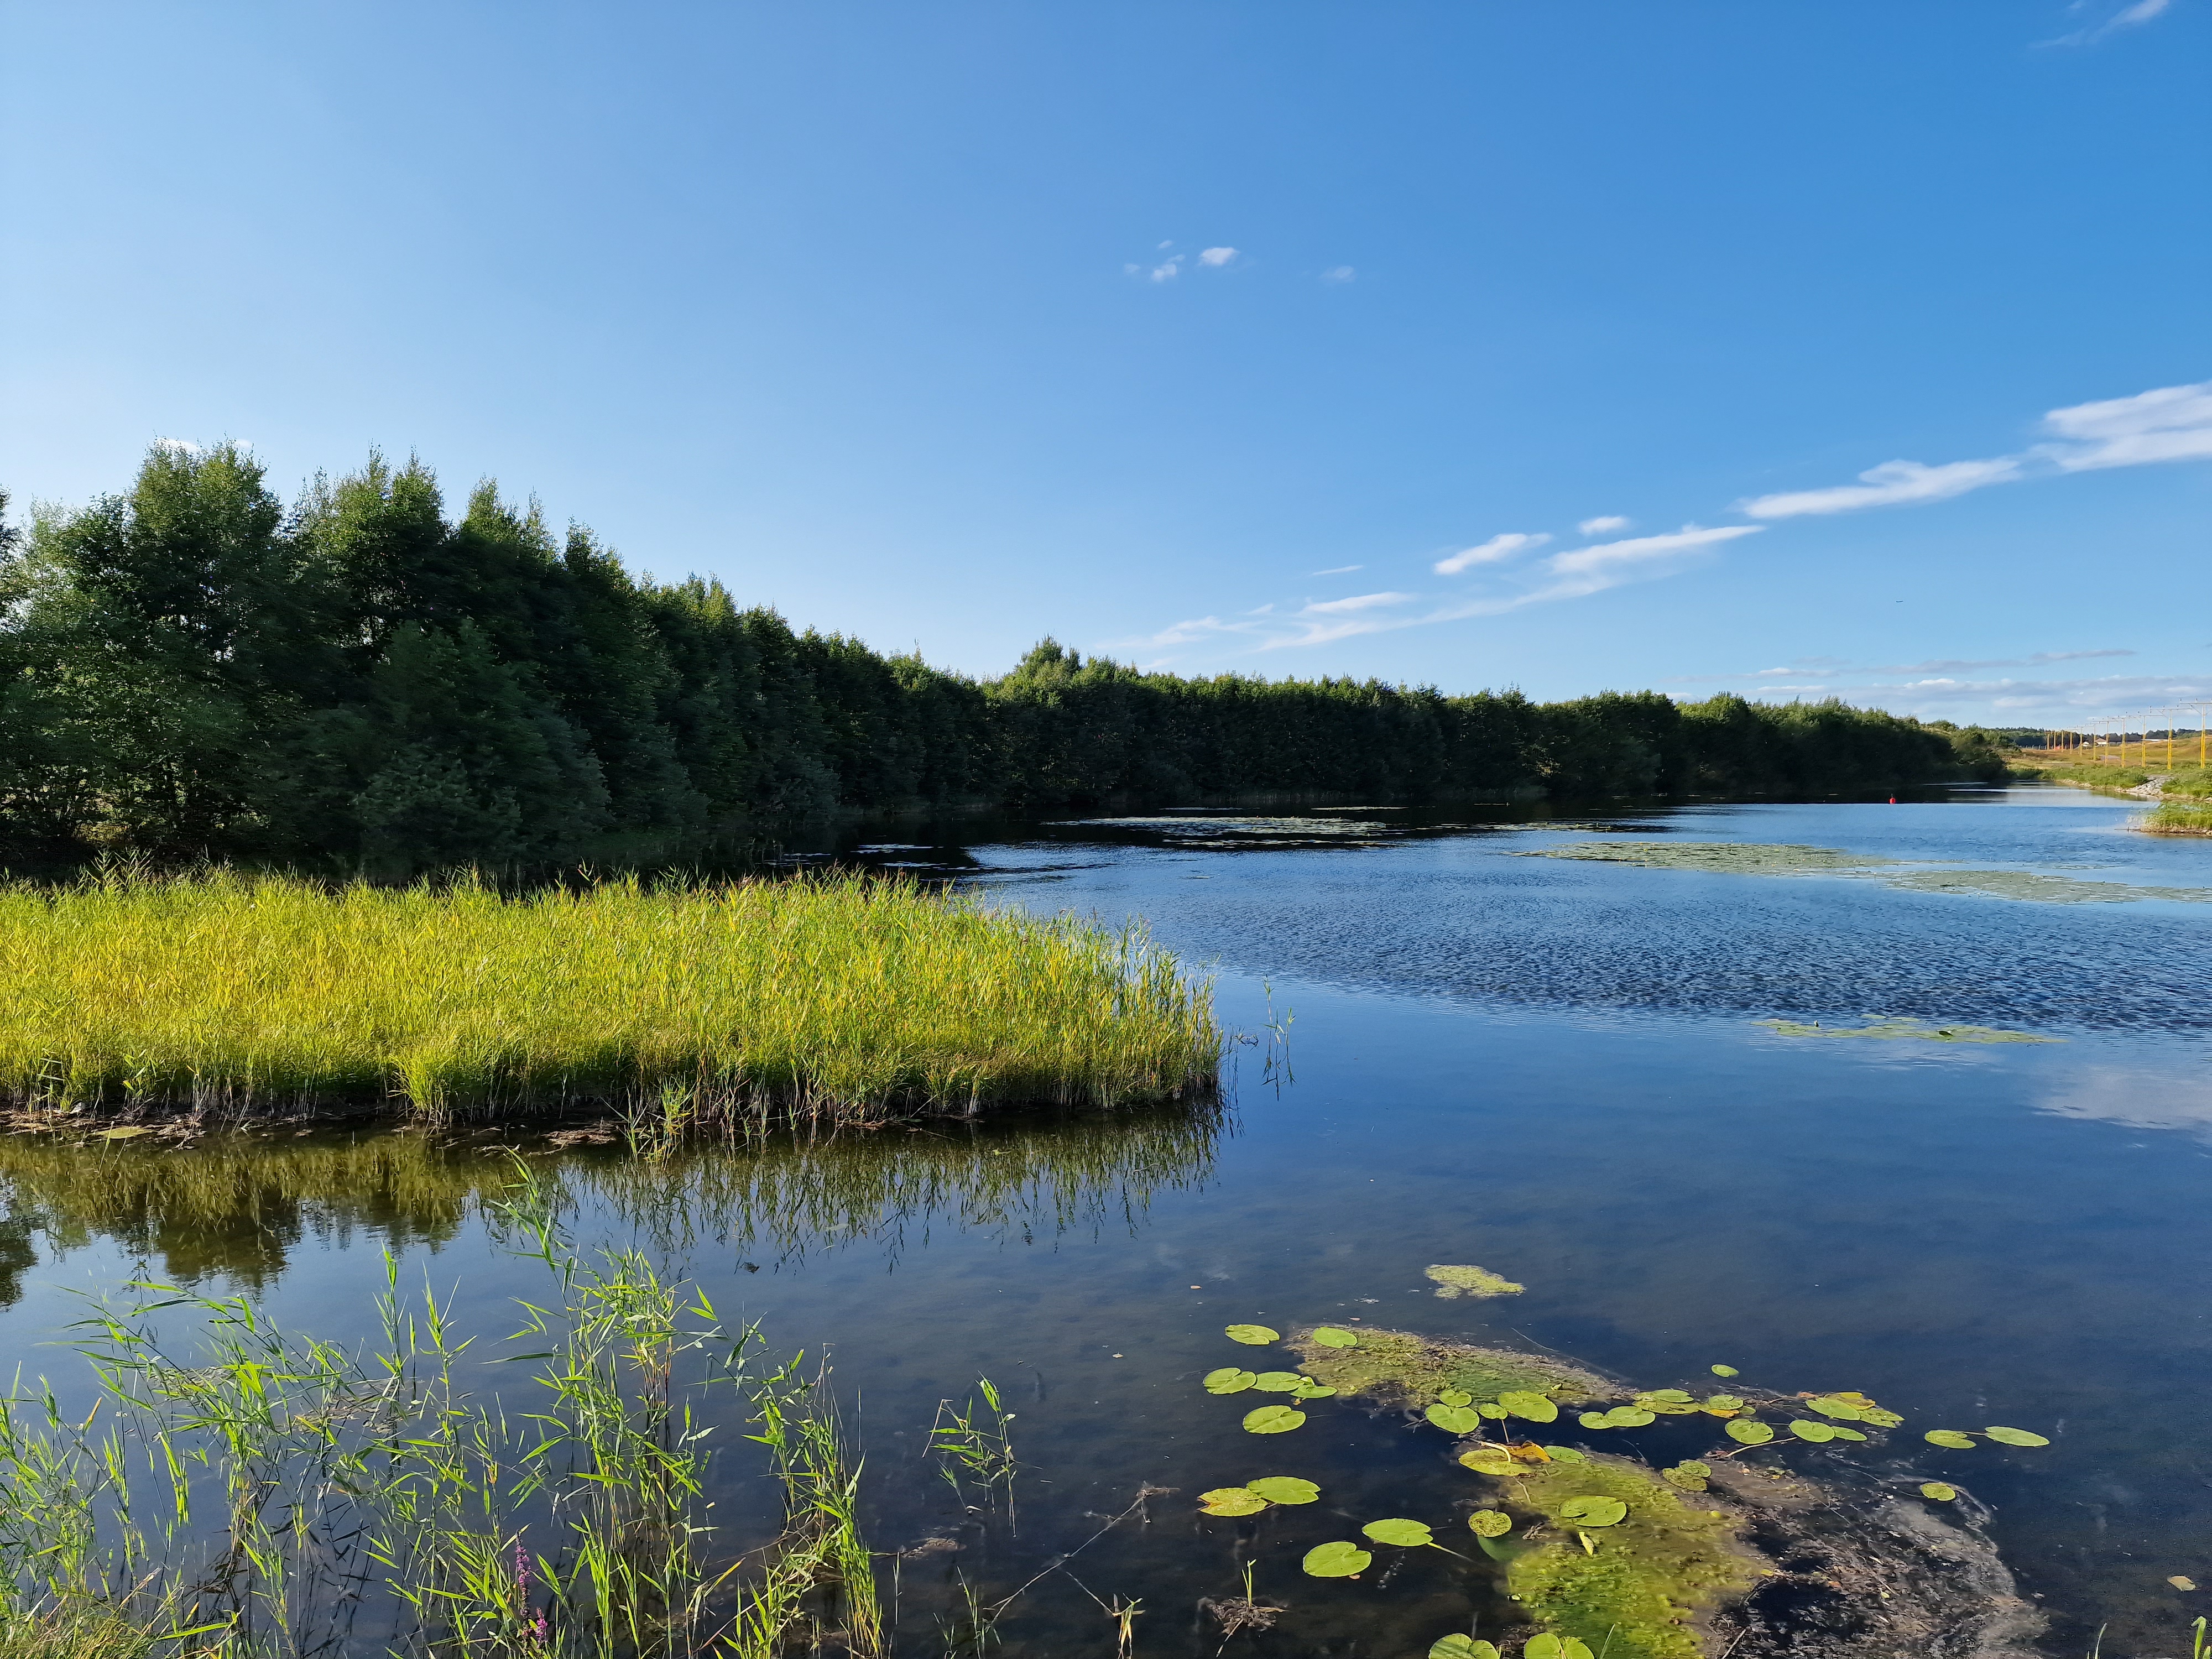
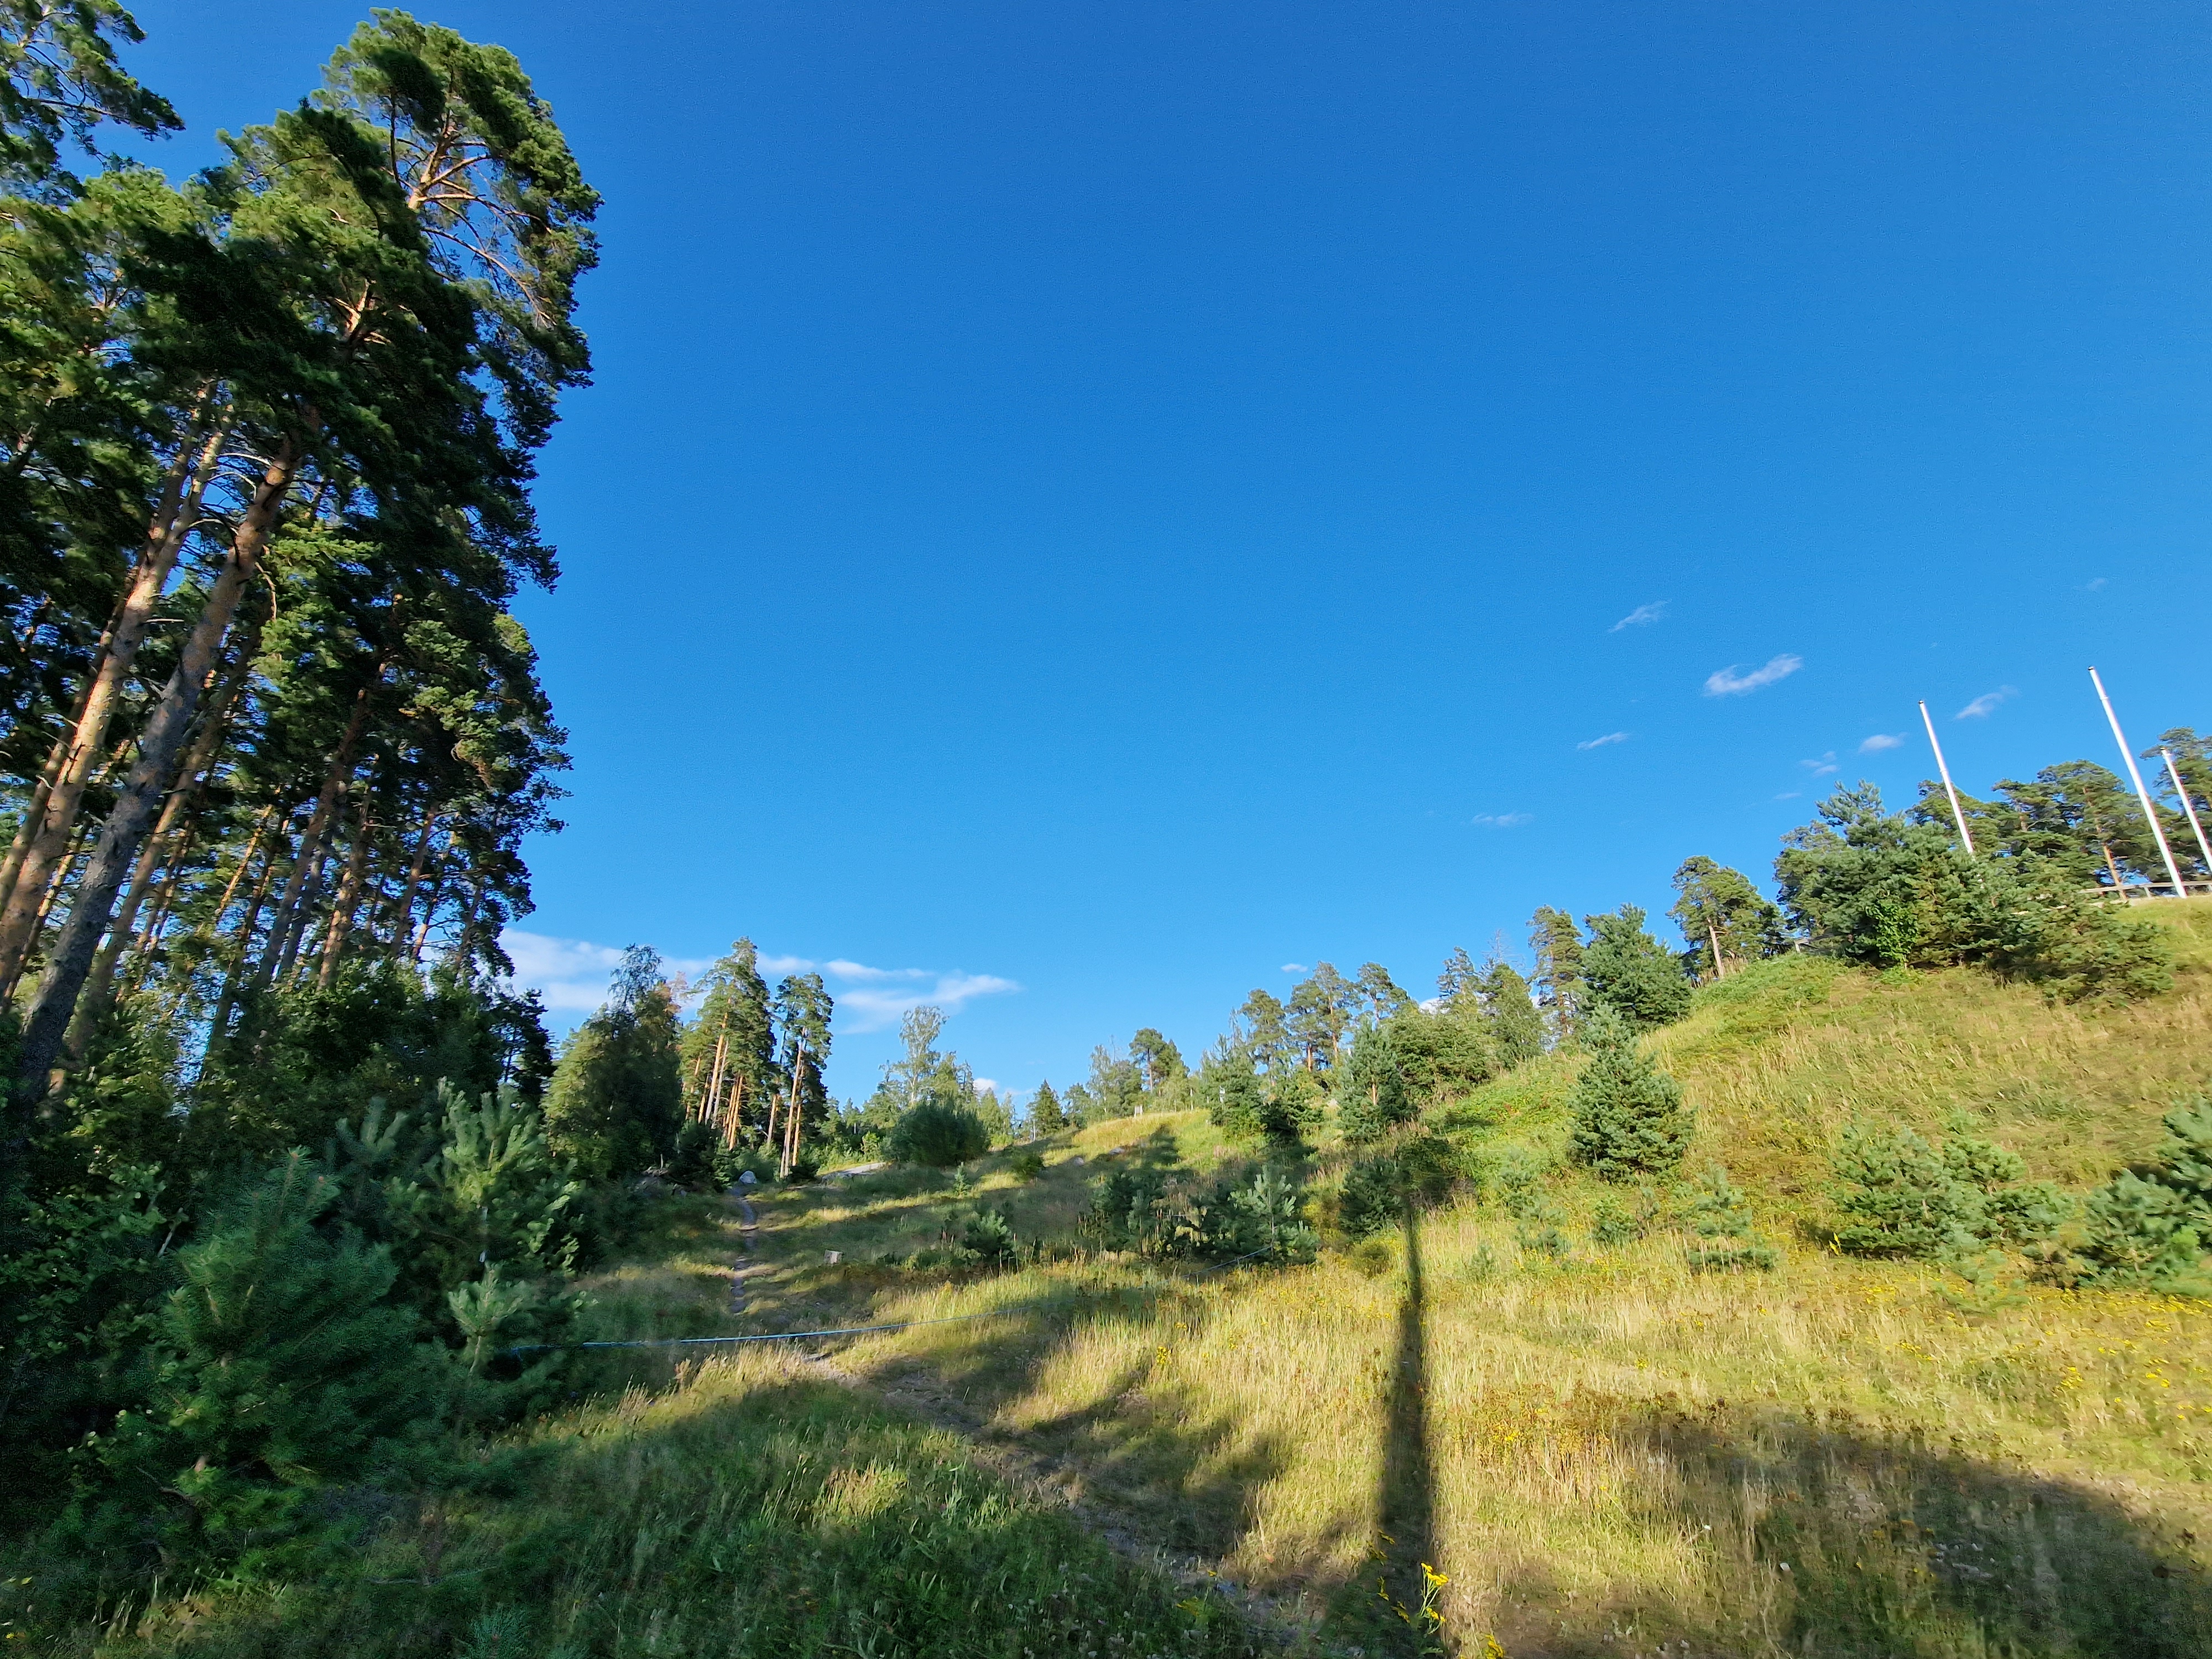
Now, students and I were not there to sit around and do nothing, we were travelling north for plants and nature! So, after the airline put is in the very agreeable ‘Comfort Hotel’ on the airport grounds to bridge the gap, we brought up a map of the airport and looked for an escape into the Swedish countryside. Now, Arlanda turned out to be remarkably suitable for such a plan. In less than half an hour of improvised hiking, we had left the concrete nothingness of the airport and wandered into increasingly amazing nature.
And so it happened that our layover at Stockholm Arlanda was used learning Swedish plants, chasing insects and discovering wildlife. In the end, the perfect start for the students for their month of botanizing in Abisko. The mood was set. The trip was going to be epic.
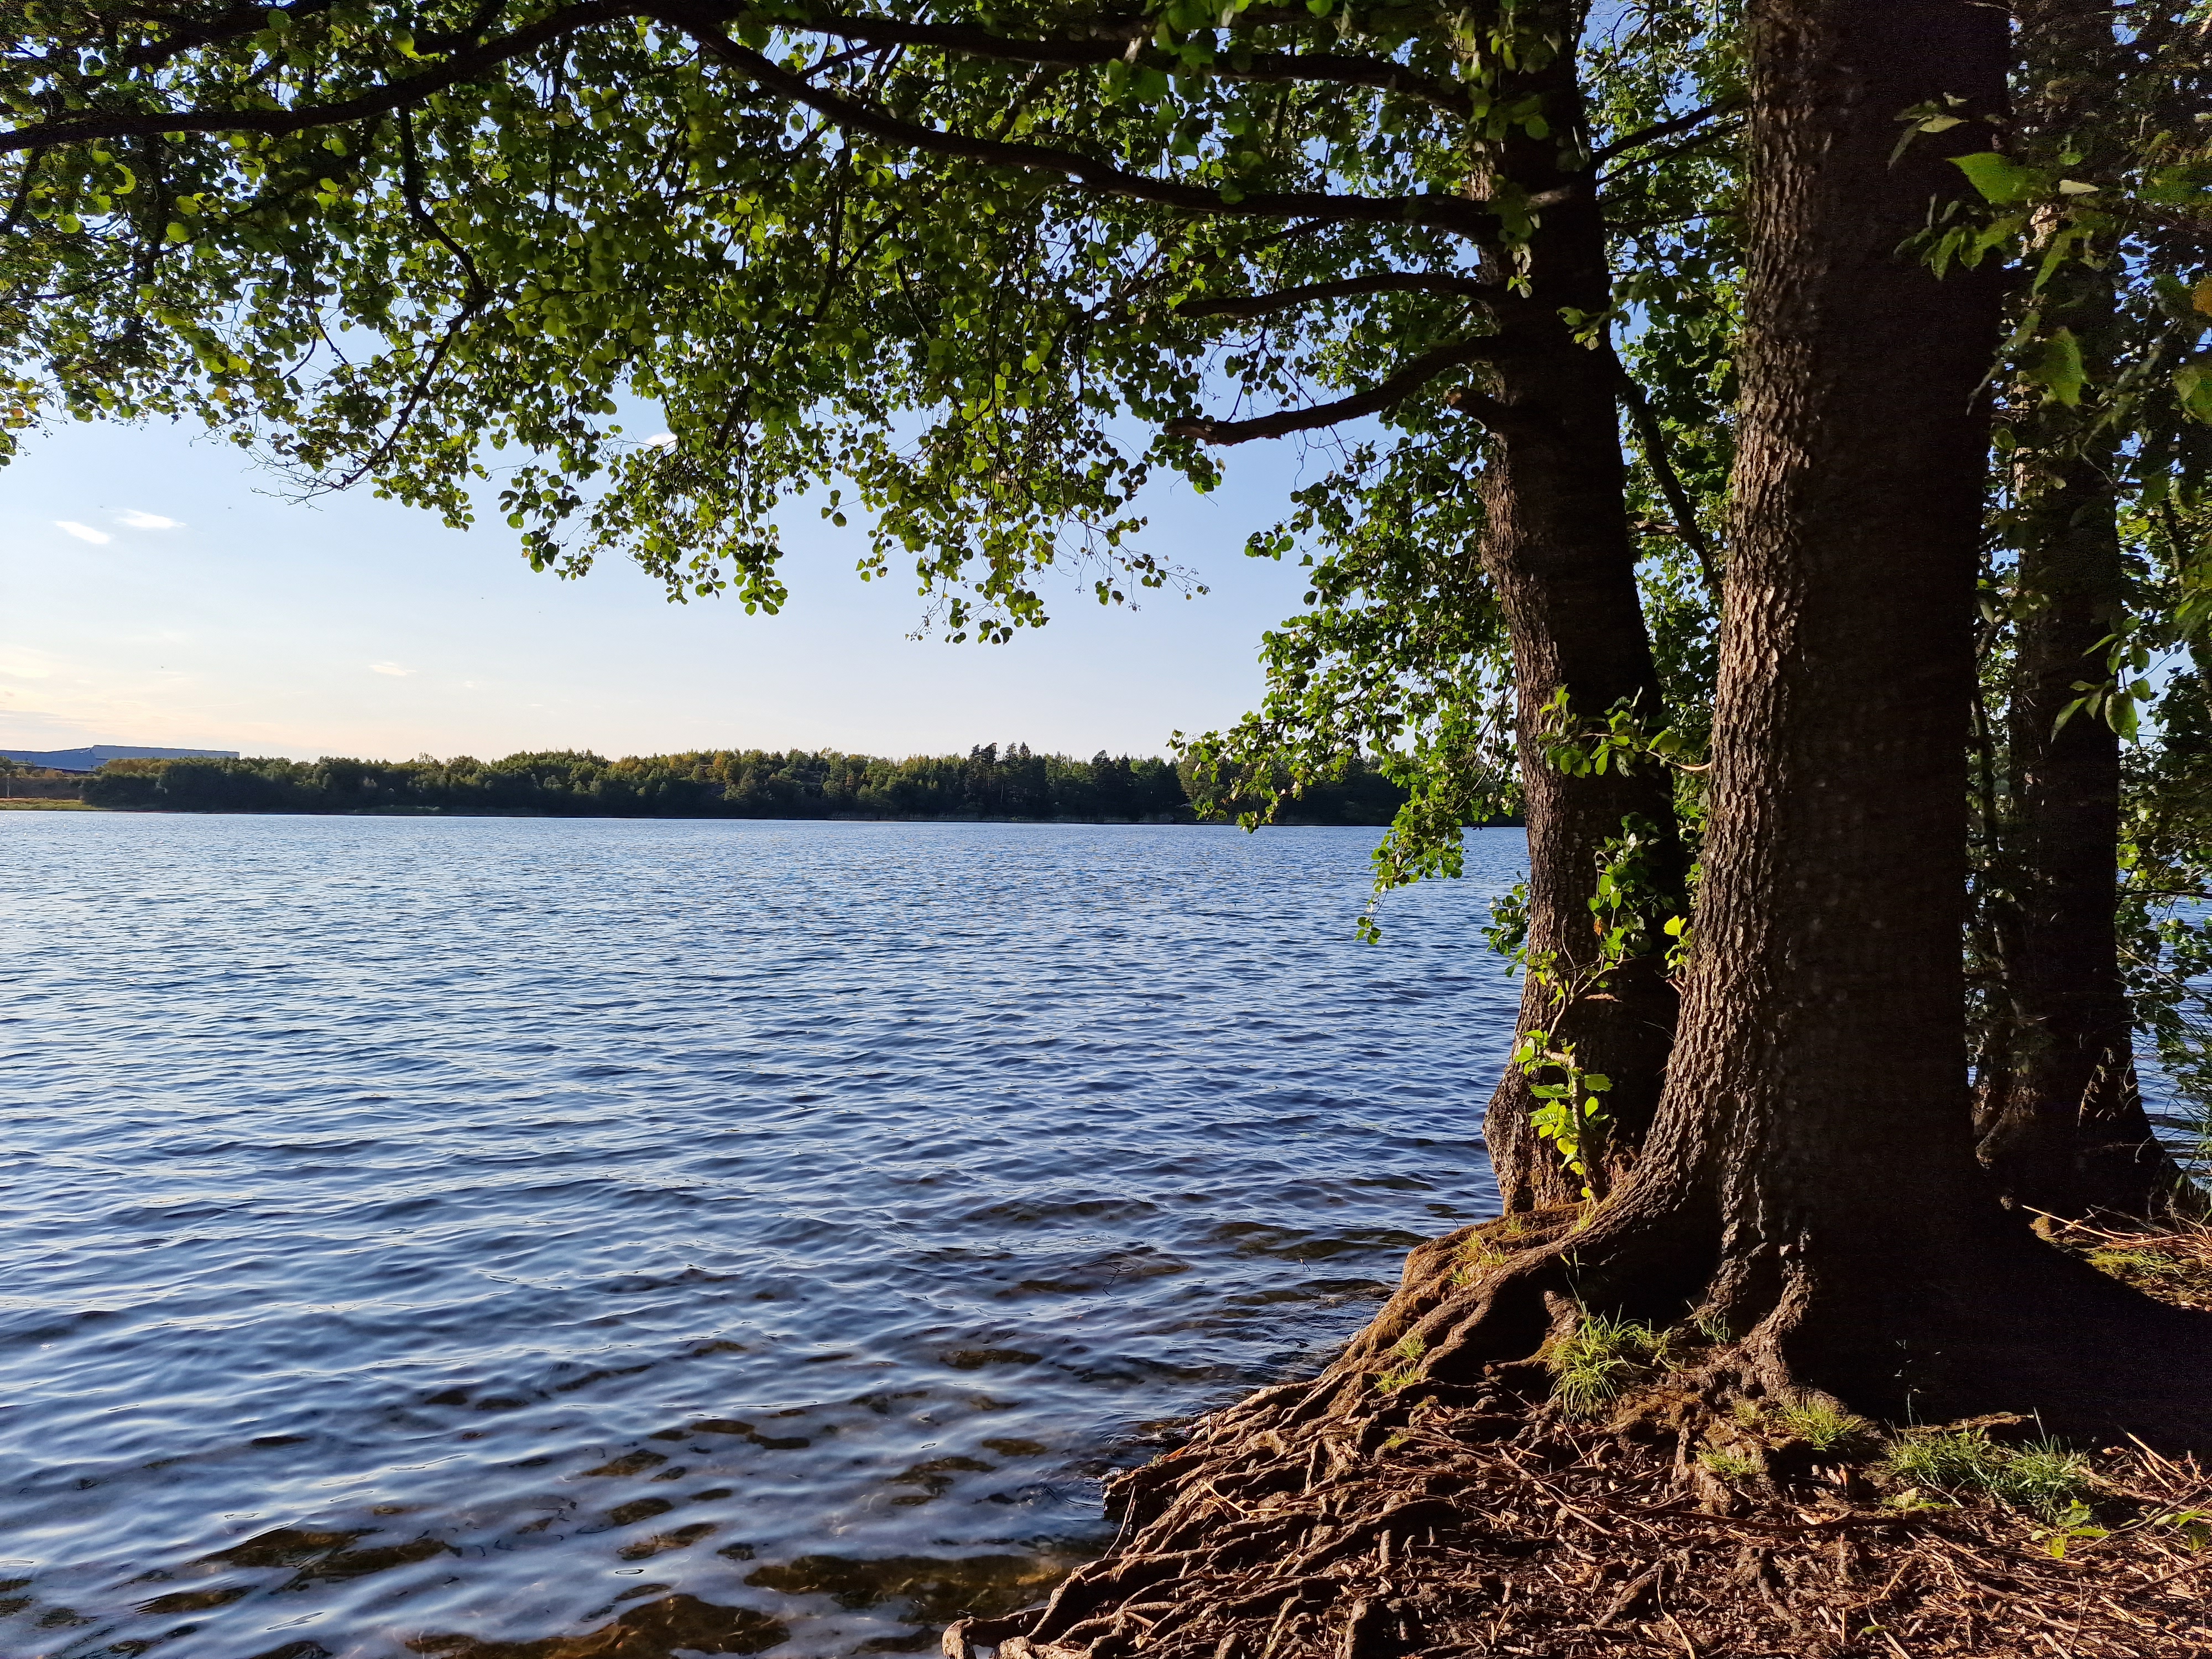
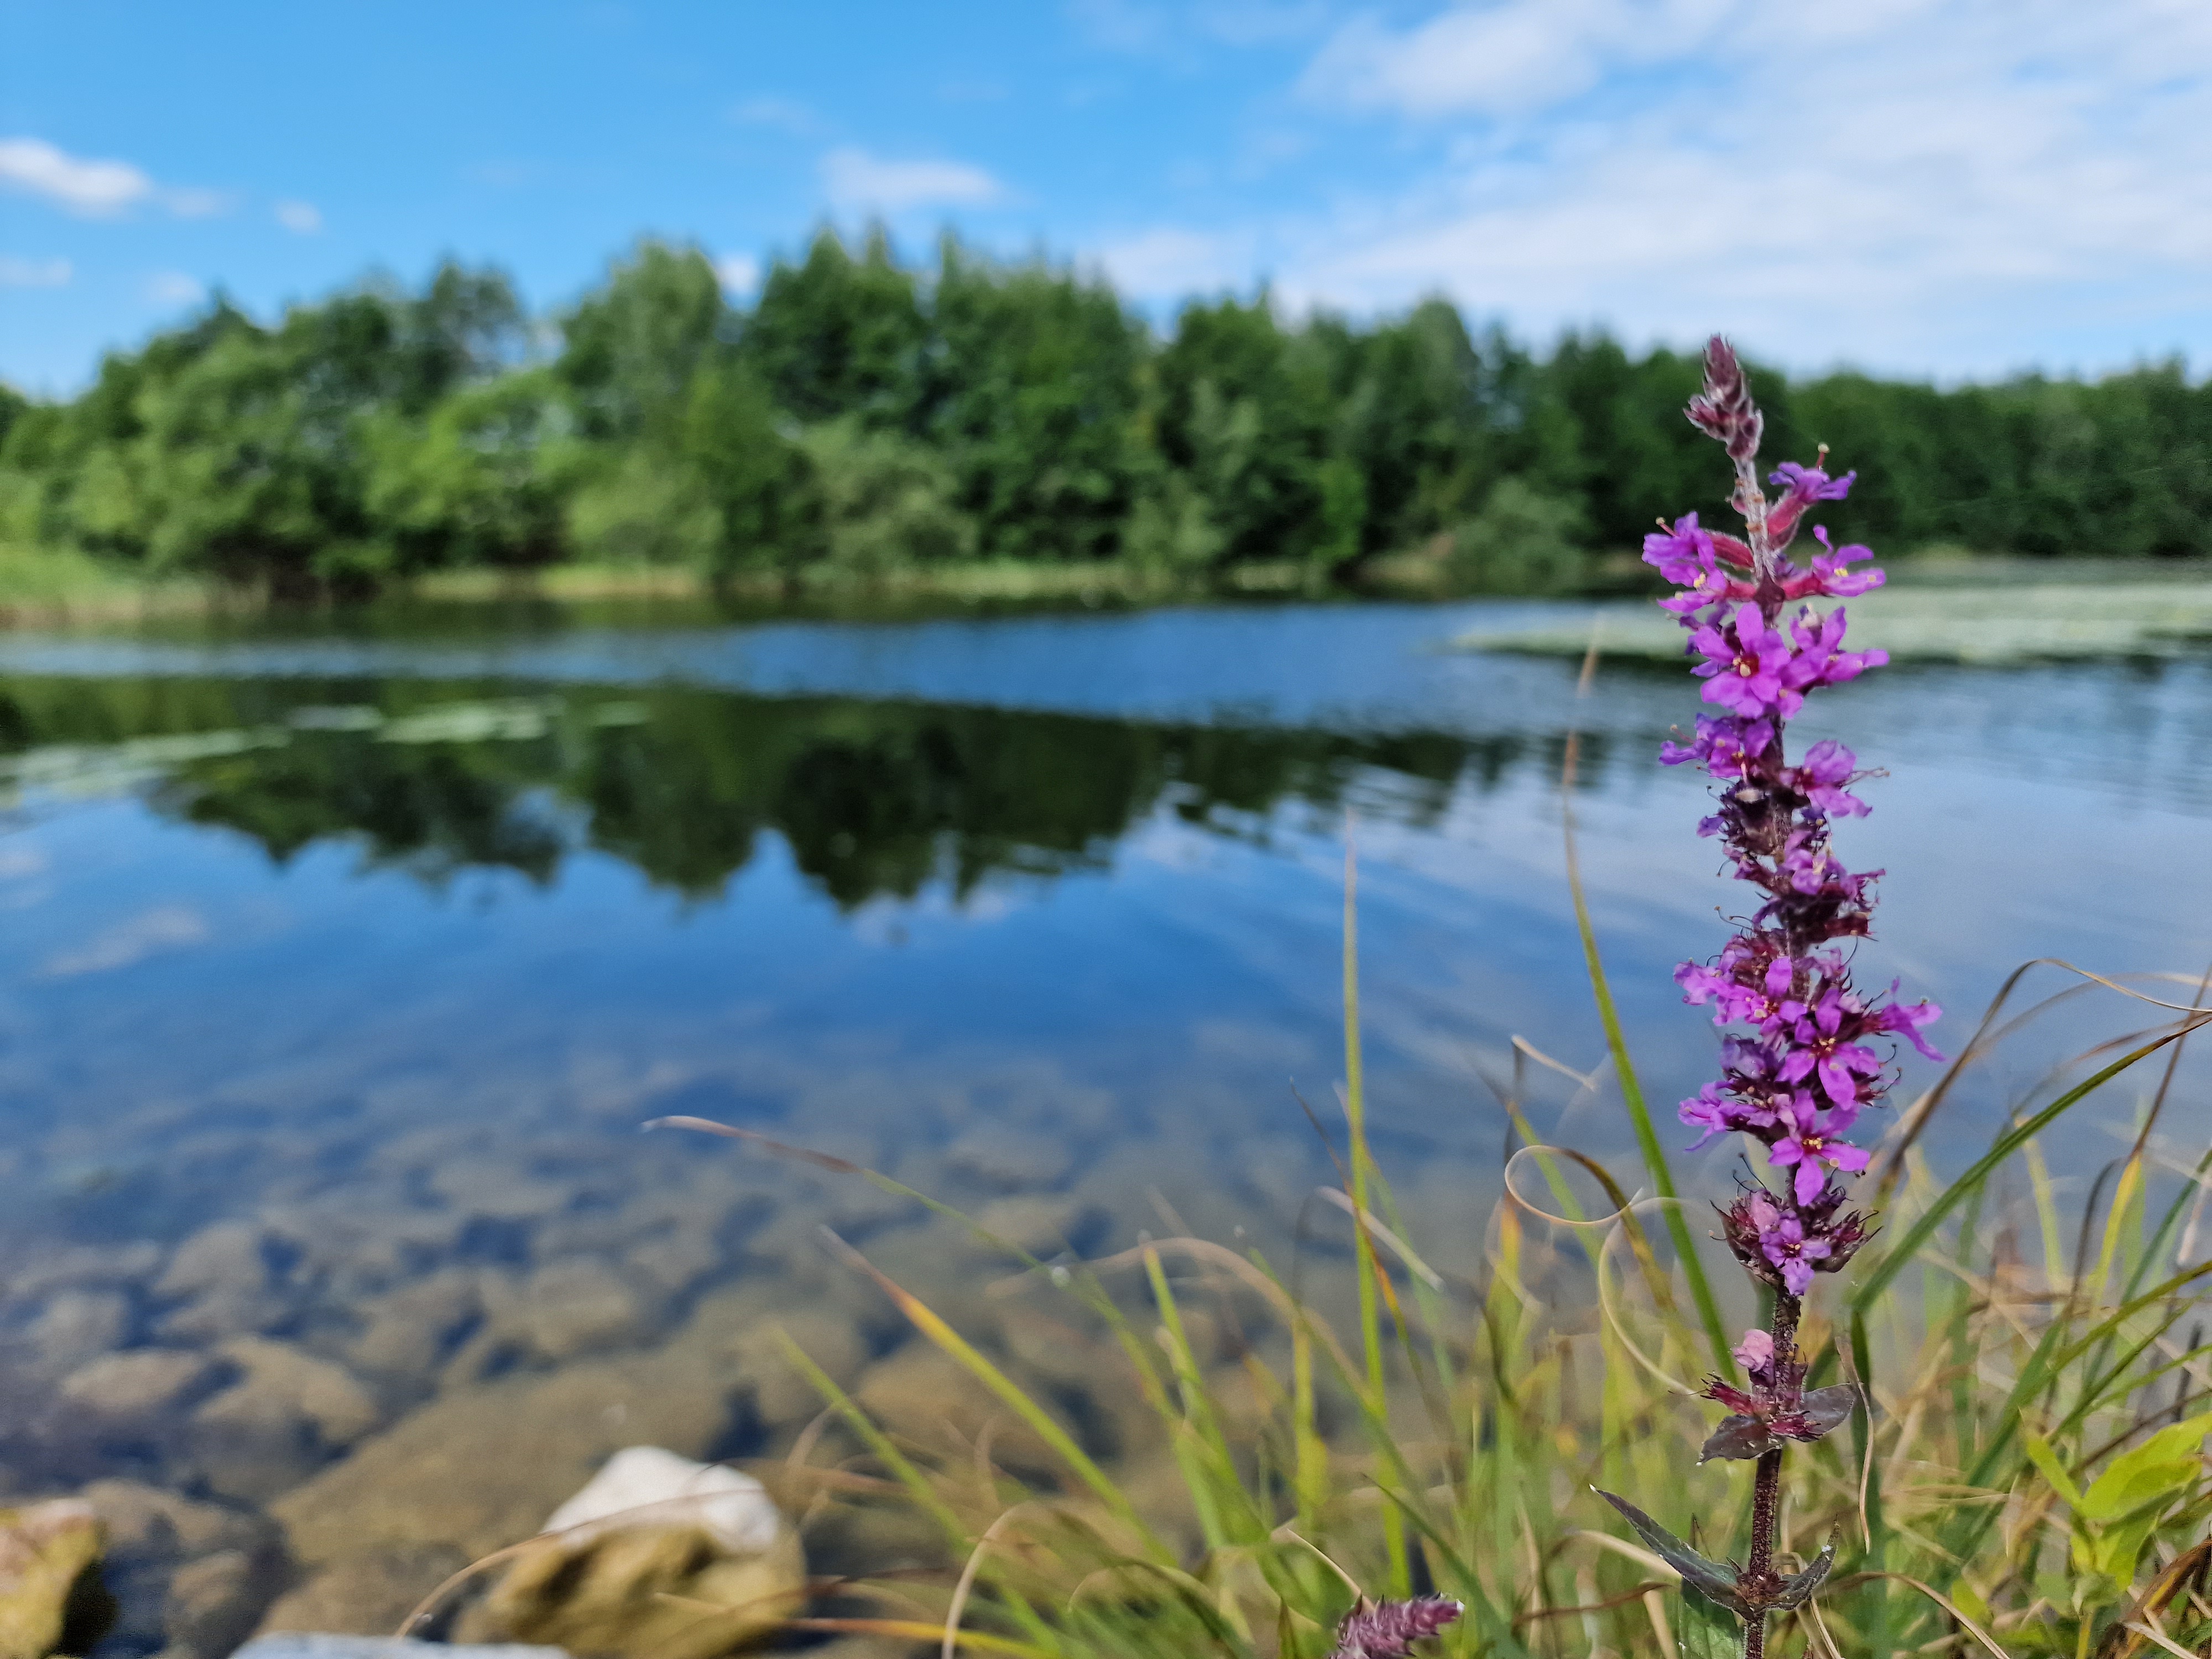
Top row: picturesque Swedish countryside house, some ‘true’ Swedish heathland, and a remarkably biodiverse lake.
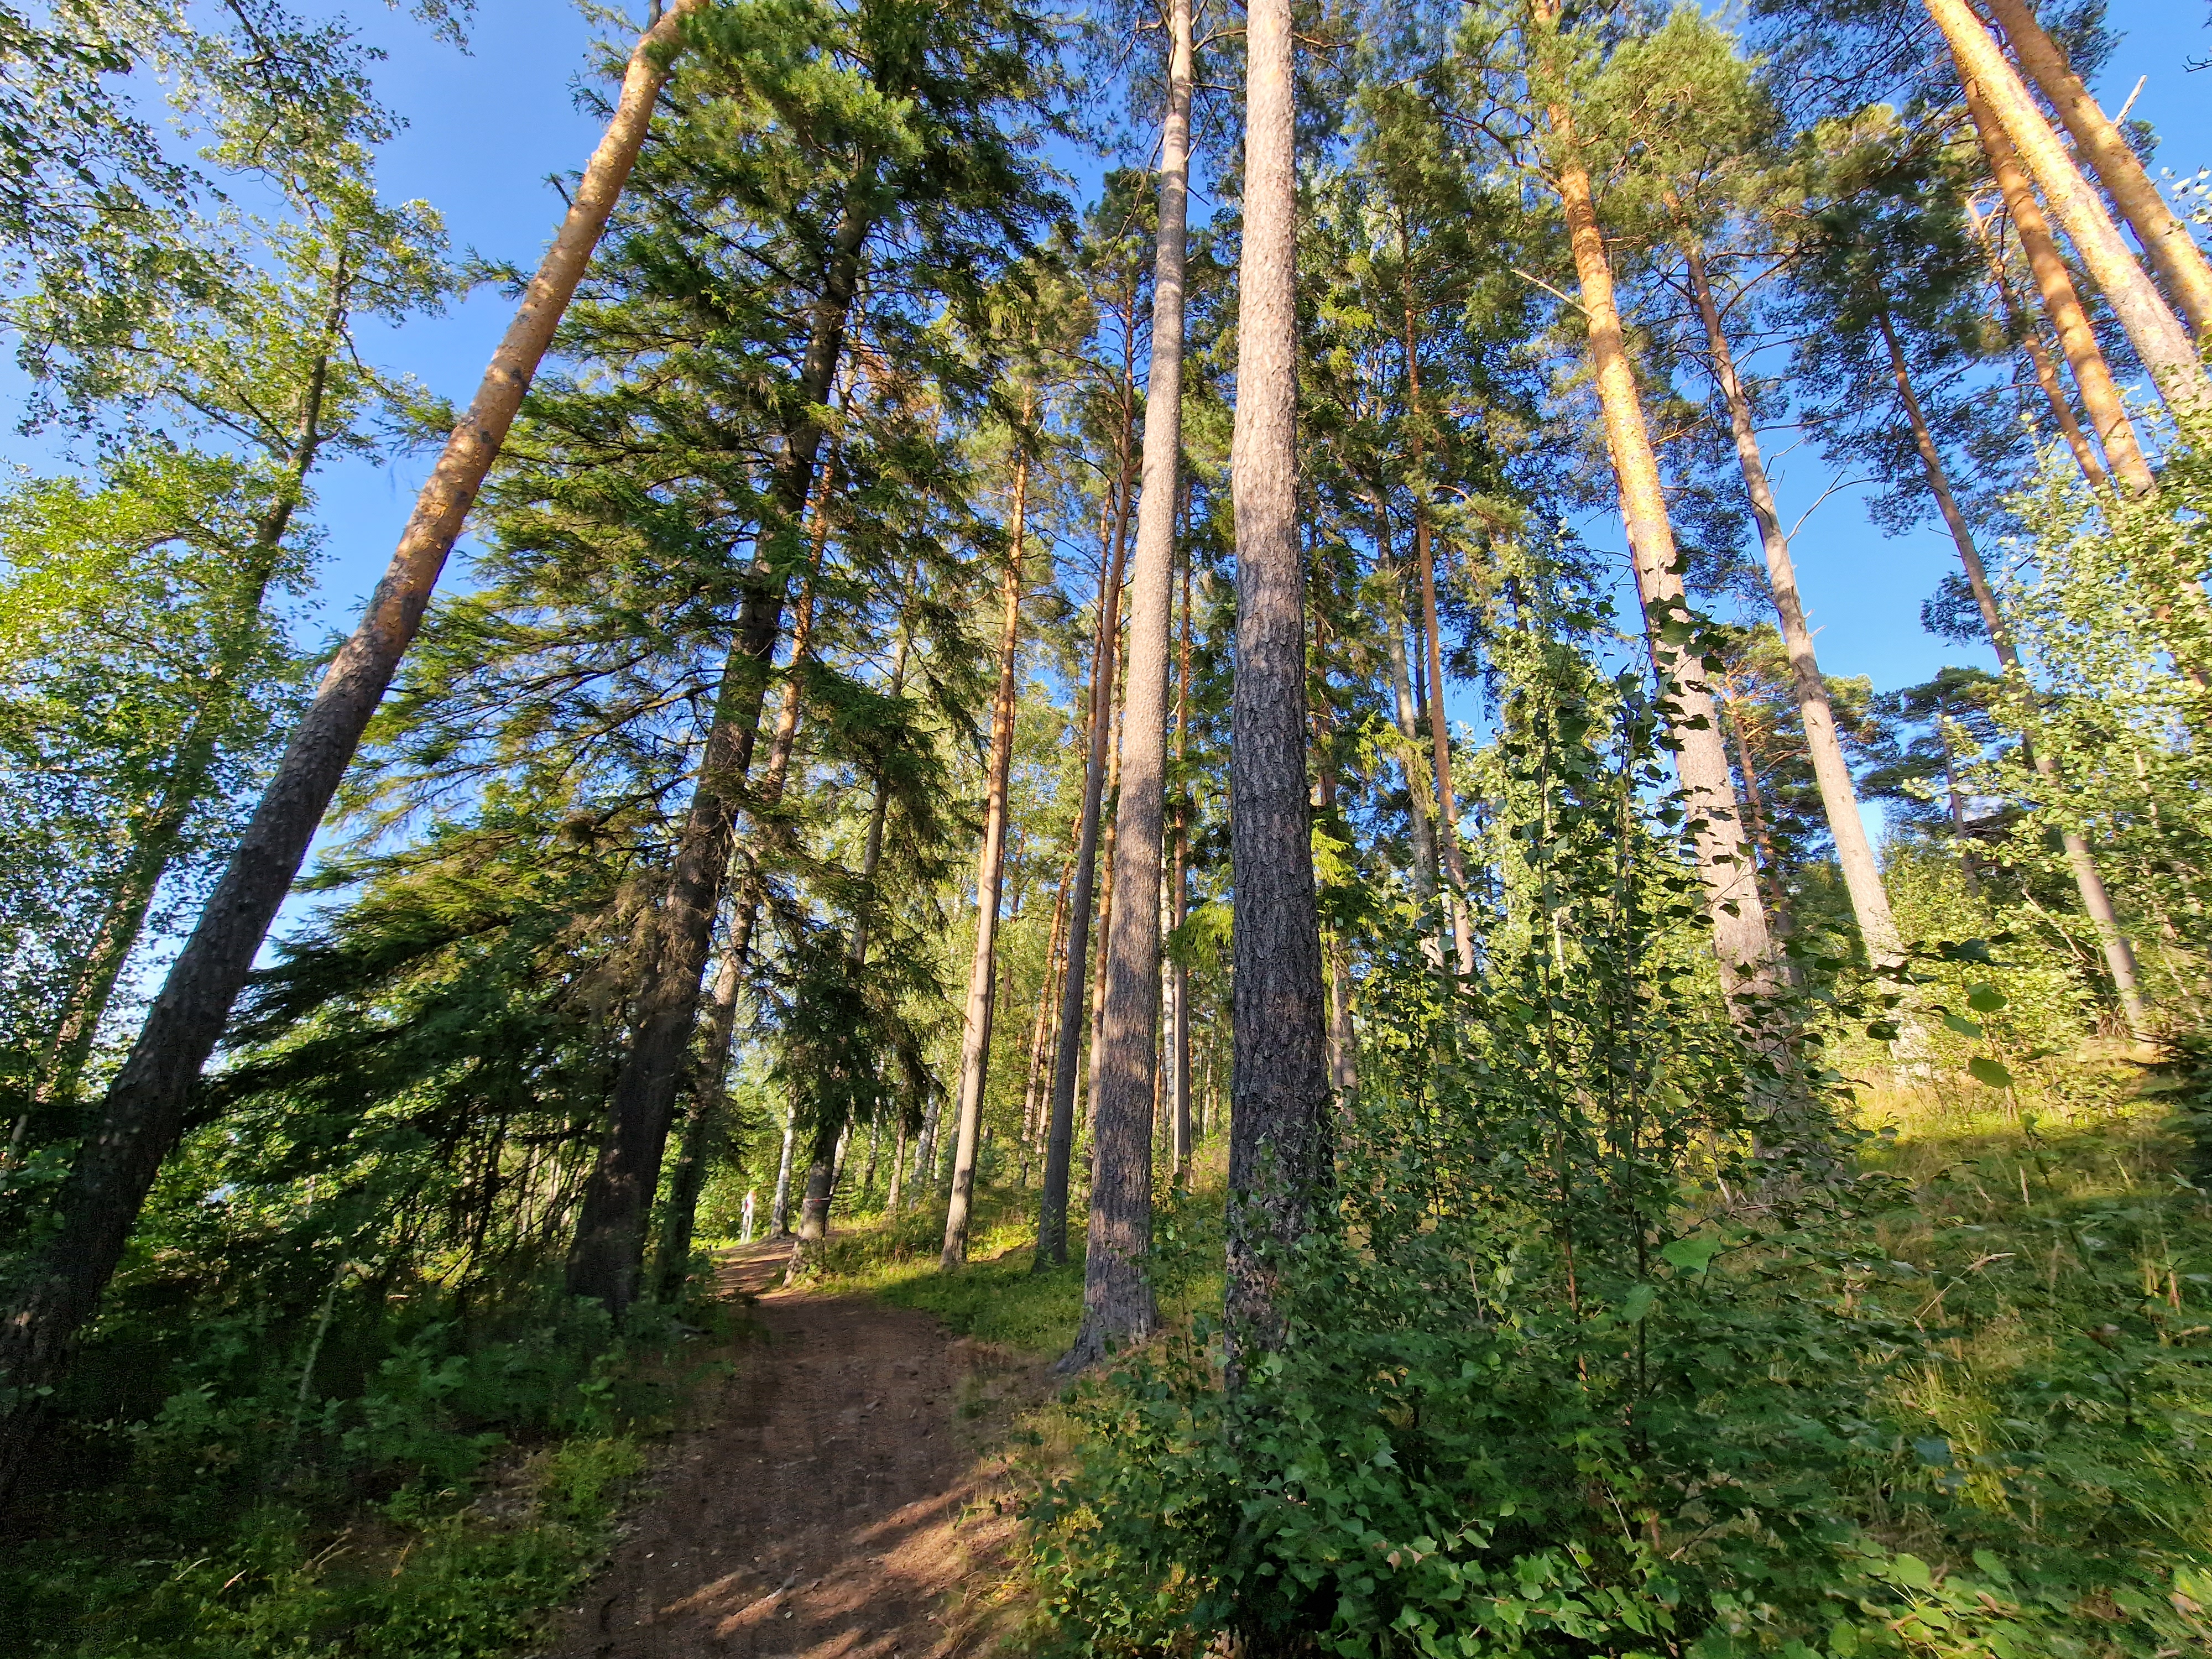
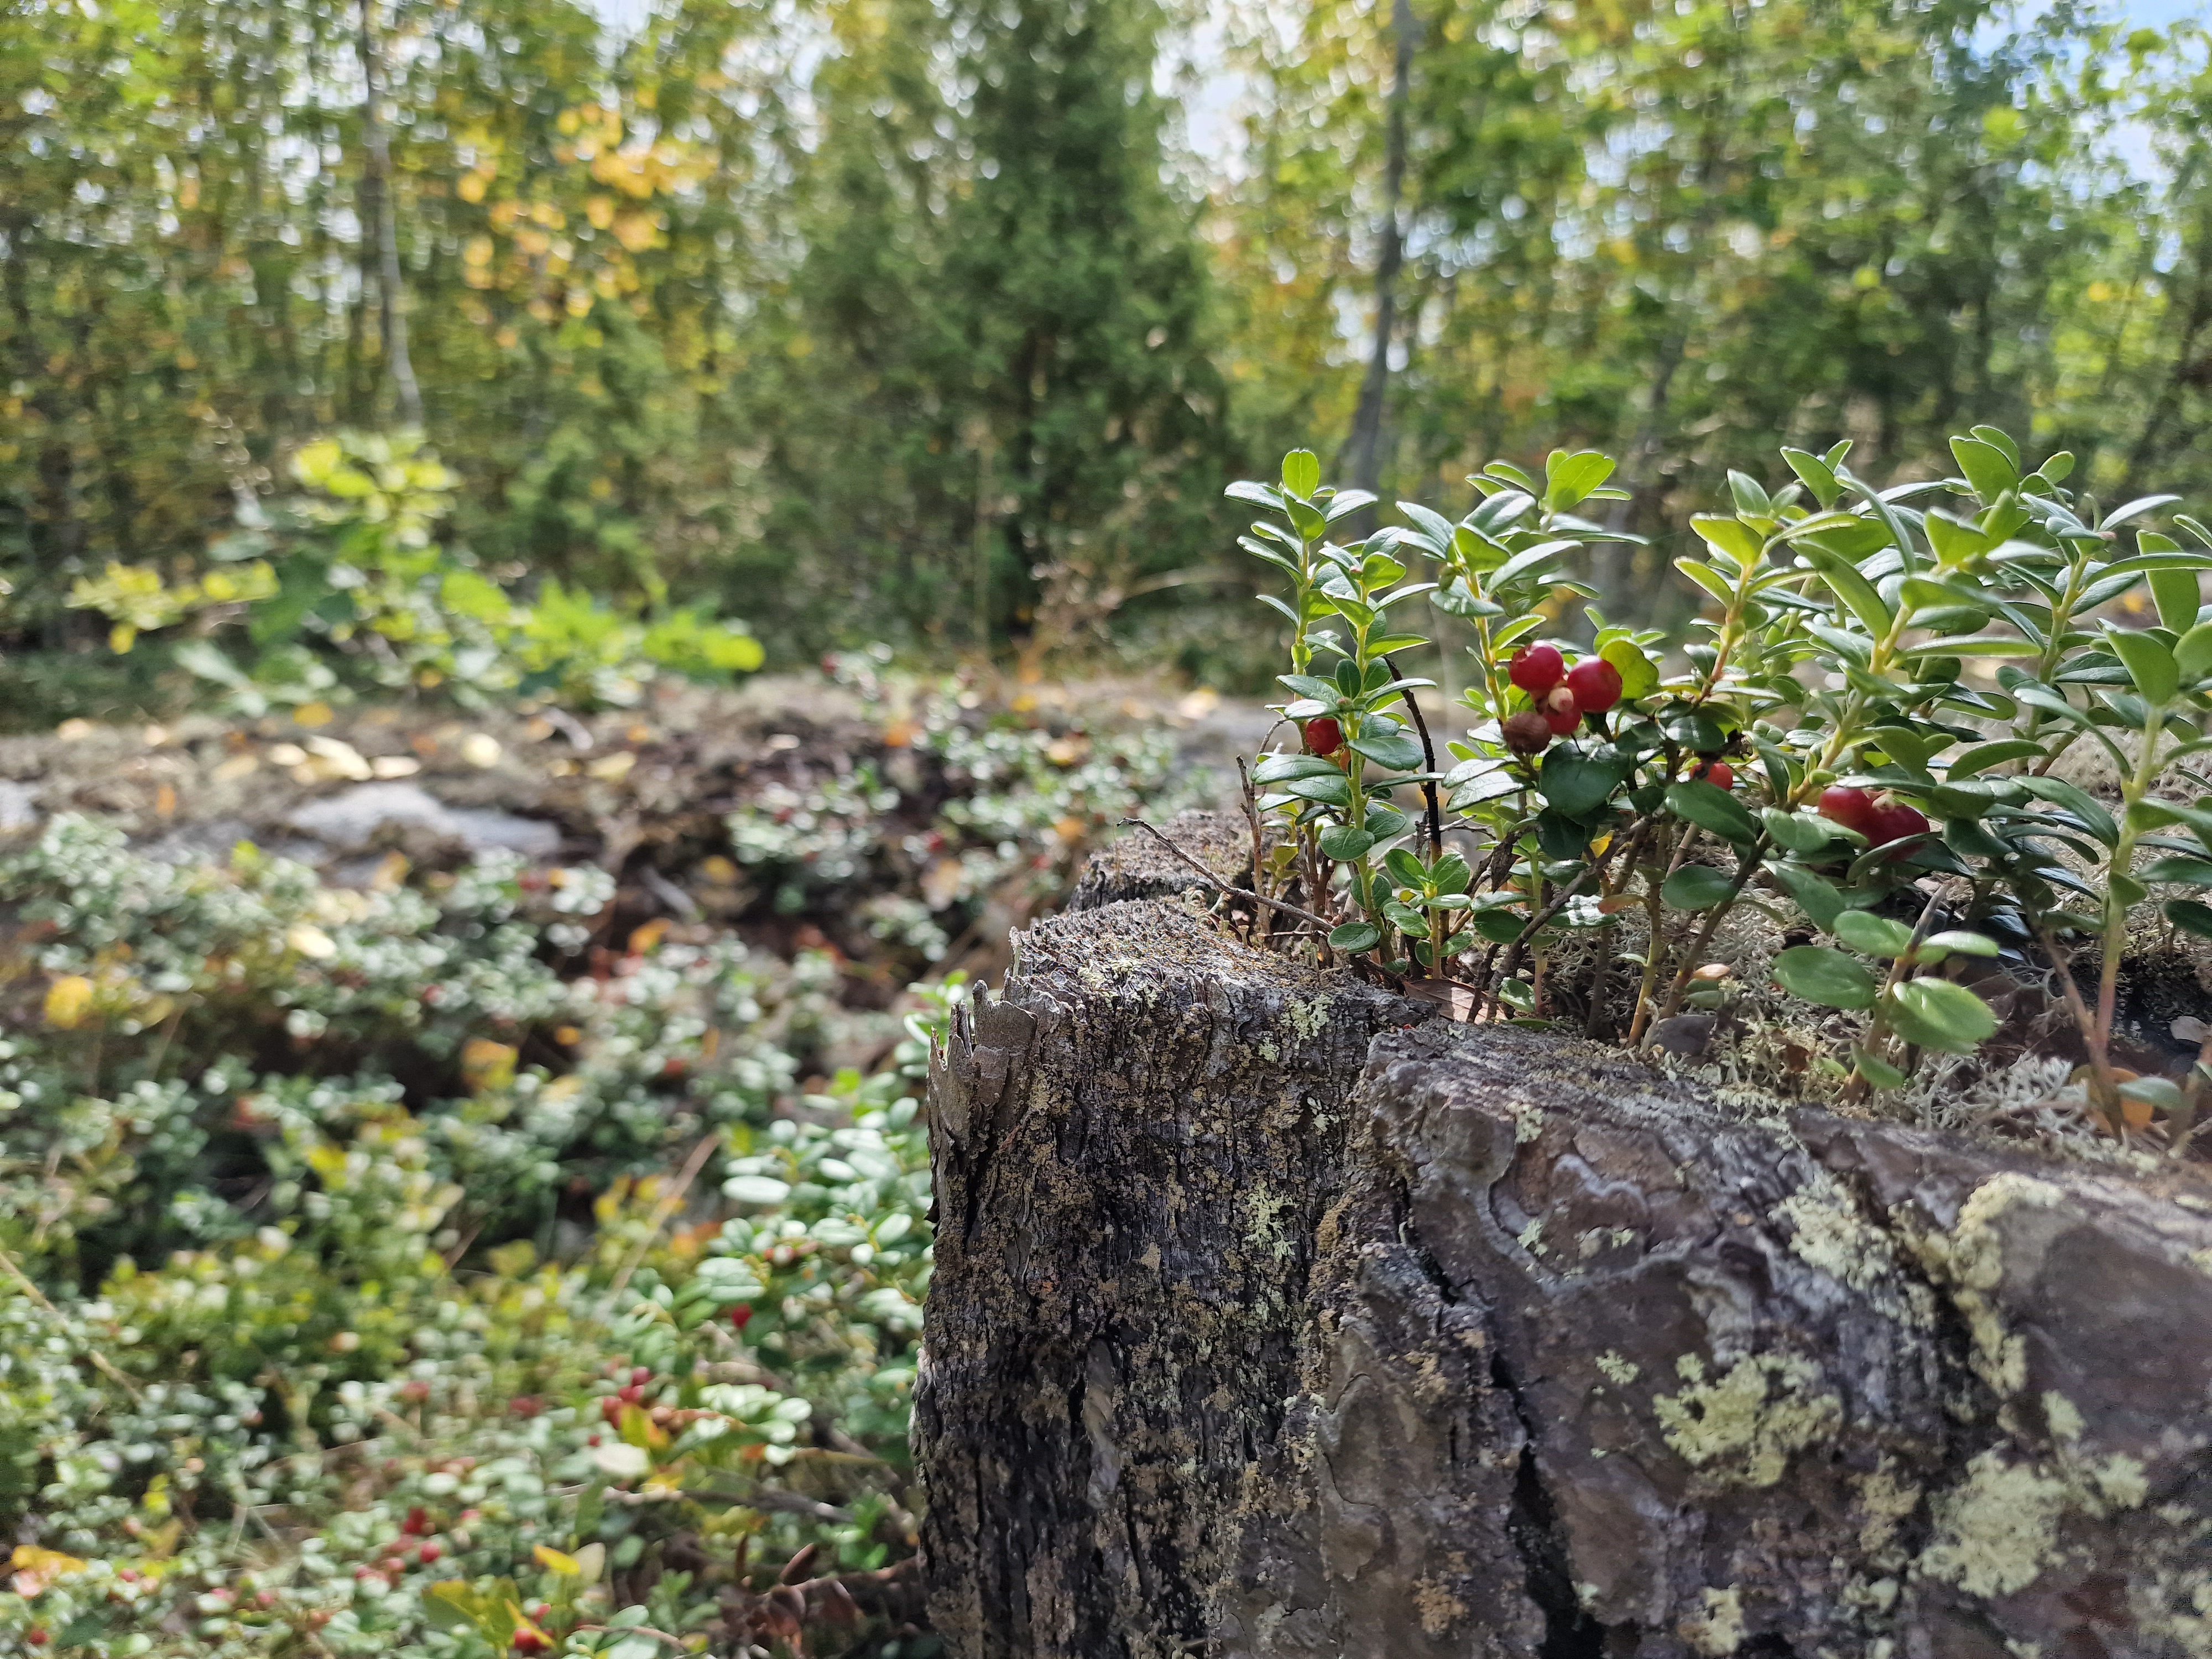
Second row: relatively epic forest landscapes – Swedish strongsuit.
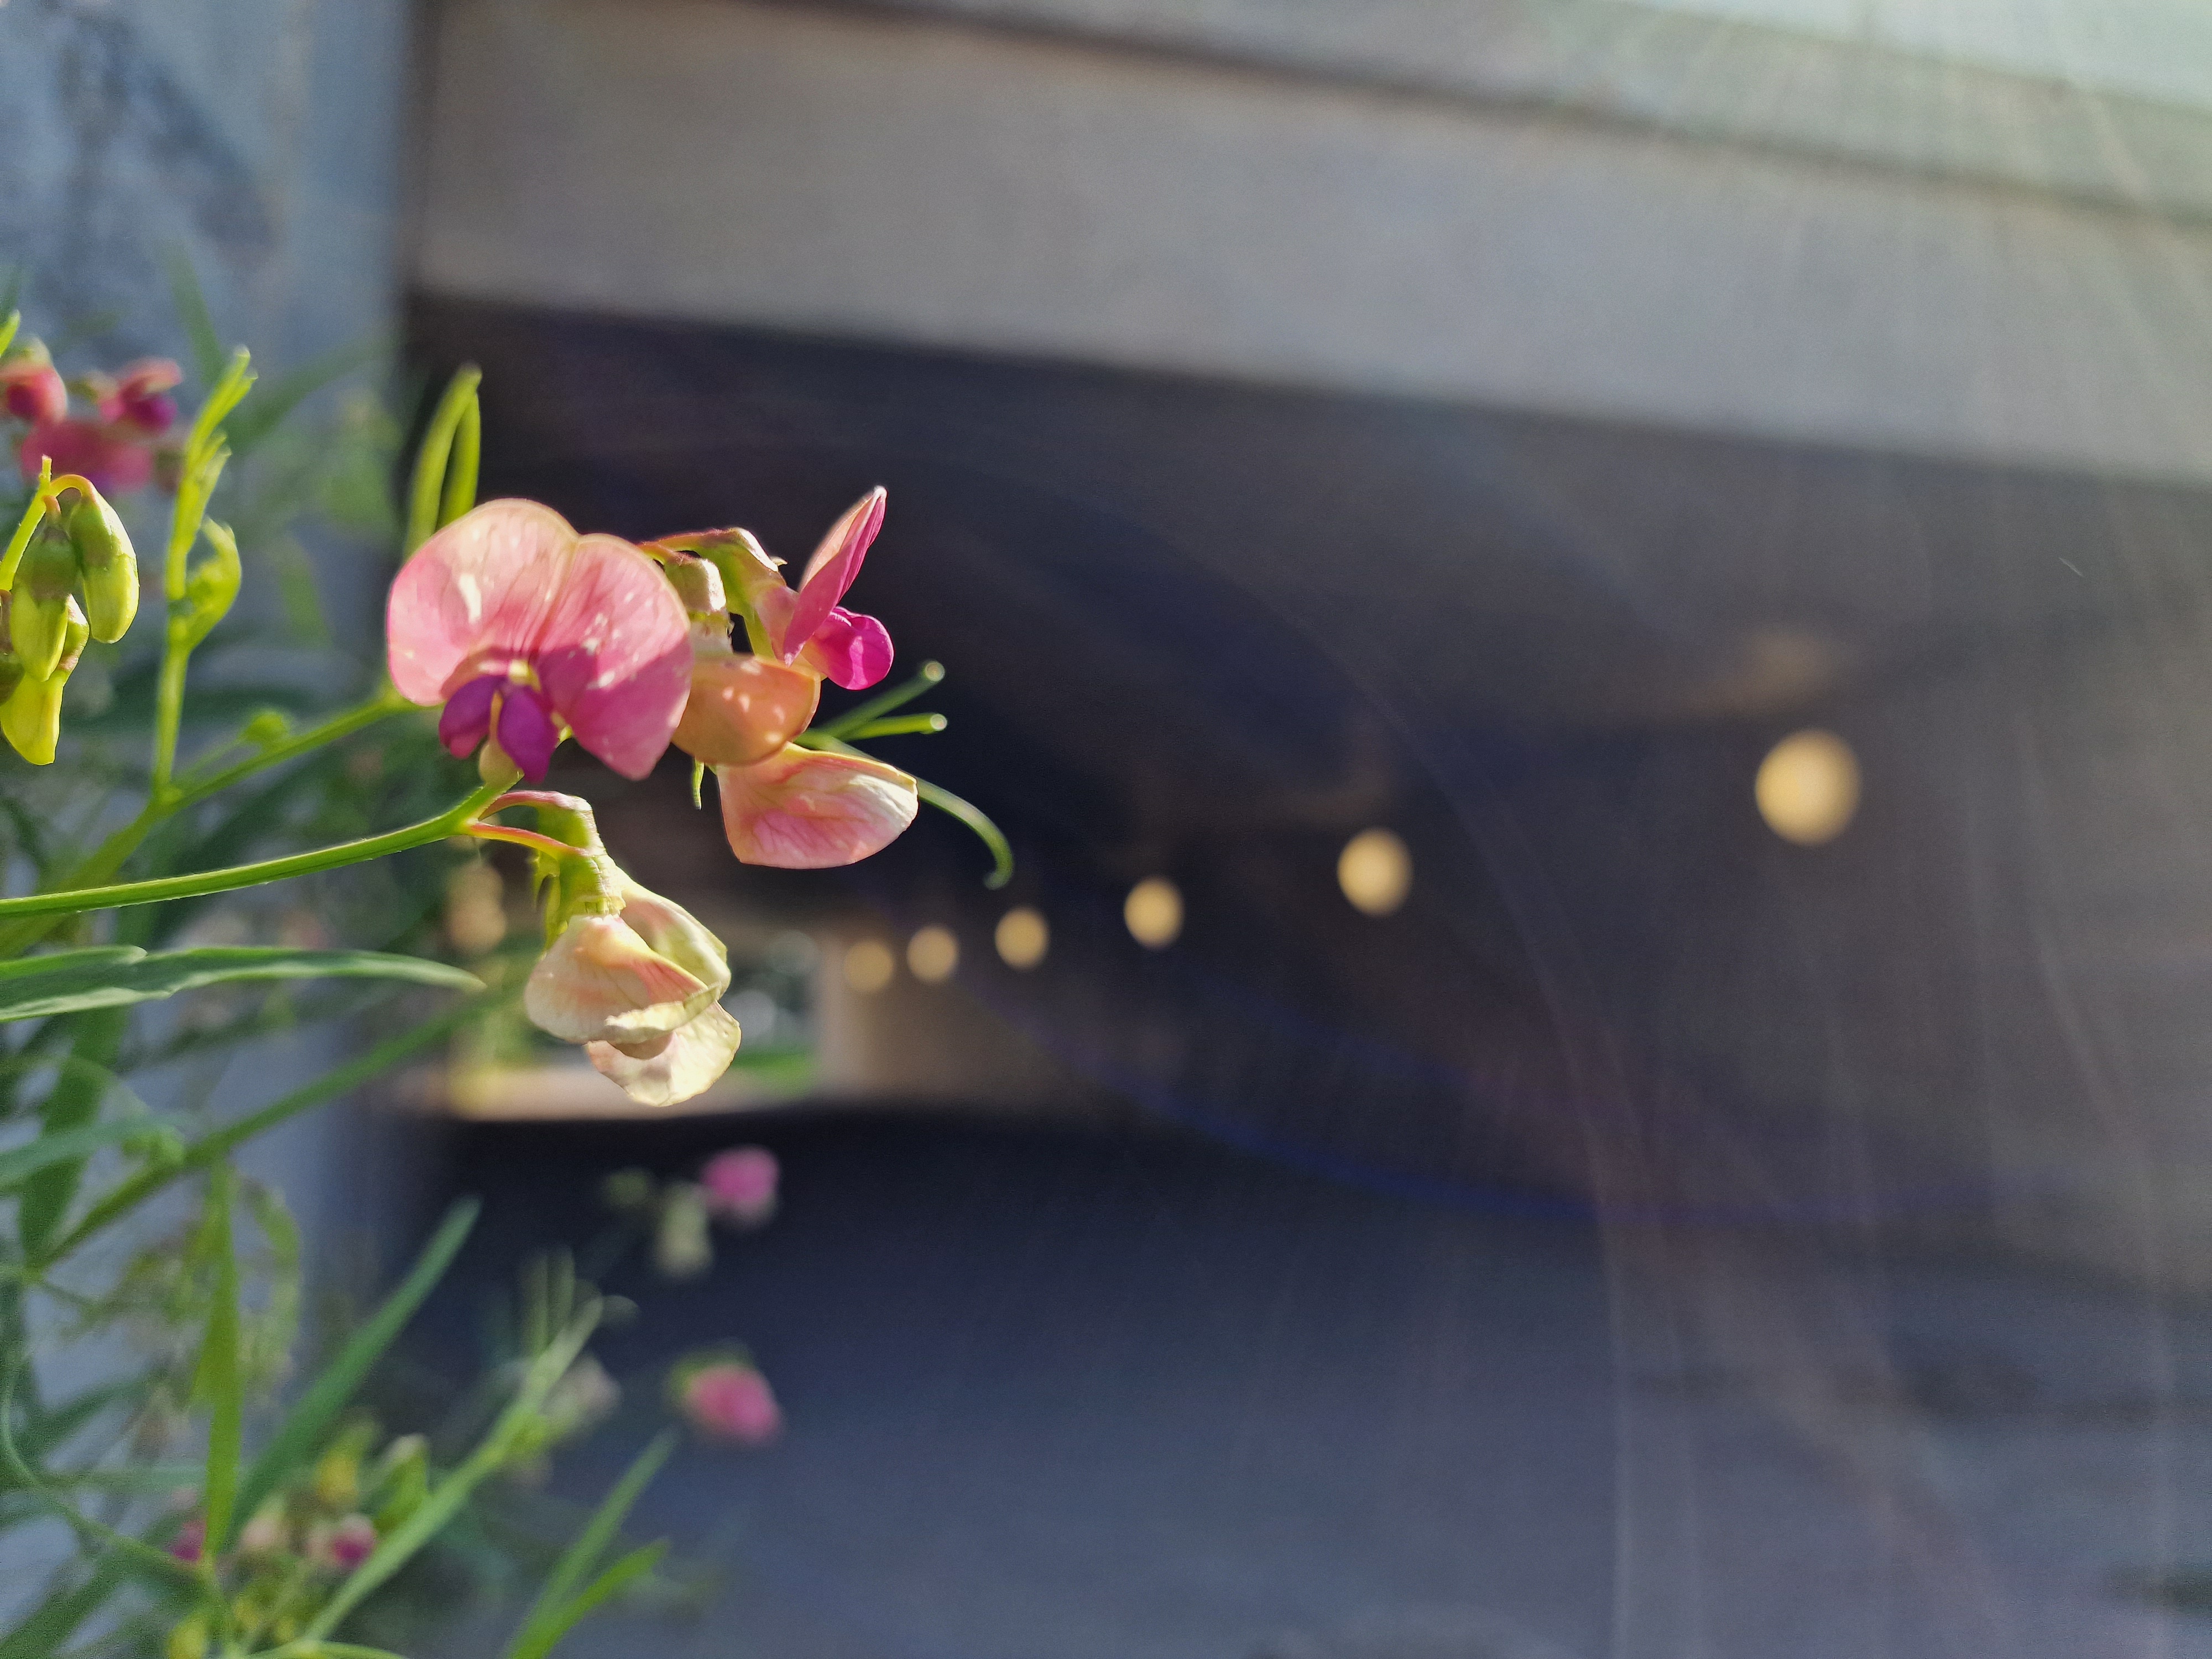
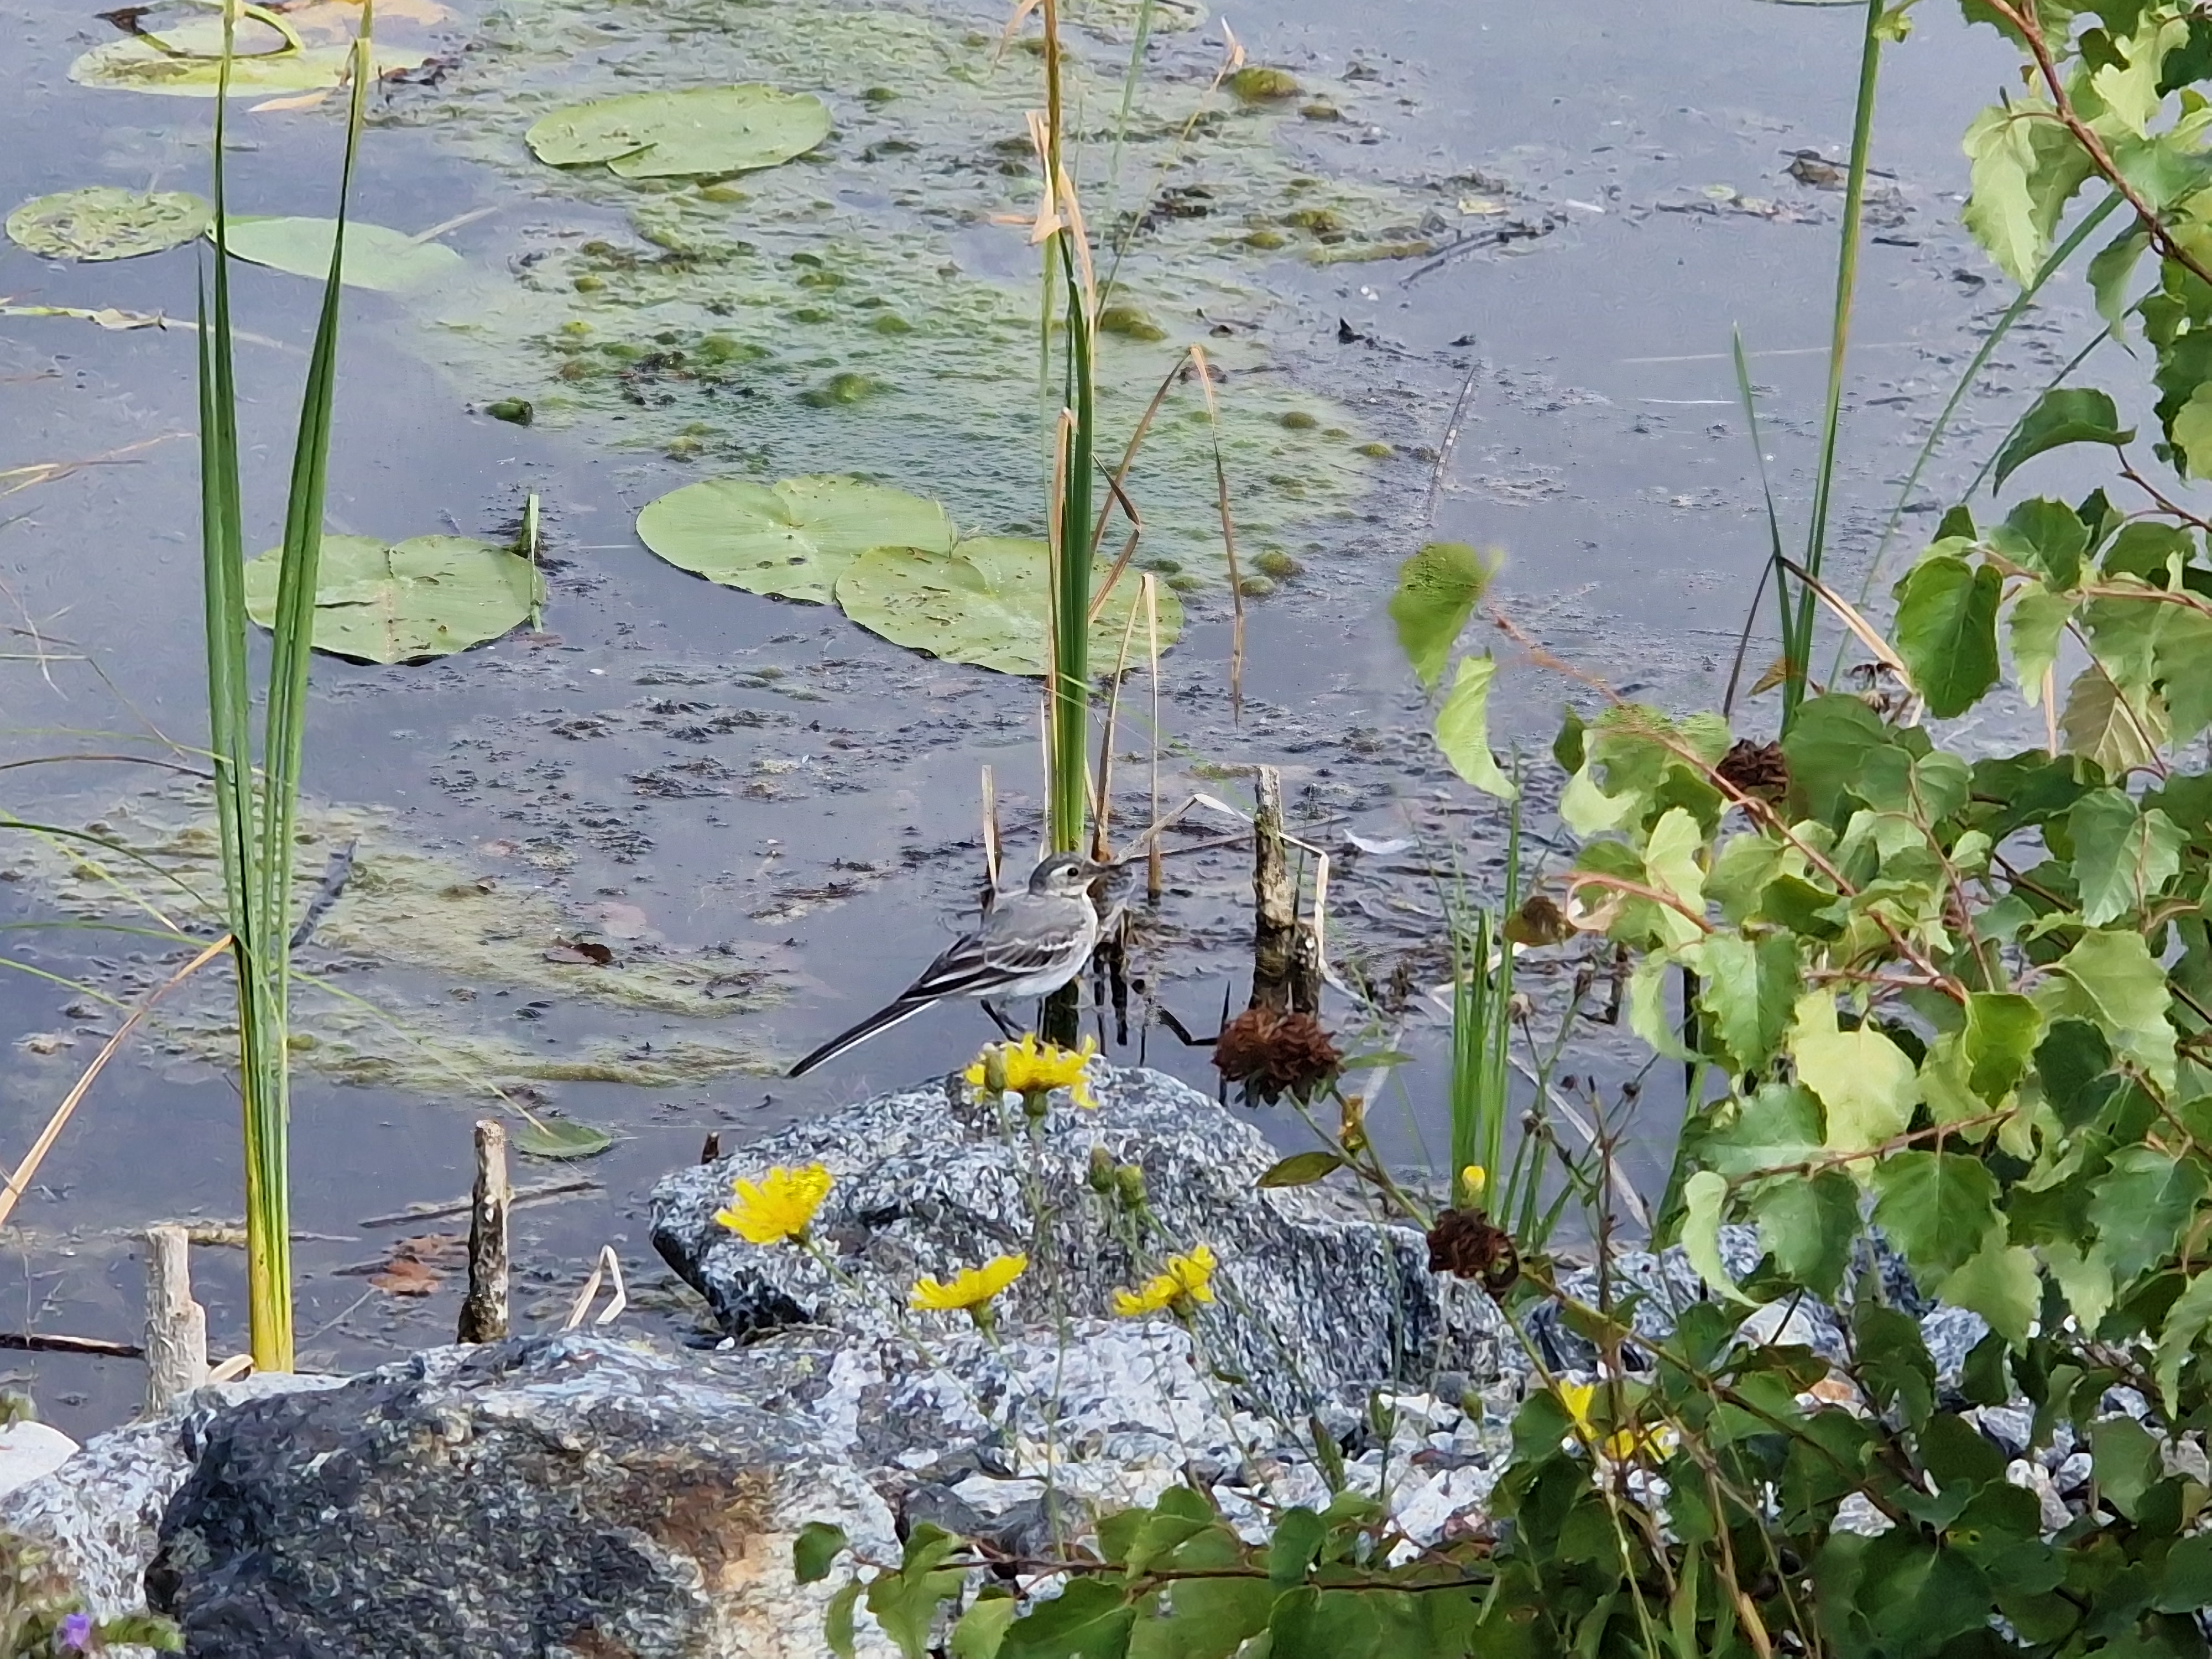
Third row: flowers on the airport concrete, a wagtail and Lythrum salicaria at the lake side.
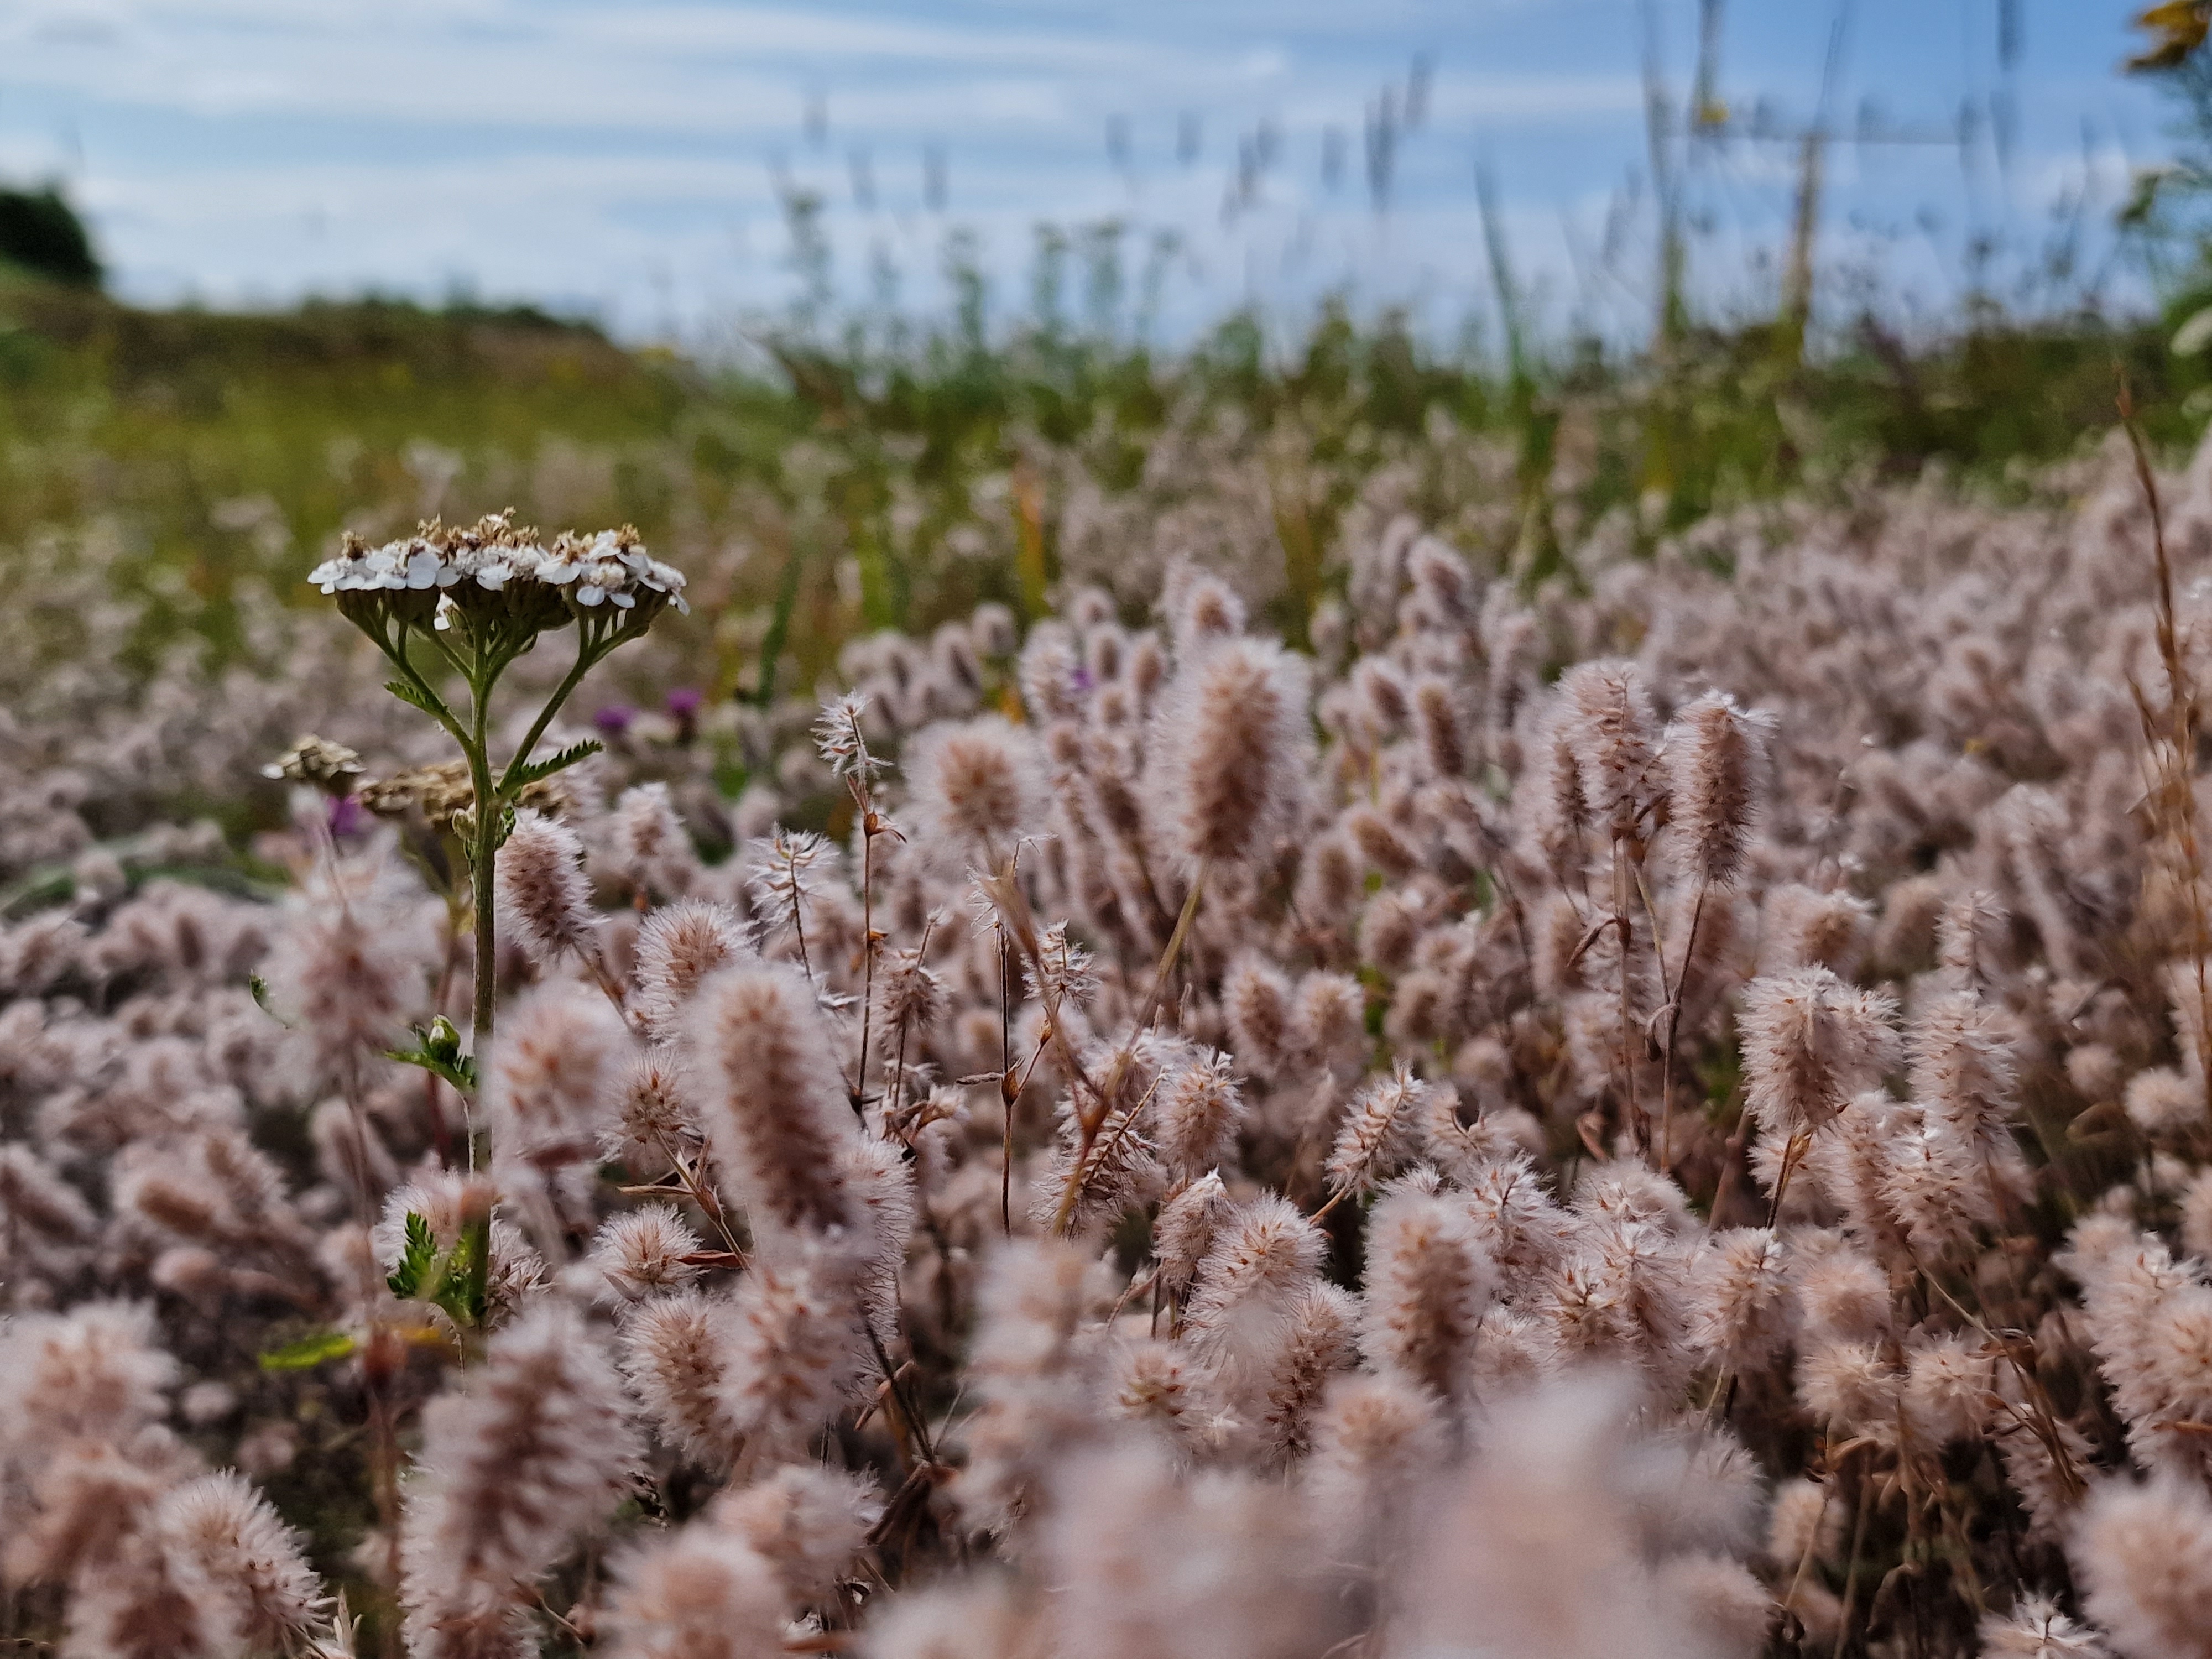
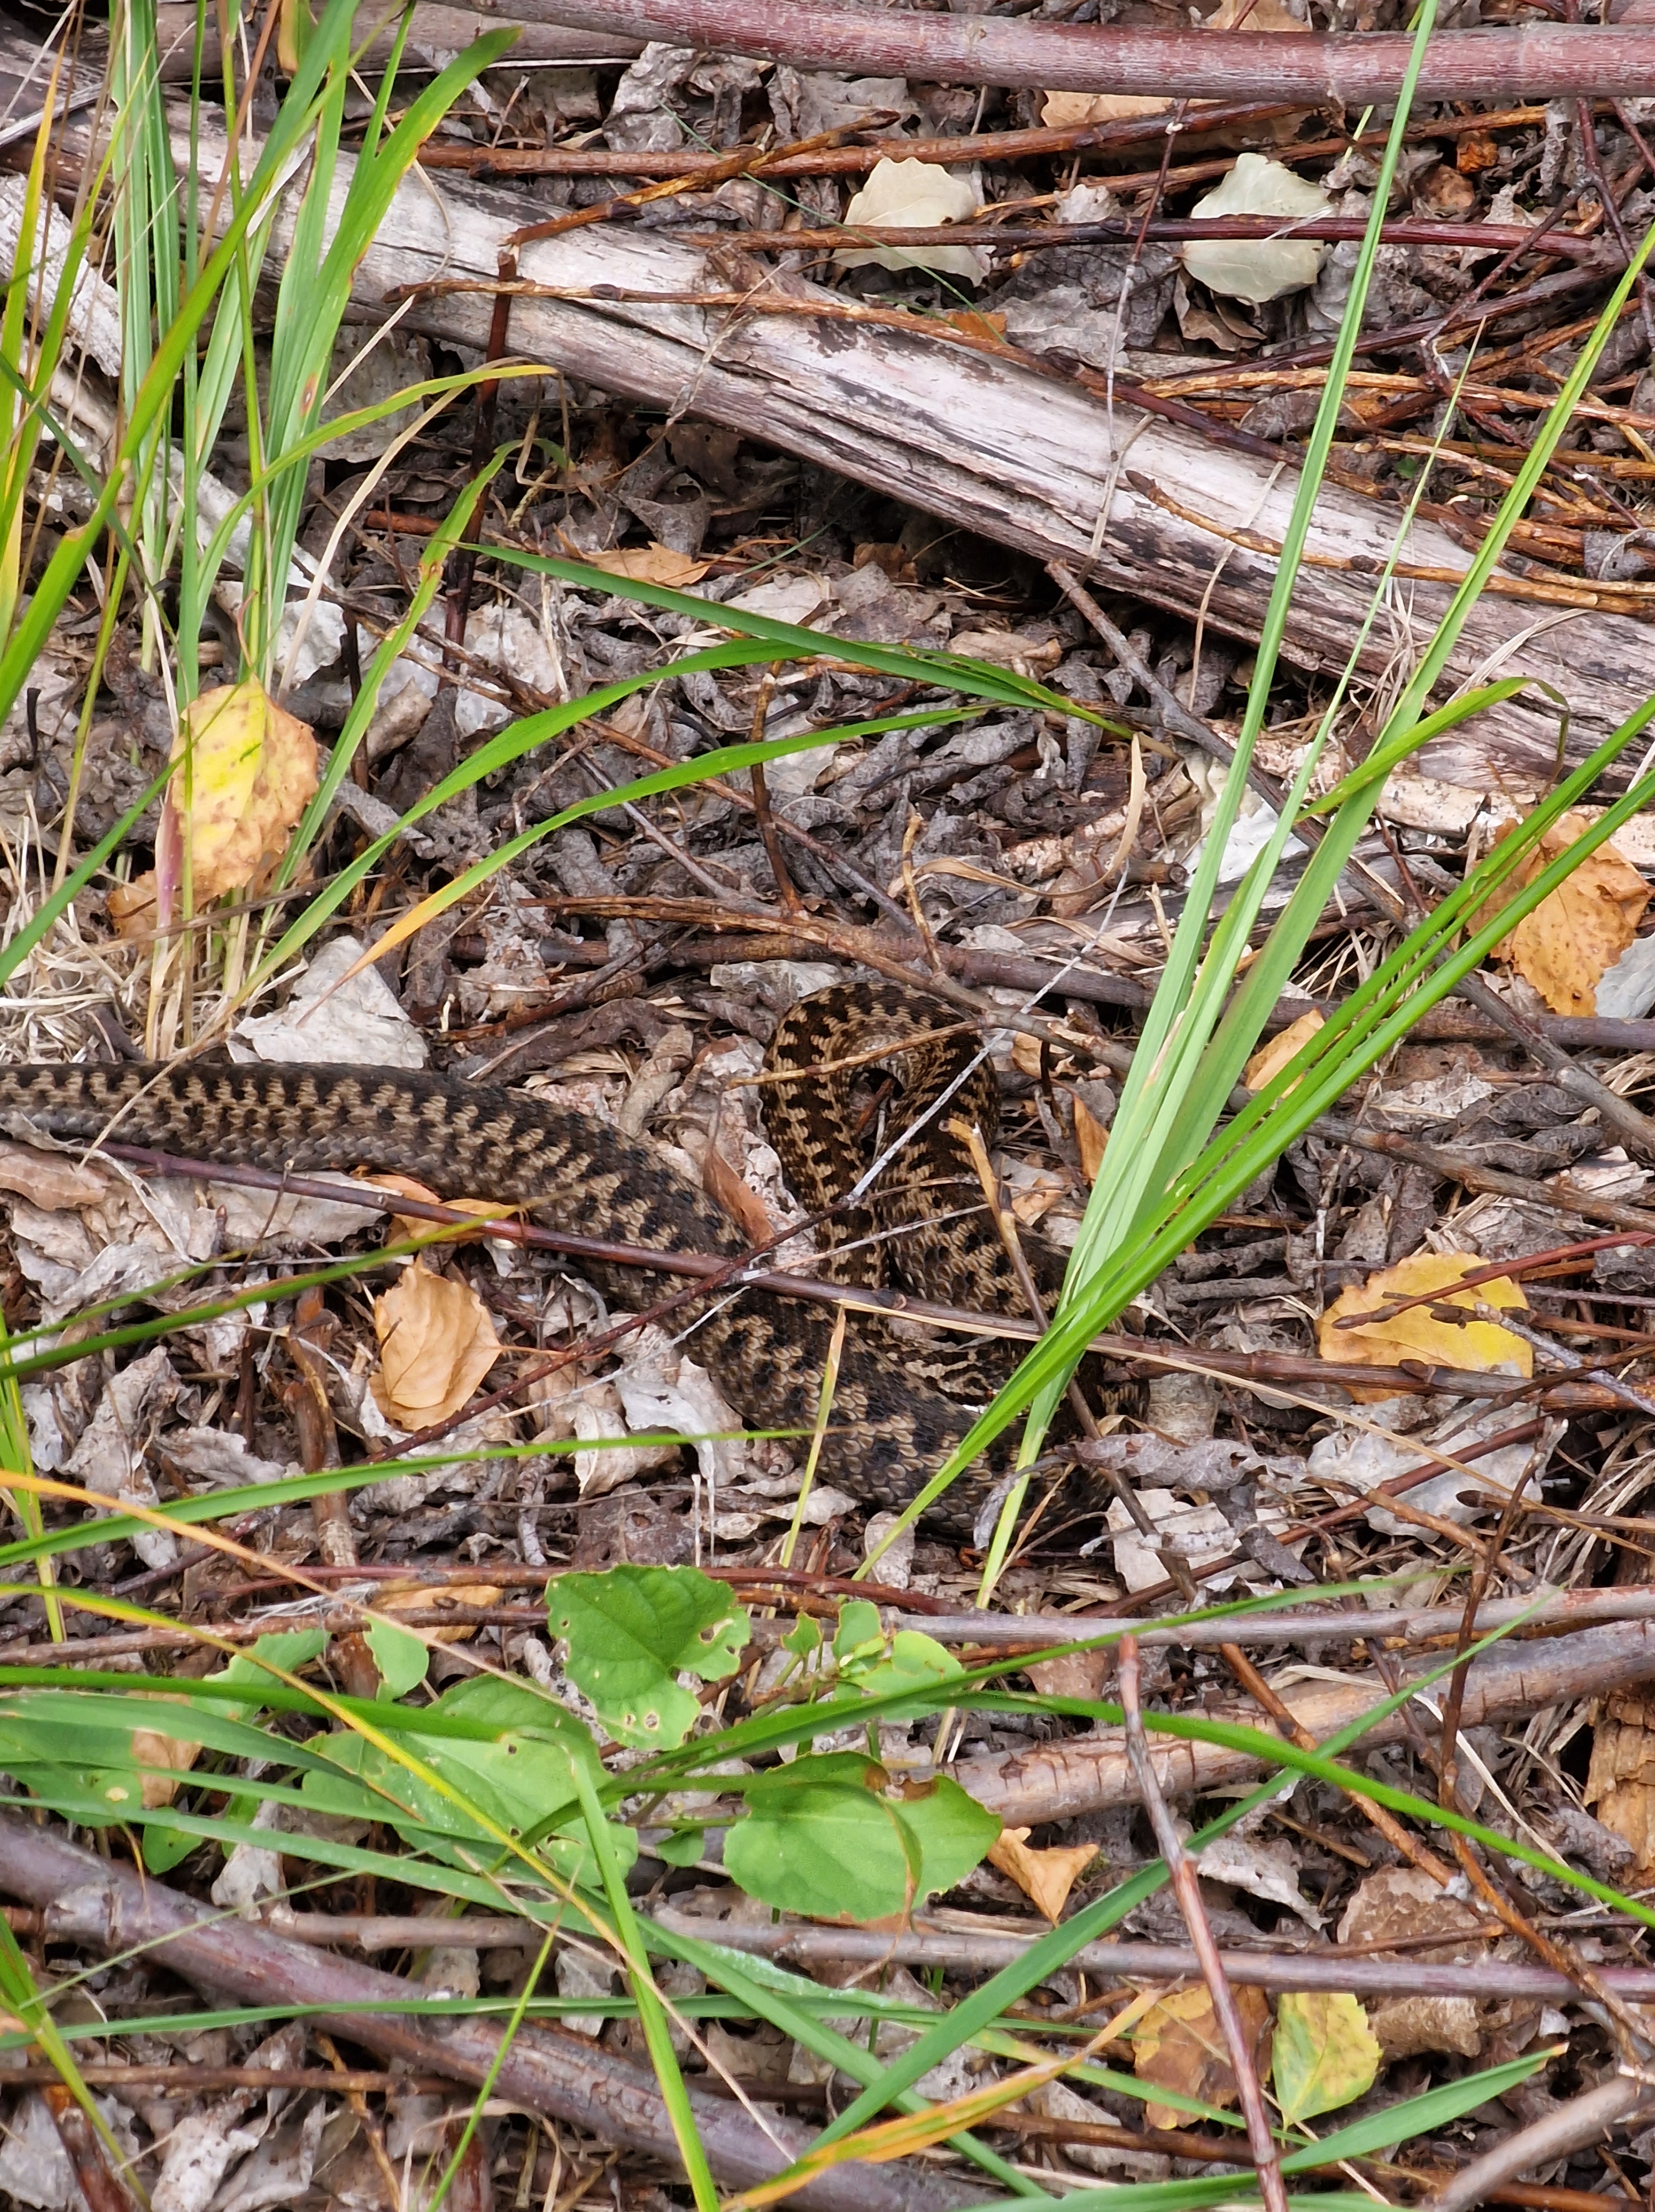
Bottom row: very fluffy fields of Trifolium arvense, more Swedish heathland, and the cherry on top: an adder!
Those who know me are likely well aware of my interest in species distribution models (SDMs). In particular, I’ve been focused for years on how we can enhance these models using higher-resolution data, such as microclimate information or anthropogenic disturbance.
This queeste for increasing SDM-resolution, however, has to overcome a few highly important data-related issues that can’t be fixed by simply increasing the resolution of the maps used as explanatory variables. In a review published just now in Ecography, we discuss these and related issue: sample size, positional uncertainty and sampling bias. Indeed, one can have microclimate data with as high of a resolution as possible, if your species data is suffering from one of these three issues, you can’t get the performance of your model anywhere close to what you might have been hoping for.
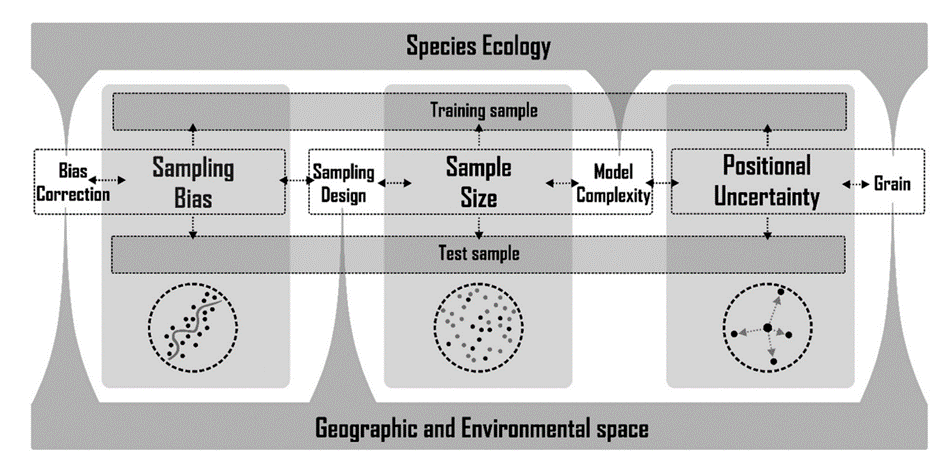
Sampling bias, sample size and positional uncertainty – the three characteristics of the looming ghost of data quality that might affect the performance of your SDMs. All three of them are affected by species ecology and the environment.
Positional uncertainty
Case in point: positional uncertainty. When building SDMs, we often think about our species observations as points on the map. Often they are not, however; they are more like smudges. Depending on the data, the observational errors can range from just a few meters (e.g., GPS inaccuracies) up to a kilometer (e.g., aggregated data from global databases) or even more (e.g., historical data with poor location information such as some herbaria). Failing to take into account that uncertainty (i.e., working with the falsely comforting points rather than the smears on your map) could affect the apparent correlations between species observation and environmental data. The size and importance of this error also varies between species. For example, for mobile species it is often much harder to pinpoint an exact location, while deep-sea organisms are often located using less-accurate acoustic positioning.
Three categories of factors driving positional uncertainty: the resolution and configuration of the spatial predictors (e.g., micro- versus macroclimate data – see the paper for more details), recording techniques and data processing (e.g., GPS accuracy) and species ecology and site characteristics (e.g., a lower accuracy for big animals, limited GPS accuracy under forest canopies or in cities)
Sampling bias
A similar issue exists with sampling bias. Often enough, we feel reassured by big numbers, with models built using thousands of points looking soothingly trustworthy. Here again, however, these numbers could create false confidence.
Species observations often have strong spatial bias, with many points located close to each other, and big gaps in between. Typically, positive sampling biases have been reported towards easily accessible areas (e.g. proximity to roads, rivers, and urban settlements), protected areas, more populated areas, and charismatic species, leading to spatial and taxonomic biases. Uneven data-sharing practices make this issue even worse. These issues are not only present when using citizen science data, but at a larger scale also when using data collected by researchers, who are similarly biased towards certain locations that are more reachable, more interesting, or more likely to attract funding.
Clear recommendations
Importantly, our review goes beyond a simple discussion of these problems with our SDM-data. We made a point of creating clear, hands-on suggestions on how to deal with these issues, every step along the way. These suggestions are summarized in the figure below.
With that, we hope this review can become a helpful guide for anyone working in the amazing but treacherous world of species distribution modelling. With our review in hand, the data should not play further unexpected tricks on you!
Read the whole review and its recommendations here in Ecography.
The series of papers known as ‘Geron et al.’ has a new addition, marking the final piece of Charly Geron’s PhD trajectory studying the link between urban plant invaders and urban microclimates.
In his earlier chapters, we already demonstrated that urban invaders often originate from warmer and drier native regions, probably benefiting from the warmer urban temperatures due to the urban heat island effects. We found that these species nevertheless prefer shaded environments, which protect them during urban heatwaves. We also explored the traits, phenology and genetics that contribute to these behaviors.
In the latest article by Geron et al. published in Oecologia, we delve deeper into the latter pressing question: do non-native plant species adapt to urban environments? We focused on the delicate little (but make no mistake, this species native to the north Caucasus and Iran can be a real crop pest) flower Veronica persica (bird’s-eye speedwell) as our model species, conducting a combination of field (or better – urban road verges and wastelands) surveys and a ‘common garden’ experiment.
What we were after was straightforward to articulate, but – sorry – bloody difficult to test: was there a difference in the development and performance of Veronica persica between urban and rural settings, and, if differences exist, could they be attributed to either adaptation, mother plant influence or simple plasticity? if plants from urban origin showed a higher reproduction in urban microclimate, it might be the sign of adaptation to urban environments. If not, it could suggest that Veronica persica is highly plastic, resulting in variations in its development following local conditions but not due to genetic changes.
Our findings highlighted the latter scenario. Veronica persica exhibited significant phenotypic plasticity across all measured traits, with reduced germination, growth, and flowering under urban conditions. This suggests significant setbacks to plant success in the more stressful growing conditions of a warmer urban microclimate.
Interestingly, we found no significant differences in how well urban versus rural plants coped with these conditions, indicating a lack of local adaptation. However, we observed notable genetic differences at the population level, influenced by the identity of the mother plant, suggesting genetic diversity among populations.
Strong phenotypic plasticity between rural and urban microclimates, with lower germination, longer germination delay, (substantially!) fewer flowers and longer flower delay in urban microclimates. No sign, however of local adaptation (red lines = urban origin, blue lines = rural origin, yet both colors are simply scattered randomly).
Does this mean that non-native plant species cannot adapt to urban environments? Certainly not. It’s important not to generalize based on a single species. Our findings did align surprisingly well with previous research on Matricaria discoidea (pineapple weed), however, which also demonstrated strong phenotypic plasticity and maternal effects, but no clear local adaptation.
Two is not yet a crowd, yet they do show clearly that detecting subtle local adaptation amidst the variability introduced by phenotypic plasticity is challenging, especially in highly adaptable ruderal non-native species.
We can only end – as so often necessary – with a call for further research. Urban environments are warming rapidly, and the urban environment creates unique ecosystems. Understanding how both non-native and native species may or may not adapt to these conditions is crucial for protecting future biodiversity.
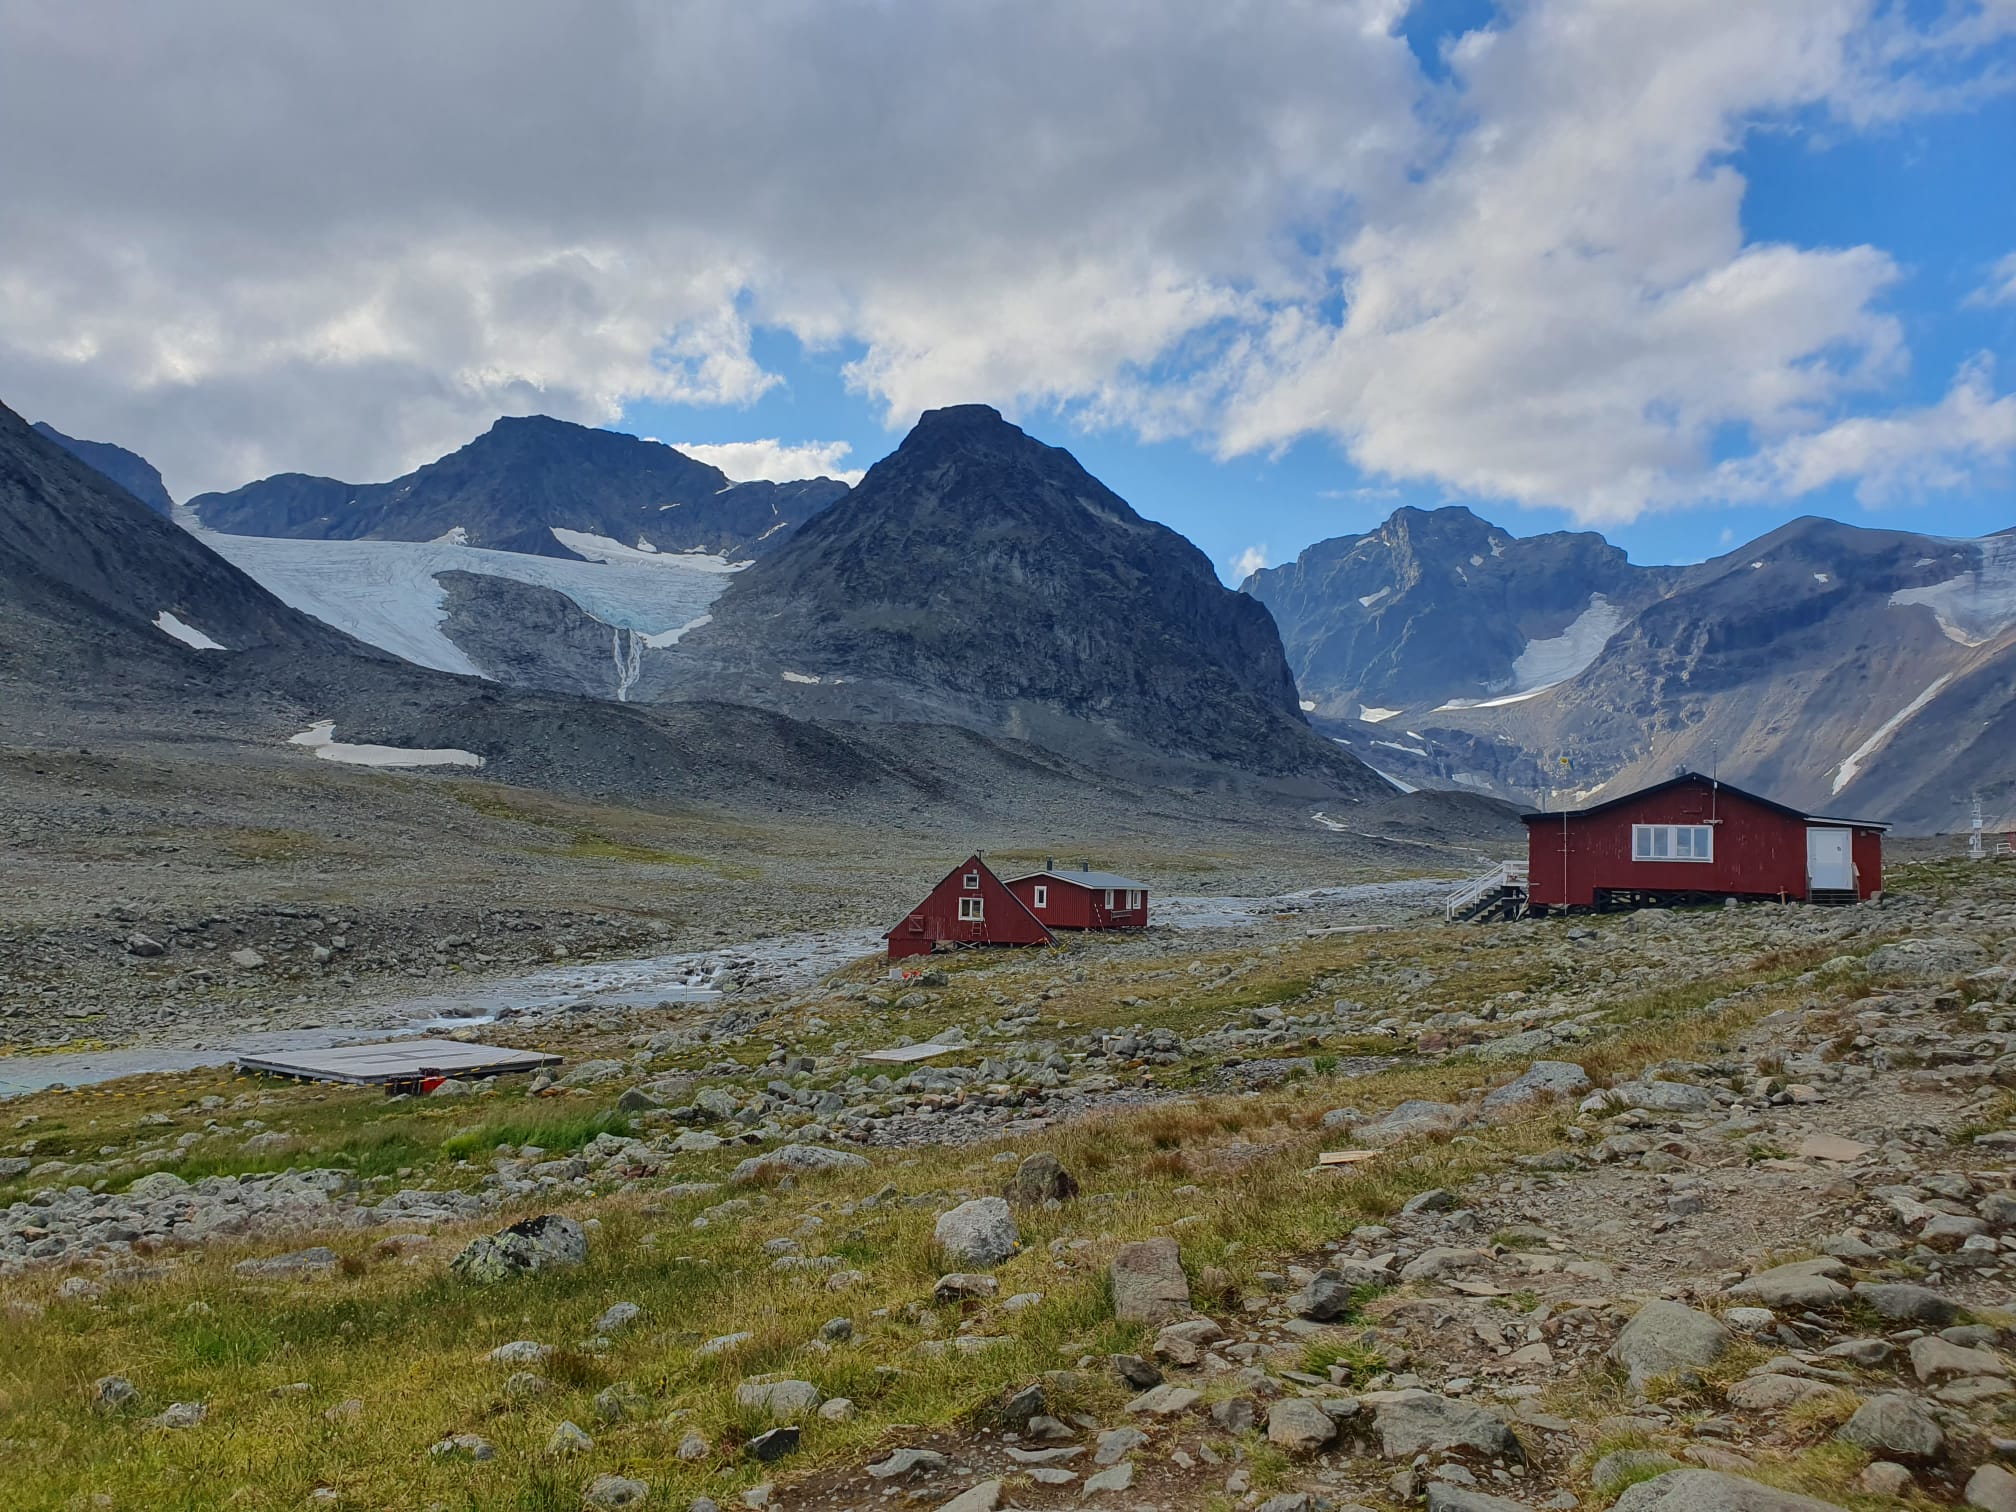
The Tarfala research station, with some of its beloved glaciers in the background
While a lot is going on in and around Abisko, as can be seen in yesterday’s story, part of the team has ventured further south, to the perhaps even more beautiful moonscape of Tarfala.
Here, a rugged mountain cabin hosts the research team studying some of Sweden’s tallest mountains and biggest glaciers.
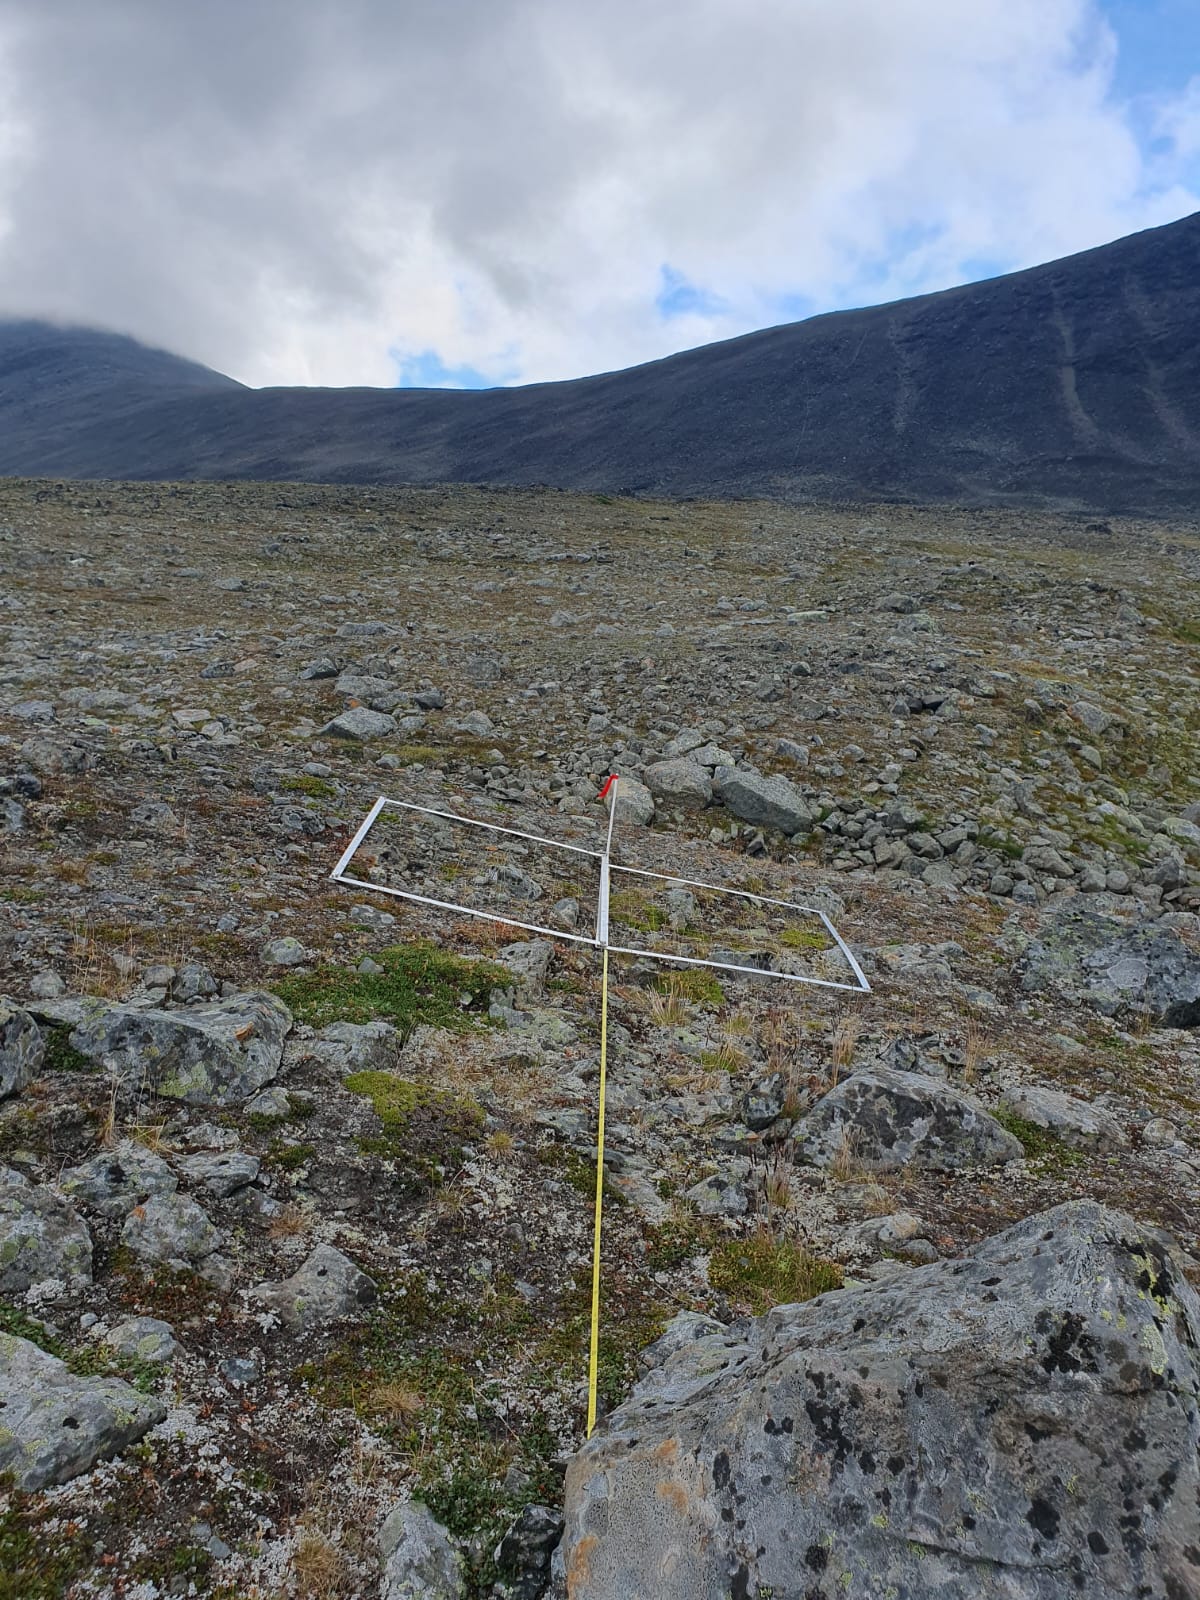
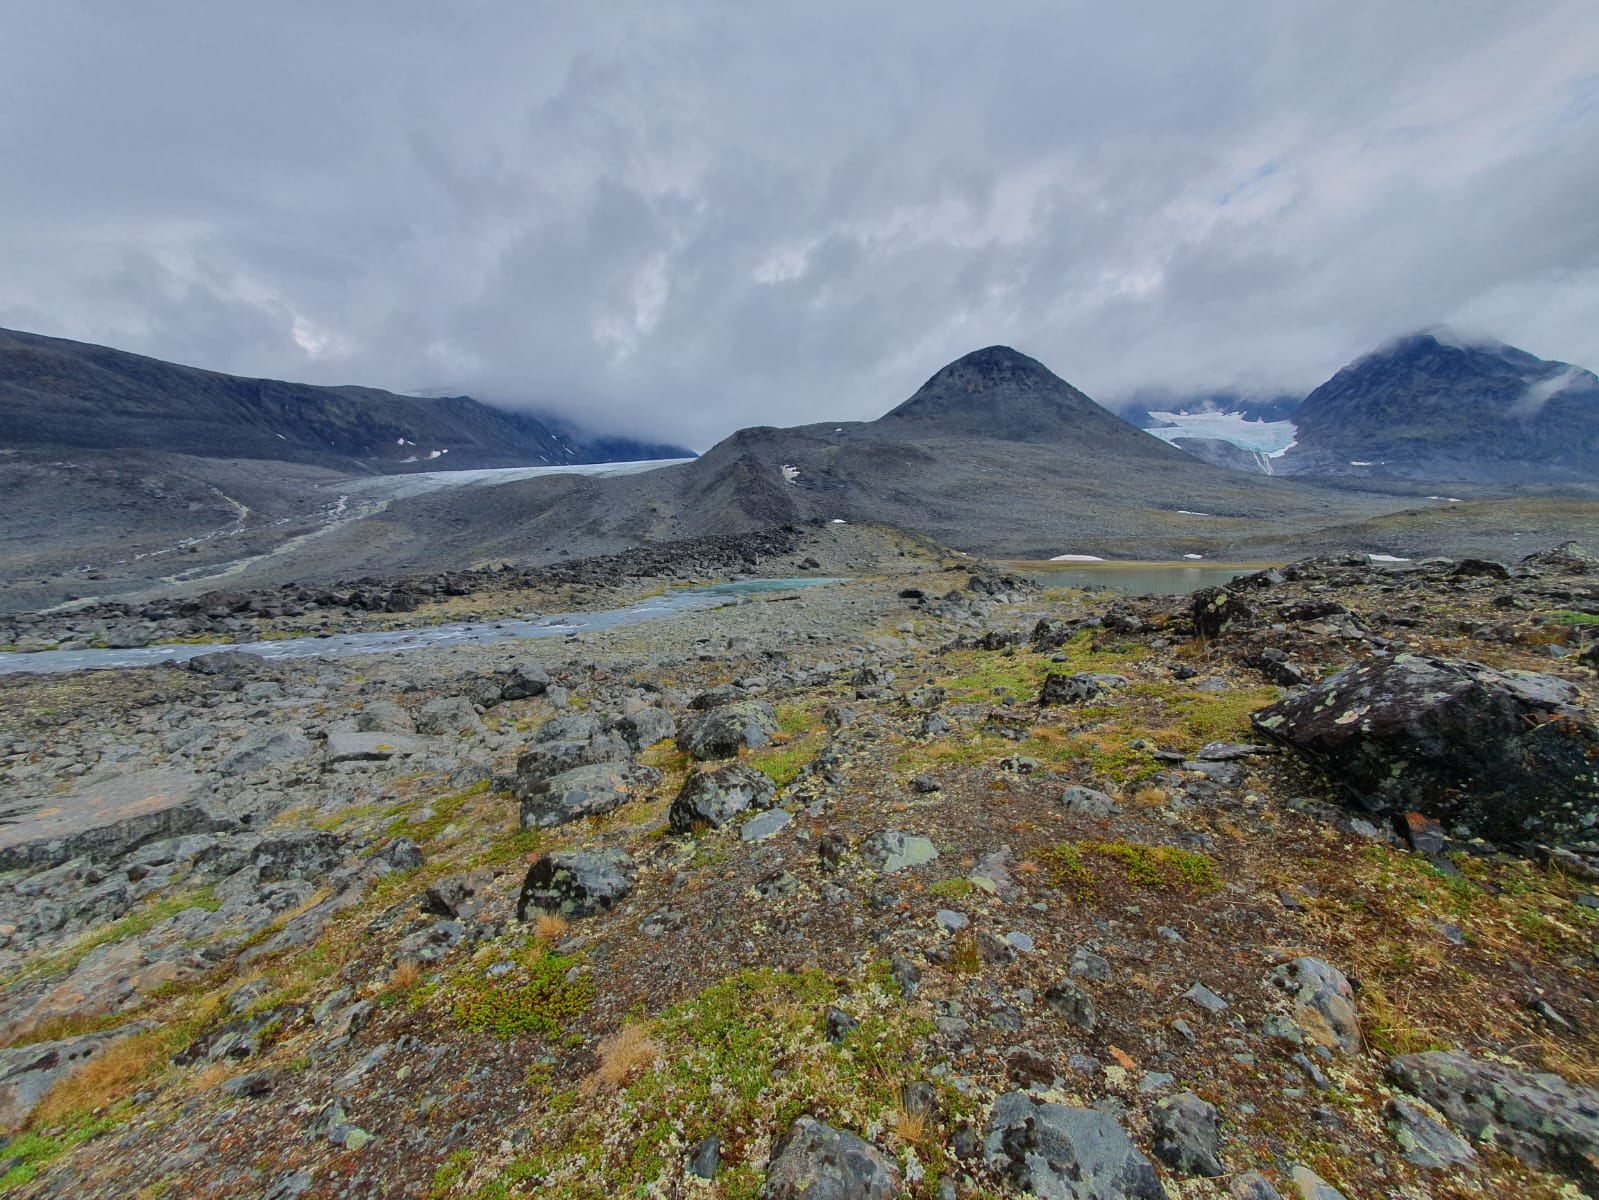
For us, it is the vegetation in the glacier forefield that we care about: can we reconstruct the monitoring transect from a set of historical surveys and reconstruct how the vegetation has changed following the inevitable glacial retreat?
A helicopterflight or 24 km long hike away from the nearest road, Tarfala is clearly a notch more adventurous than the Abisko area!
The group has a whole team up north again, monitoring vegetation and bumblebees, gathering microclimate data and so much more.
I was lucky enough to spend a few days up there as well, checking up on the long-term monitoring sites on mount Nuolja, hiking to the top of our gradient in the beautiful valley of Laktatjakka, and checking out the extremely poor and acidic heathlands of the steep slopes of the Norwegian fjord of Rombak.
Next week, a final two days of fieldwork for me in a beautiful Norwegian valley, then it’ll be the awesome, interested and enthusiastic students and fieldwork crew holding the fortress till early September and autumn setting in again. Jealous, but happy it’ll be a great time with great science for them!
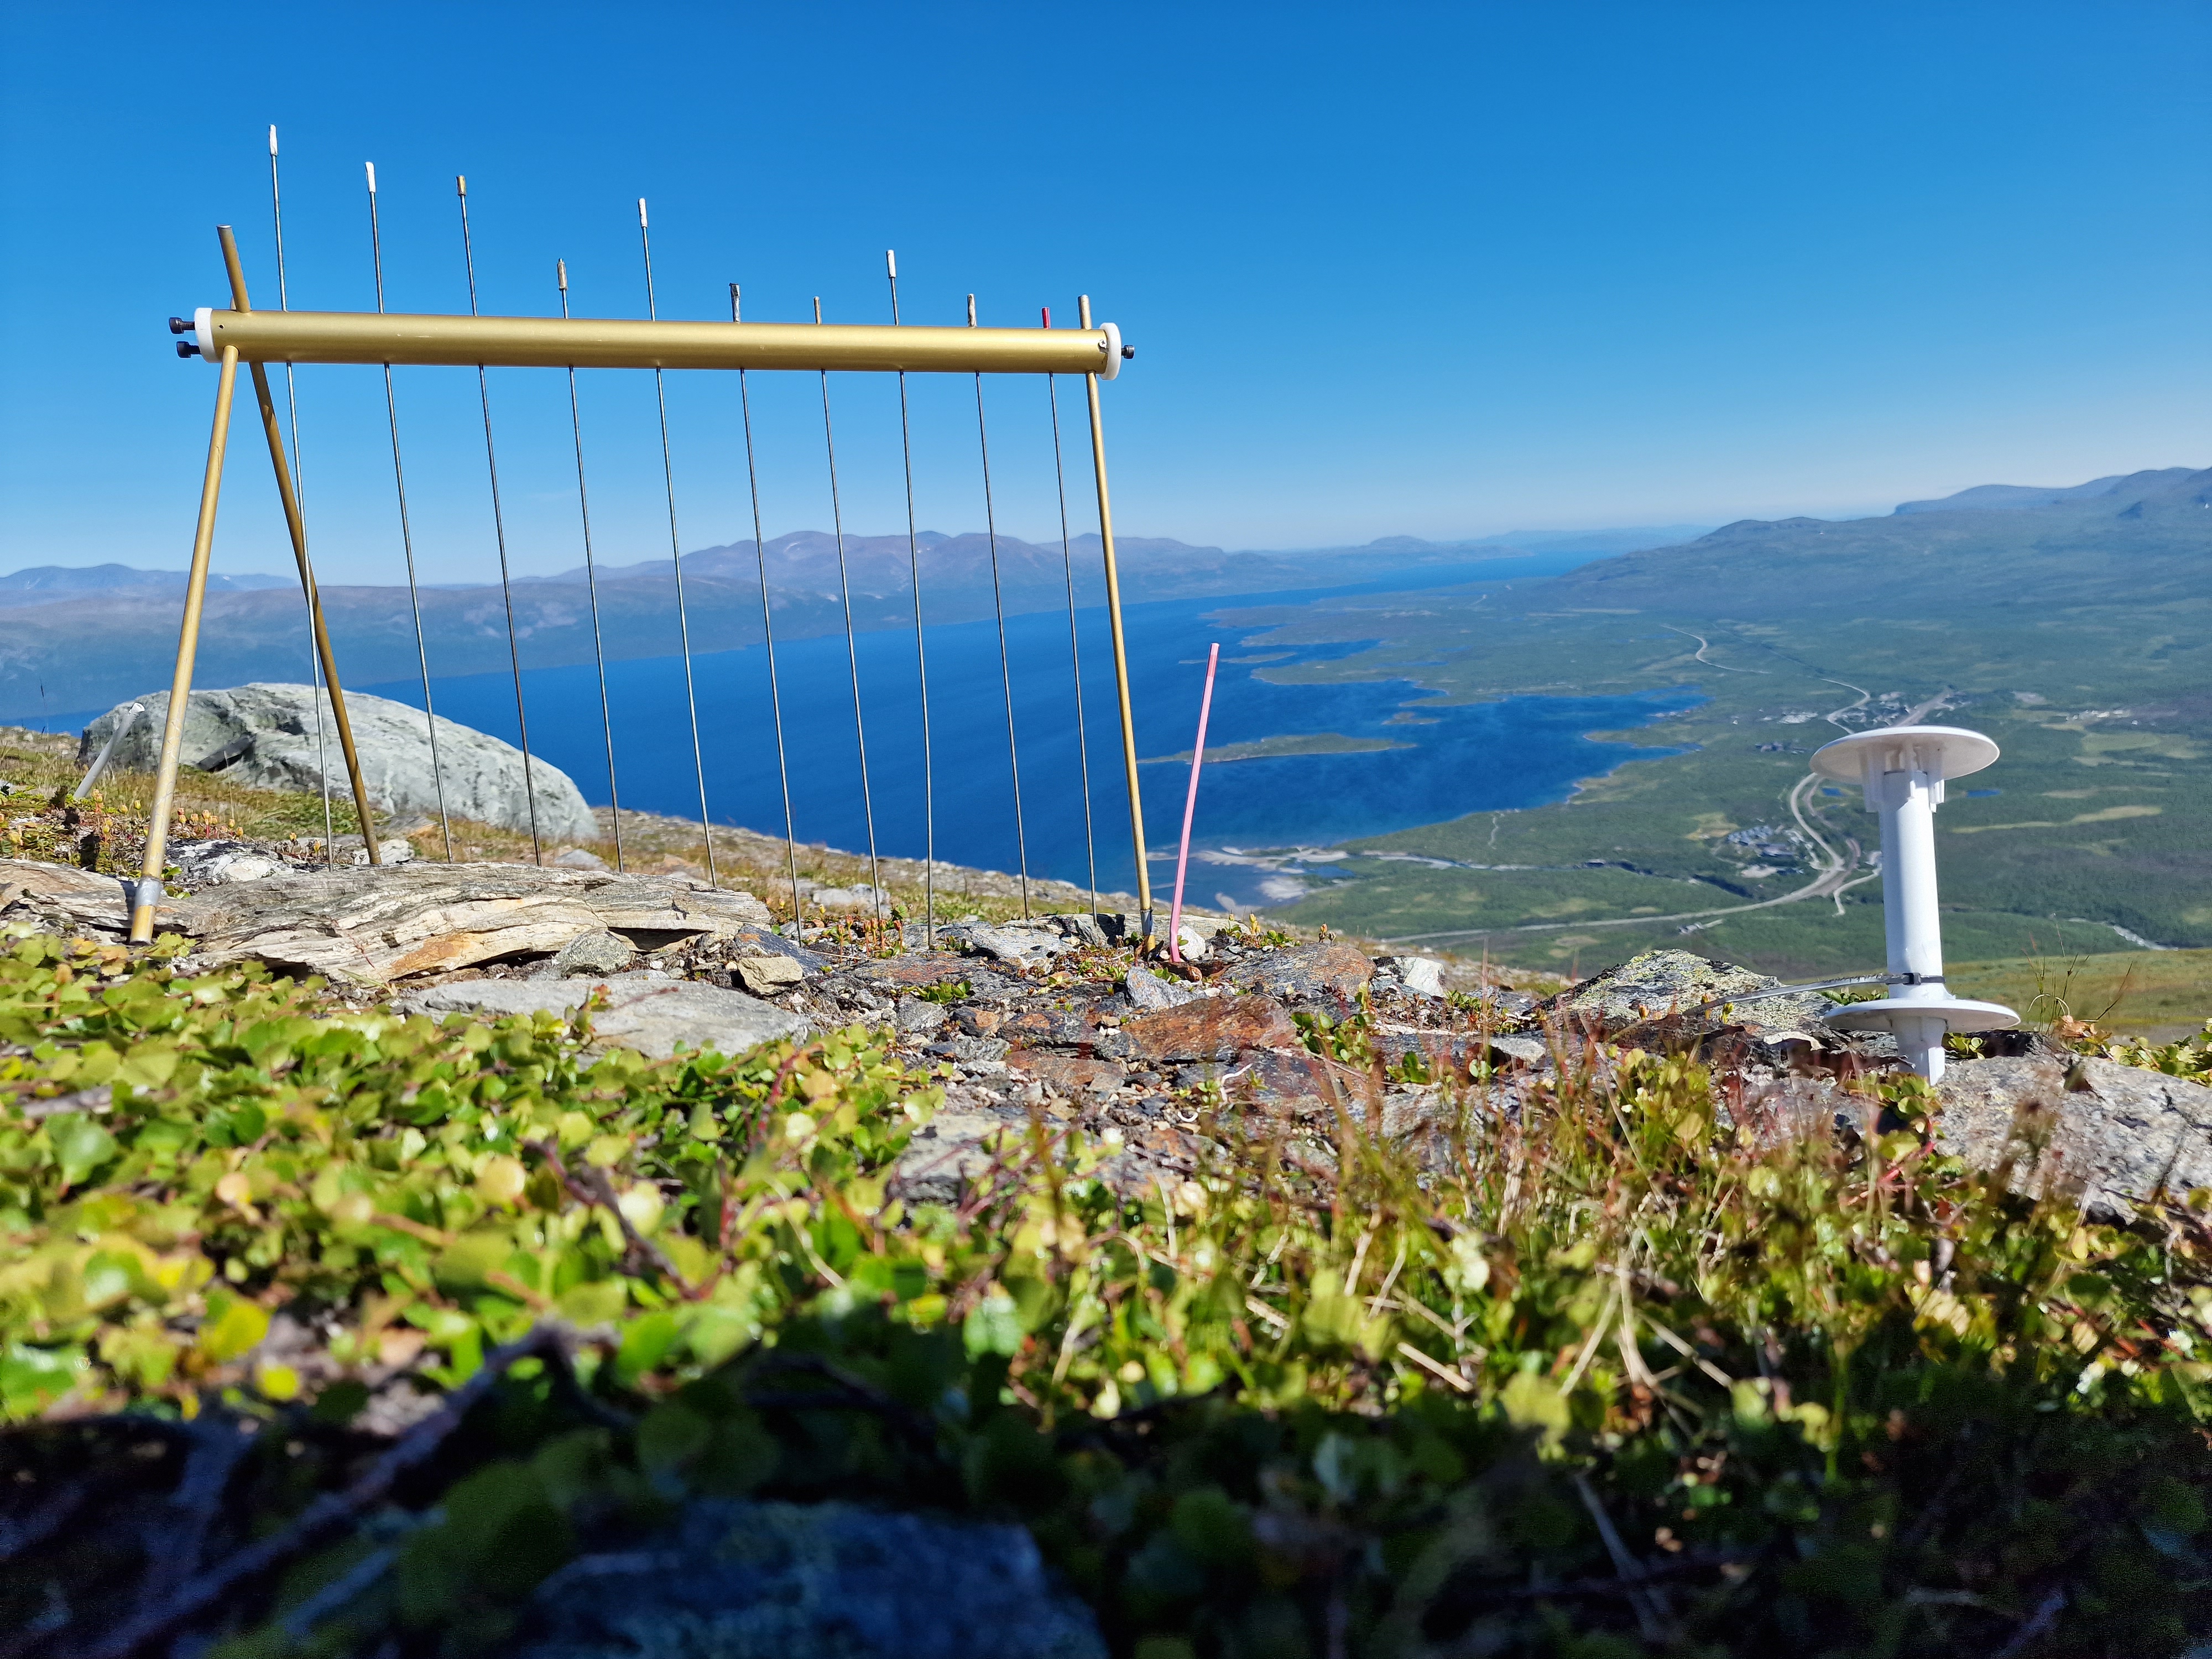
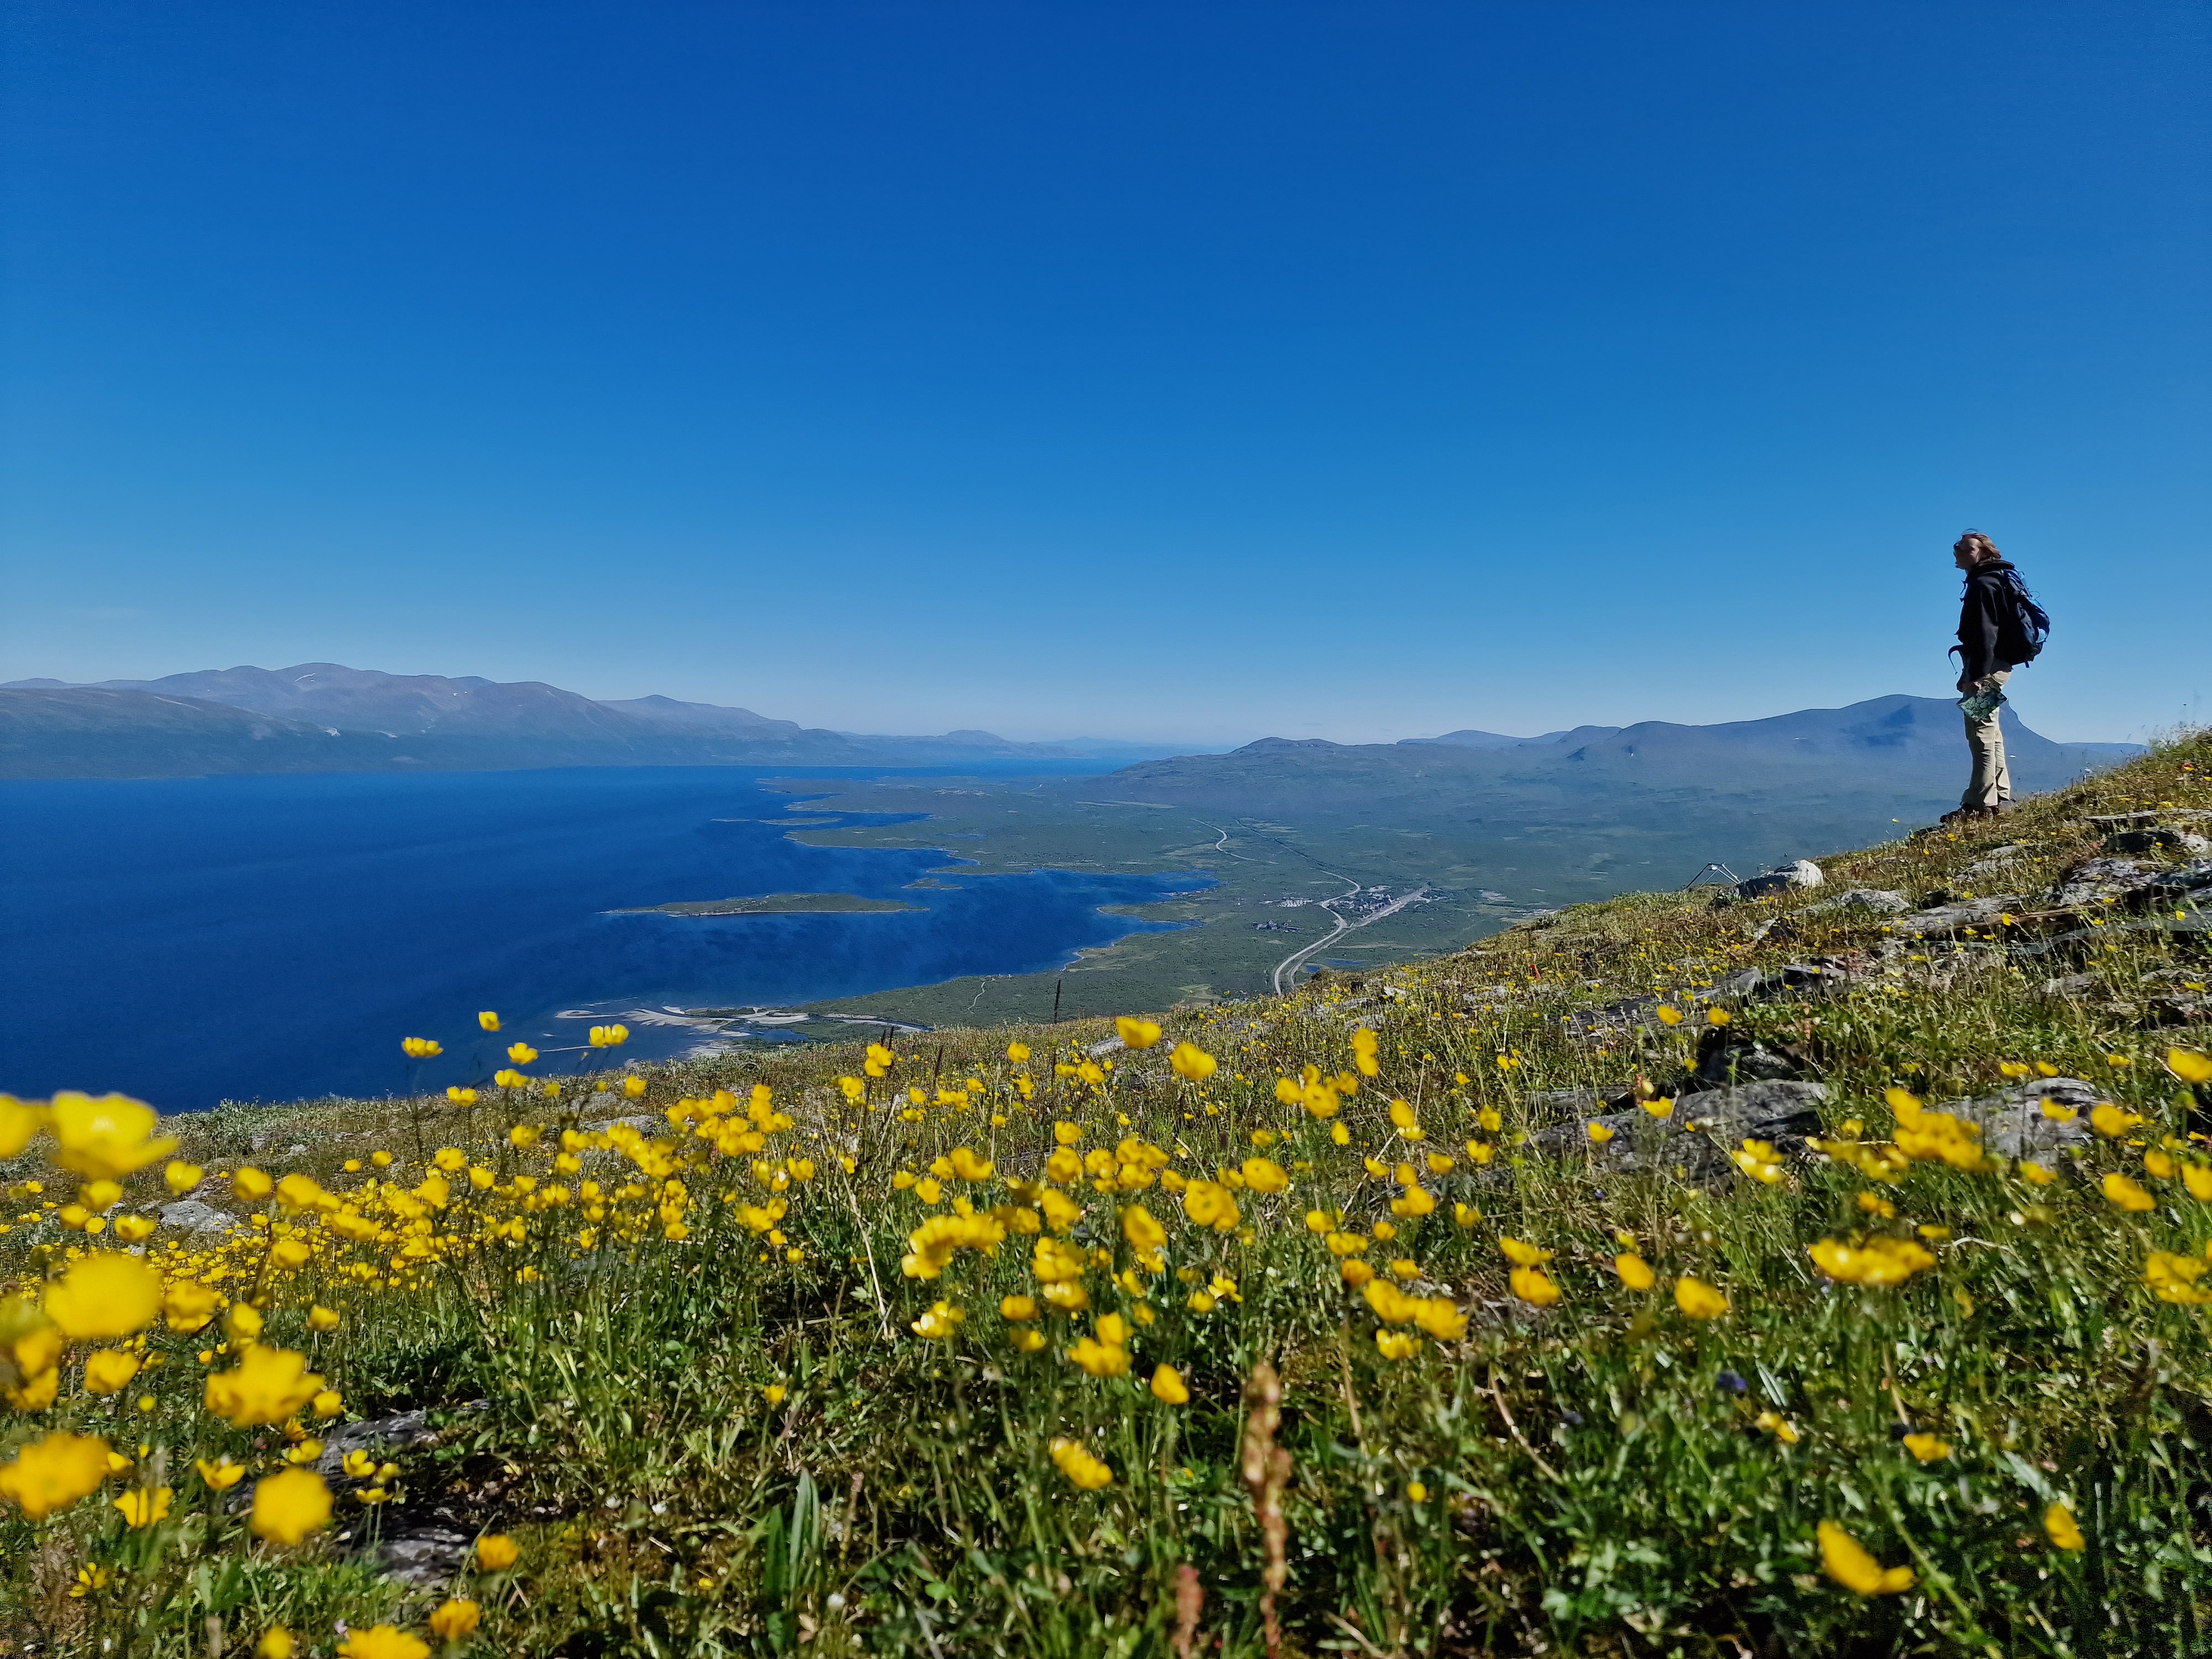
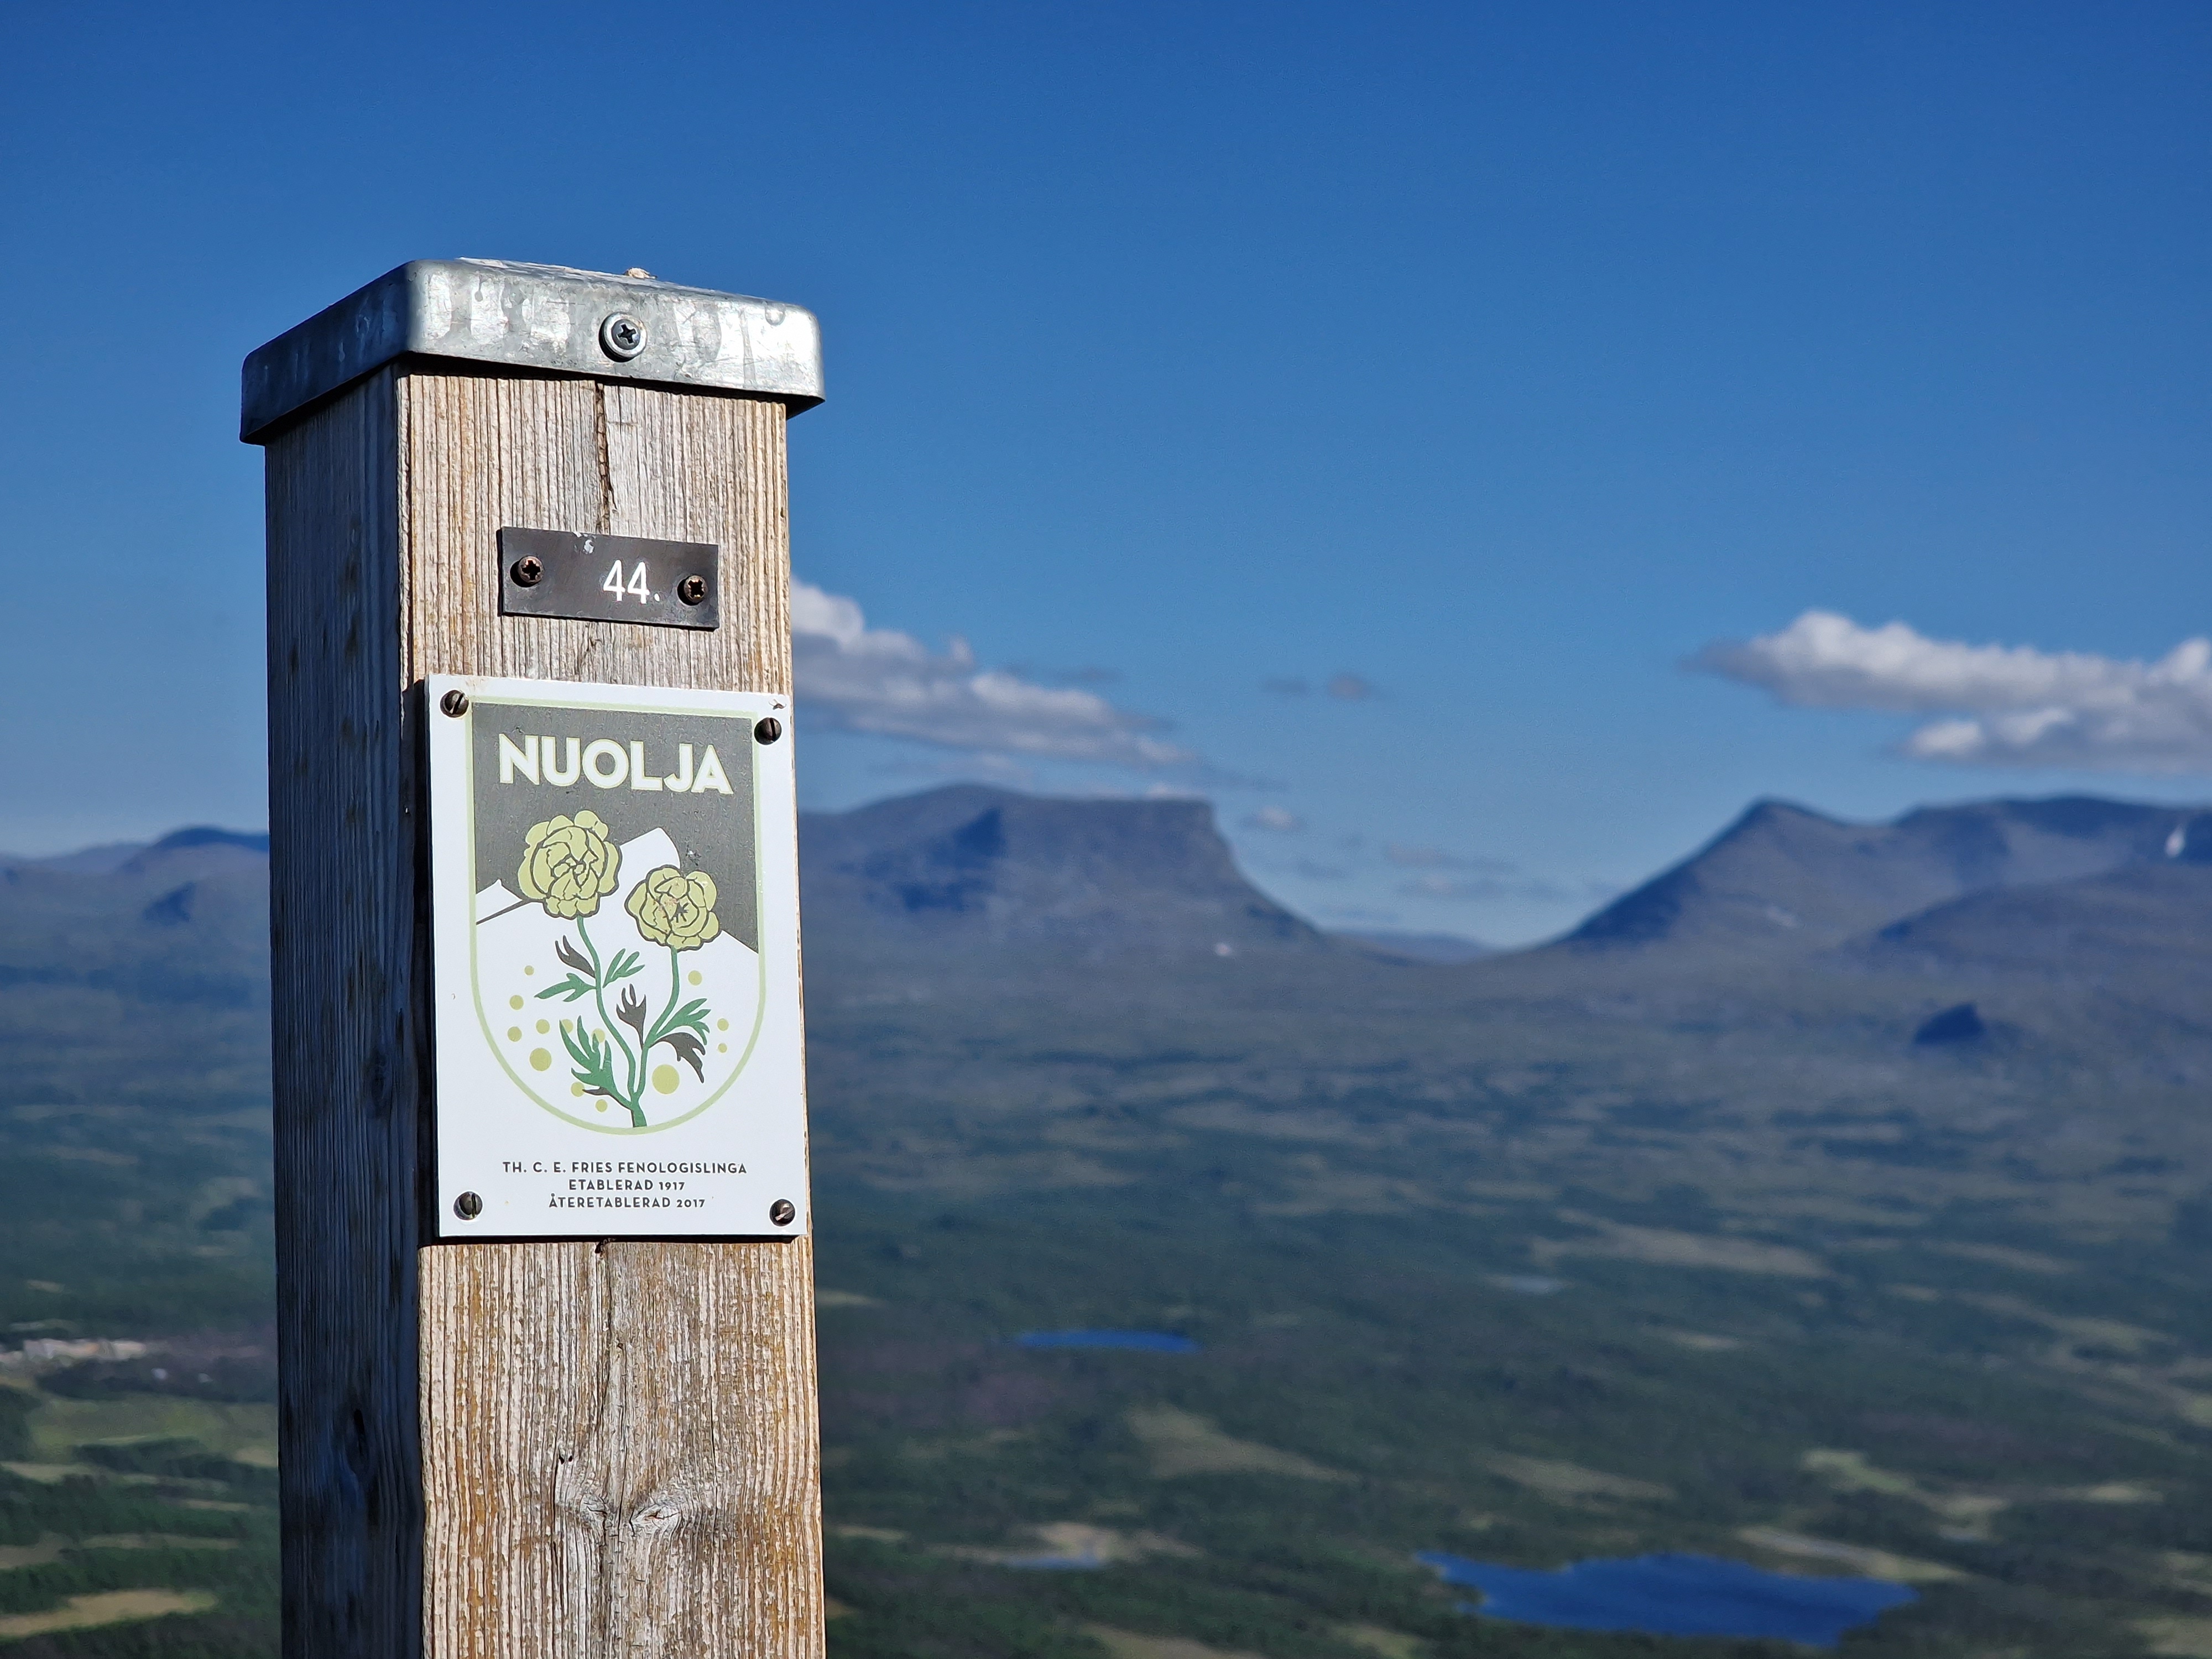
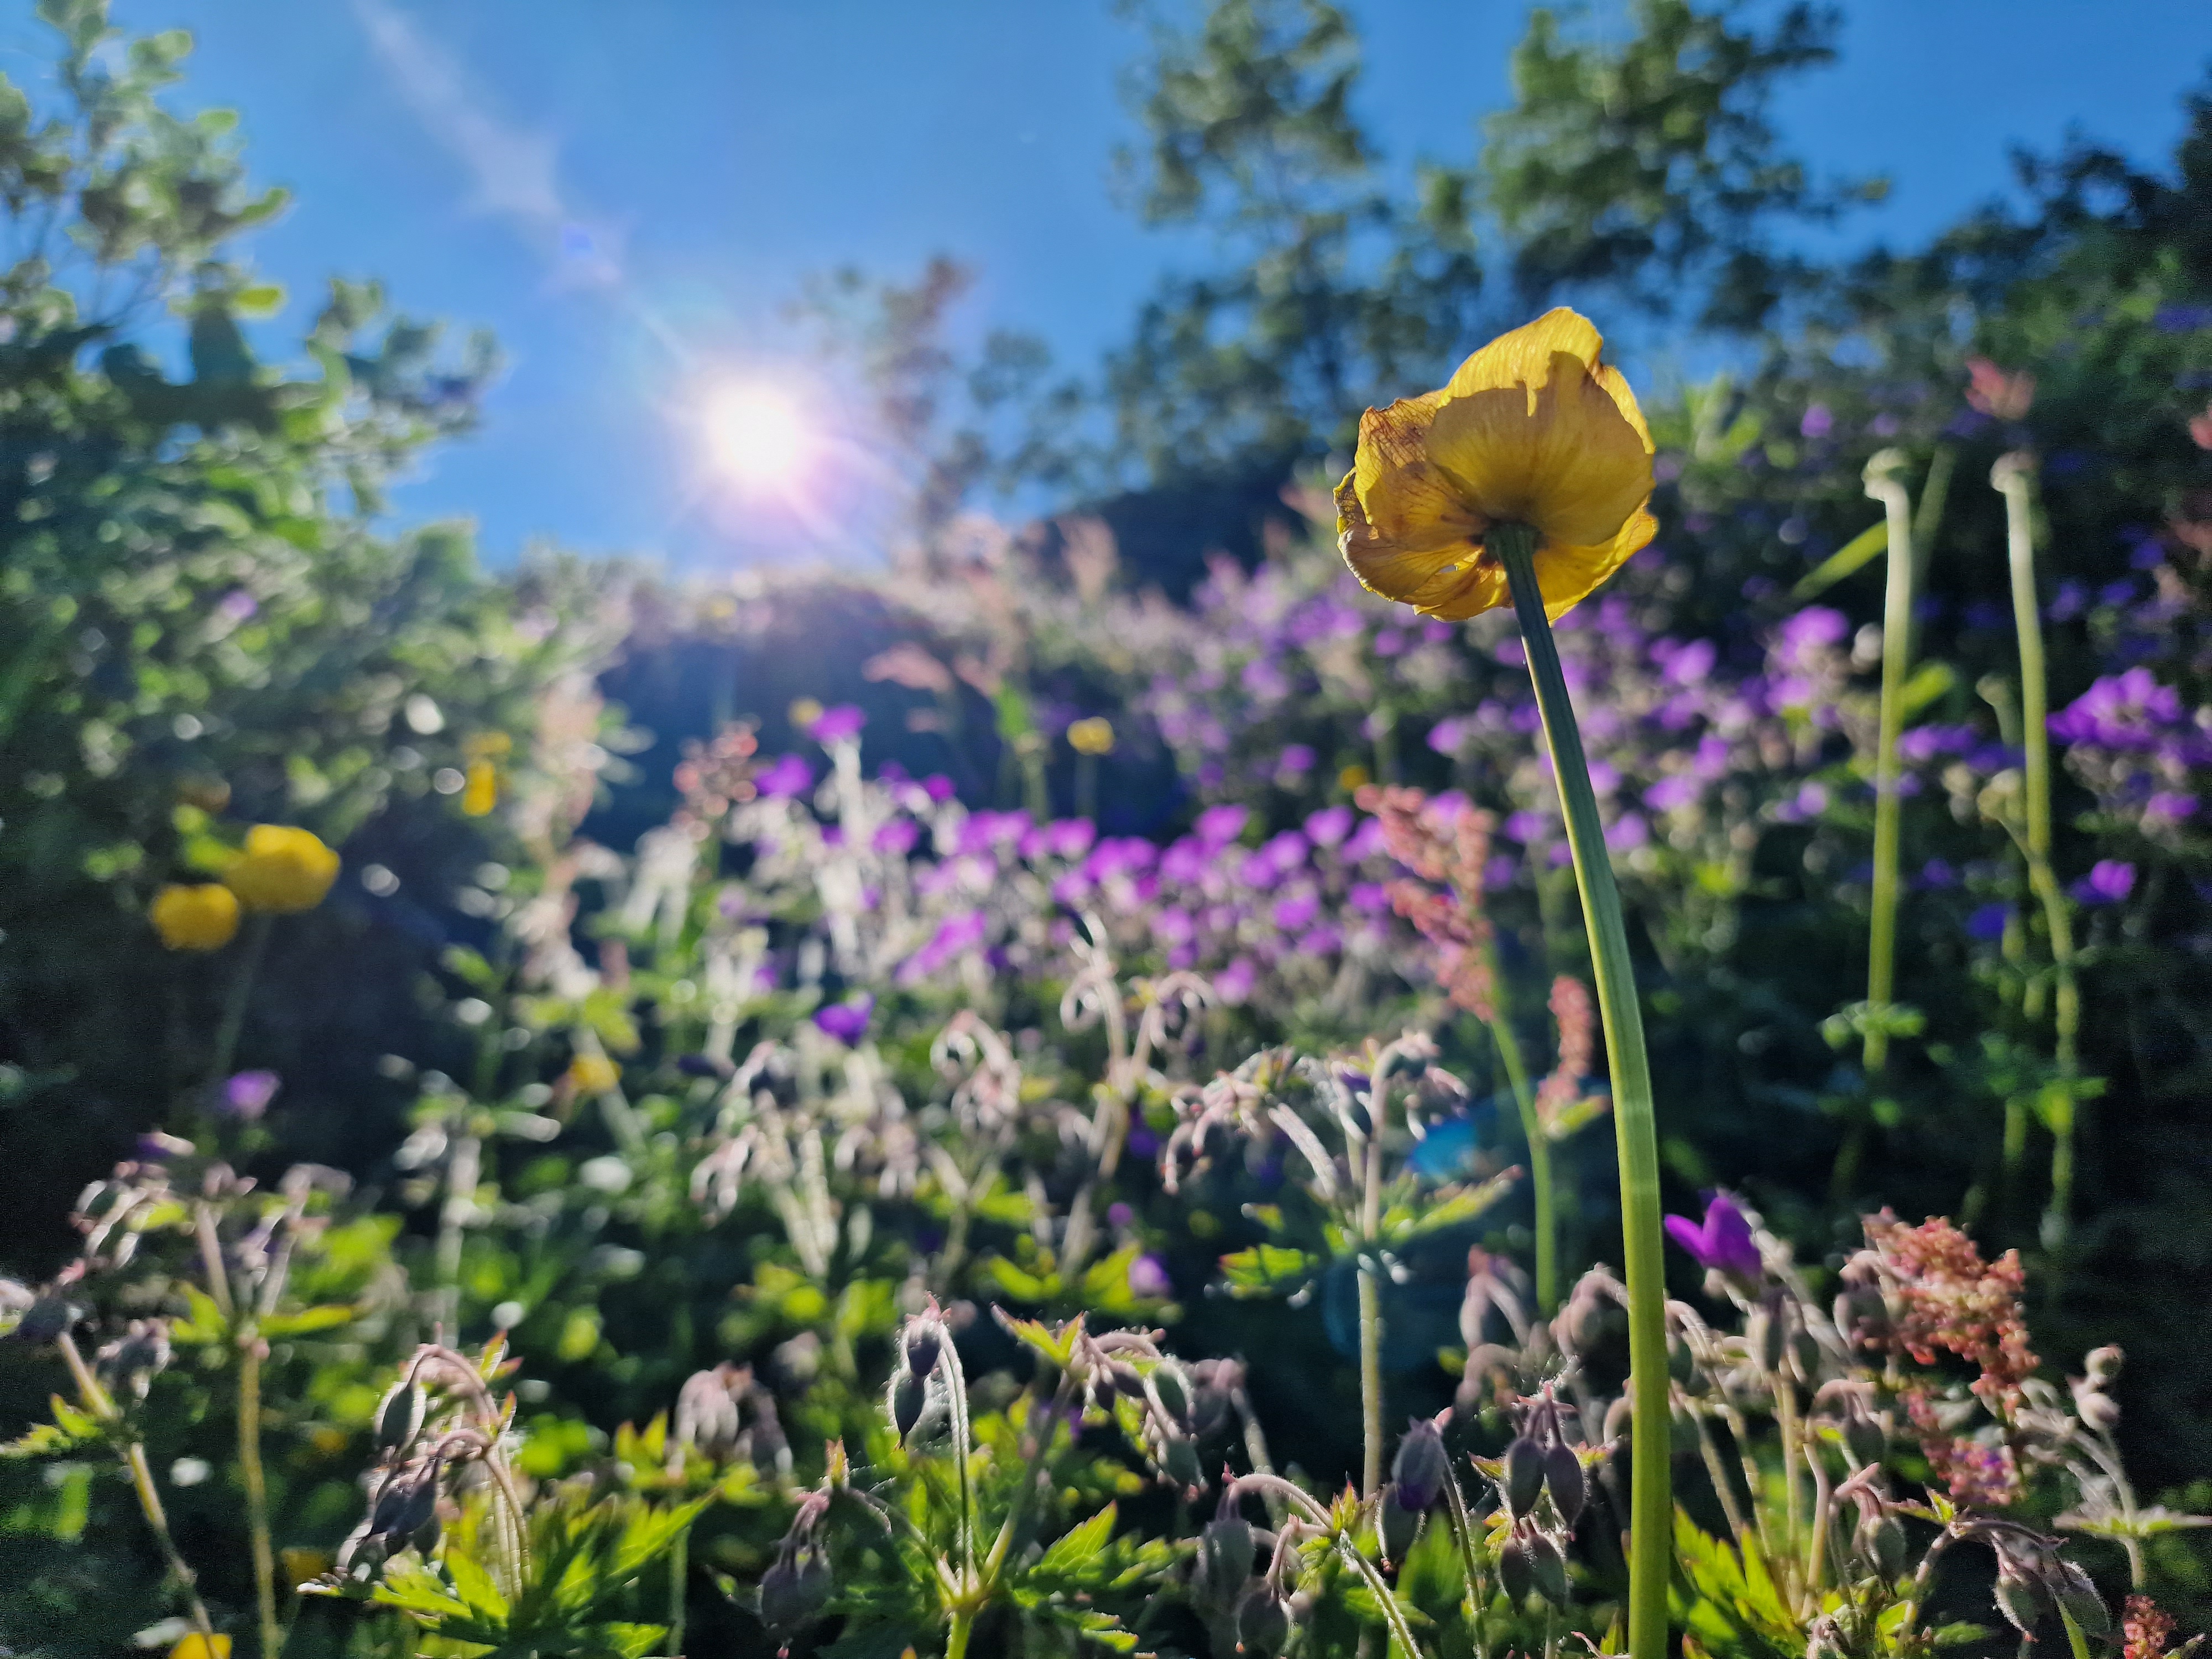
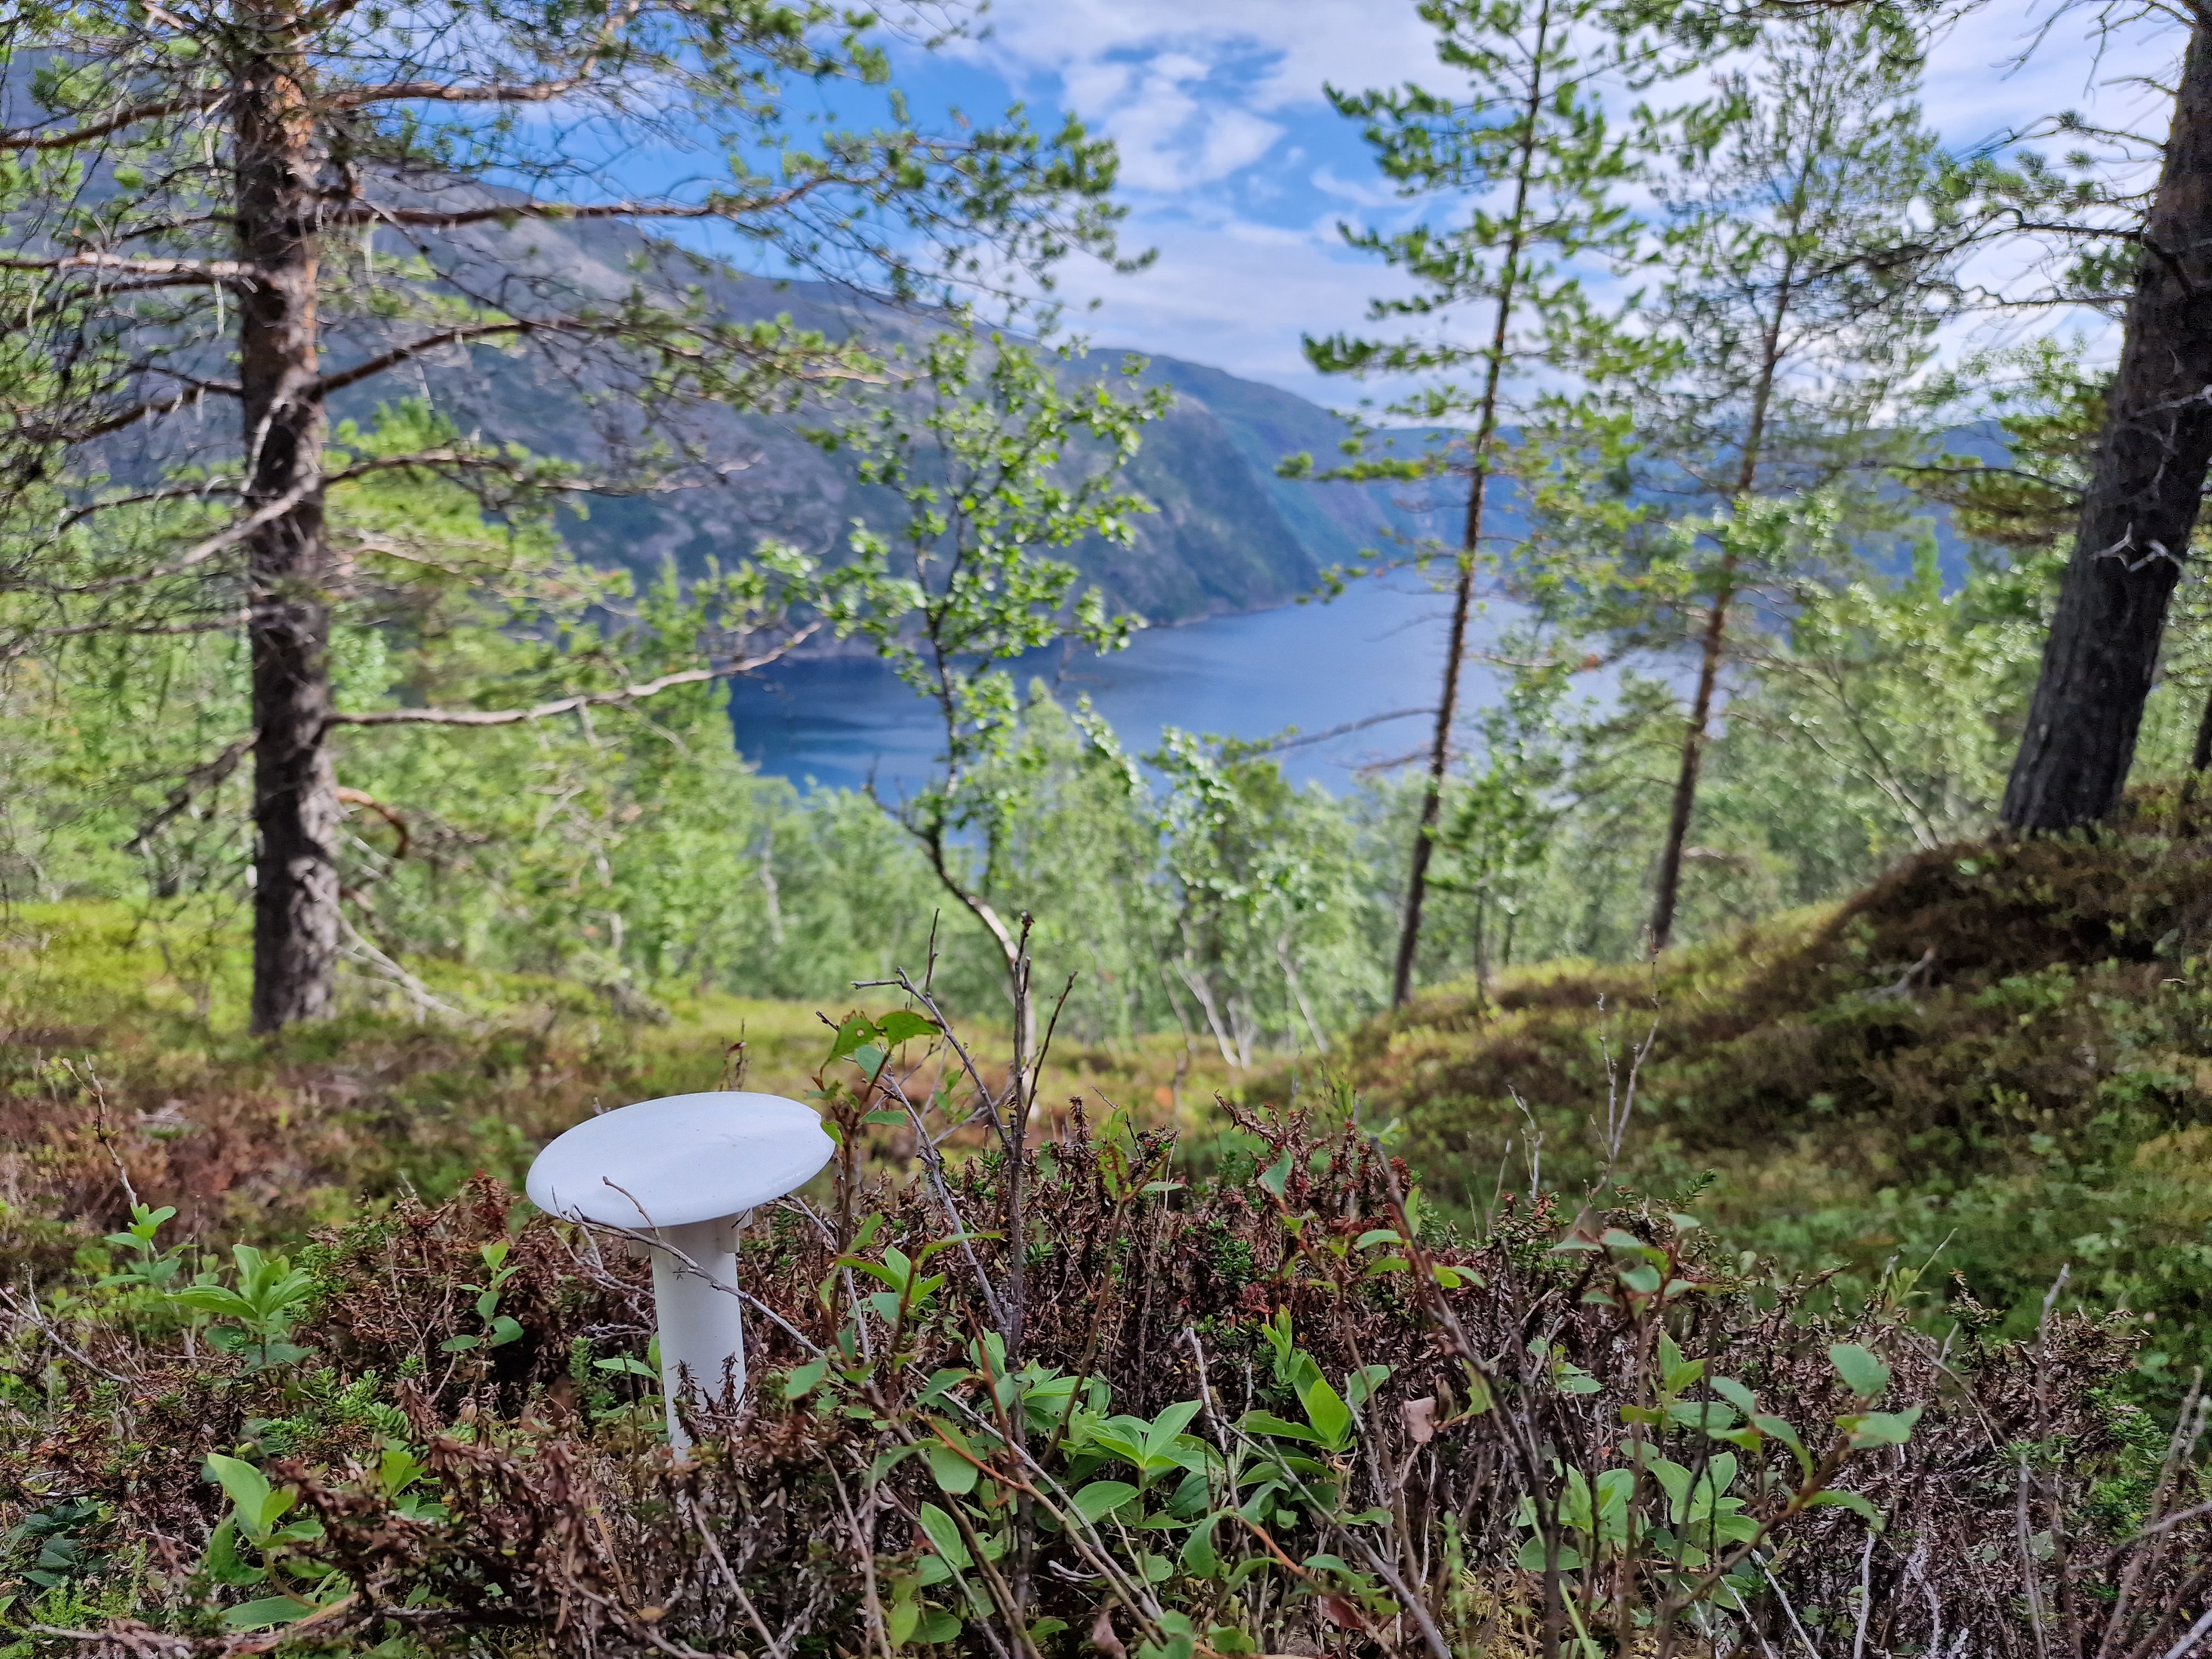
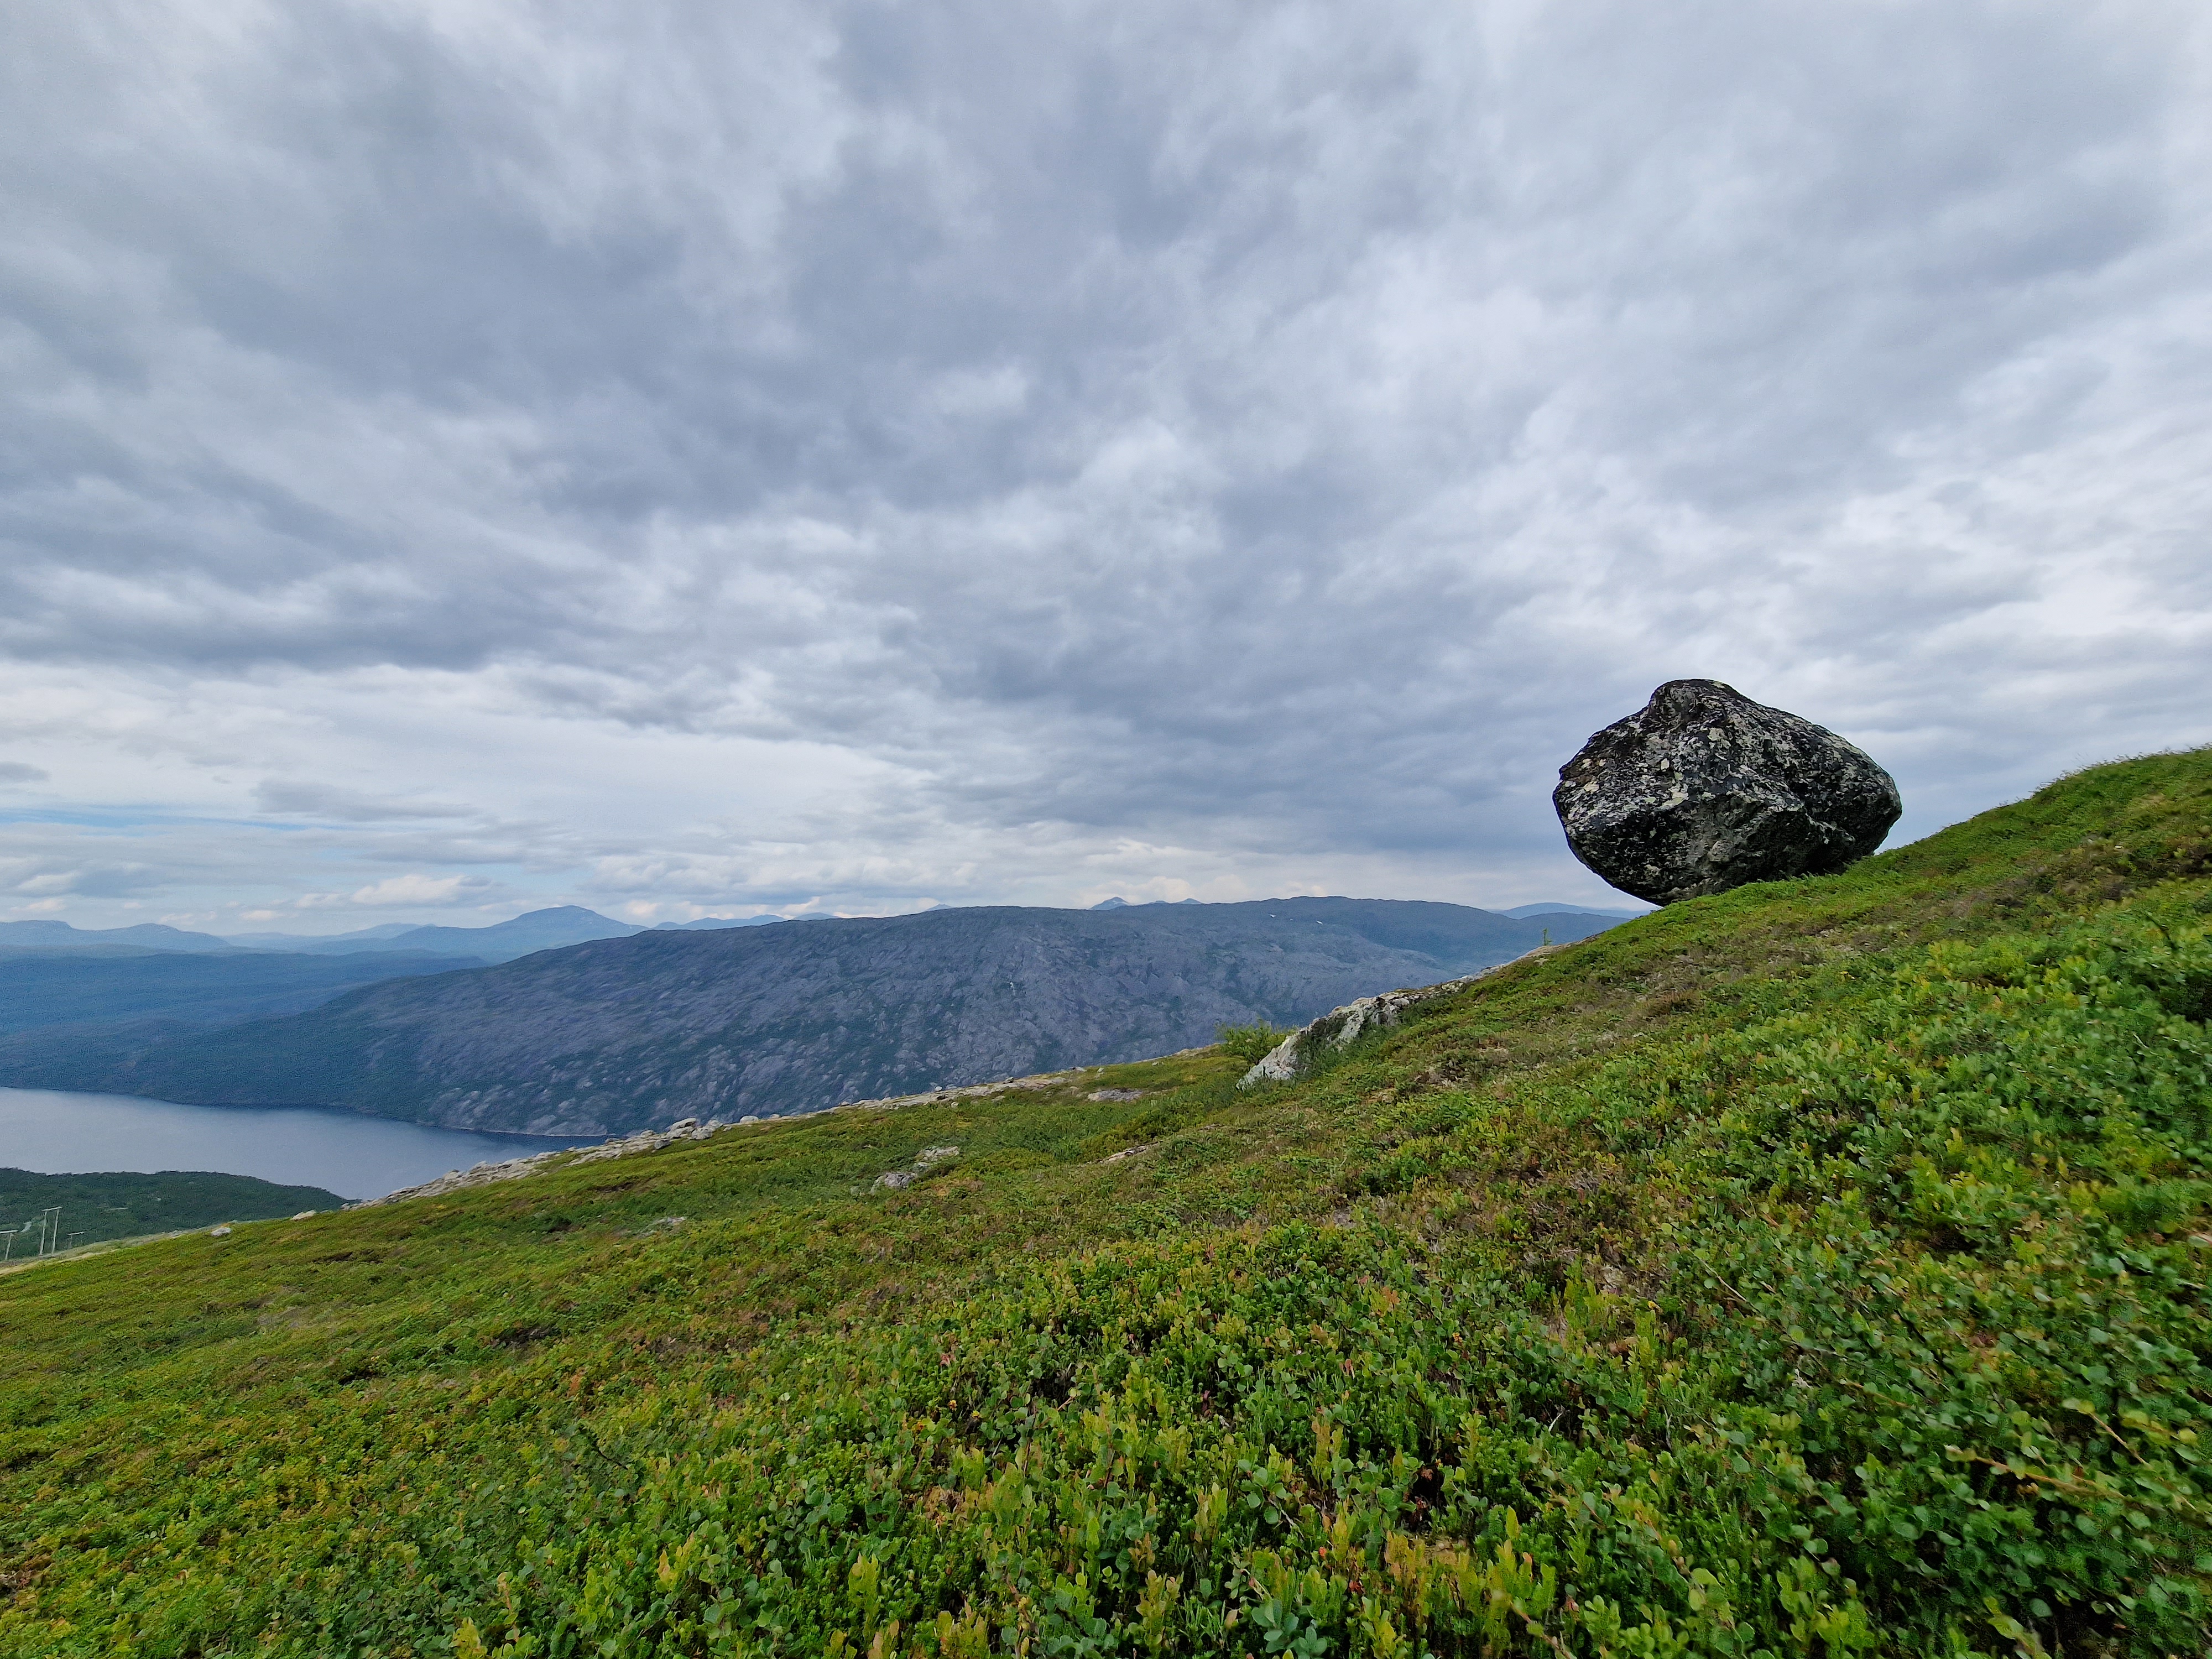
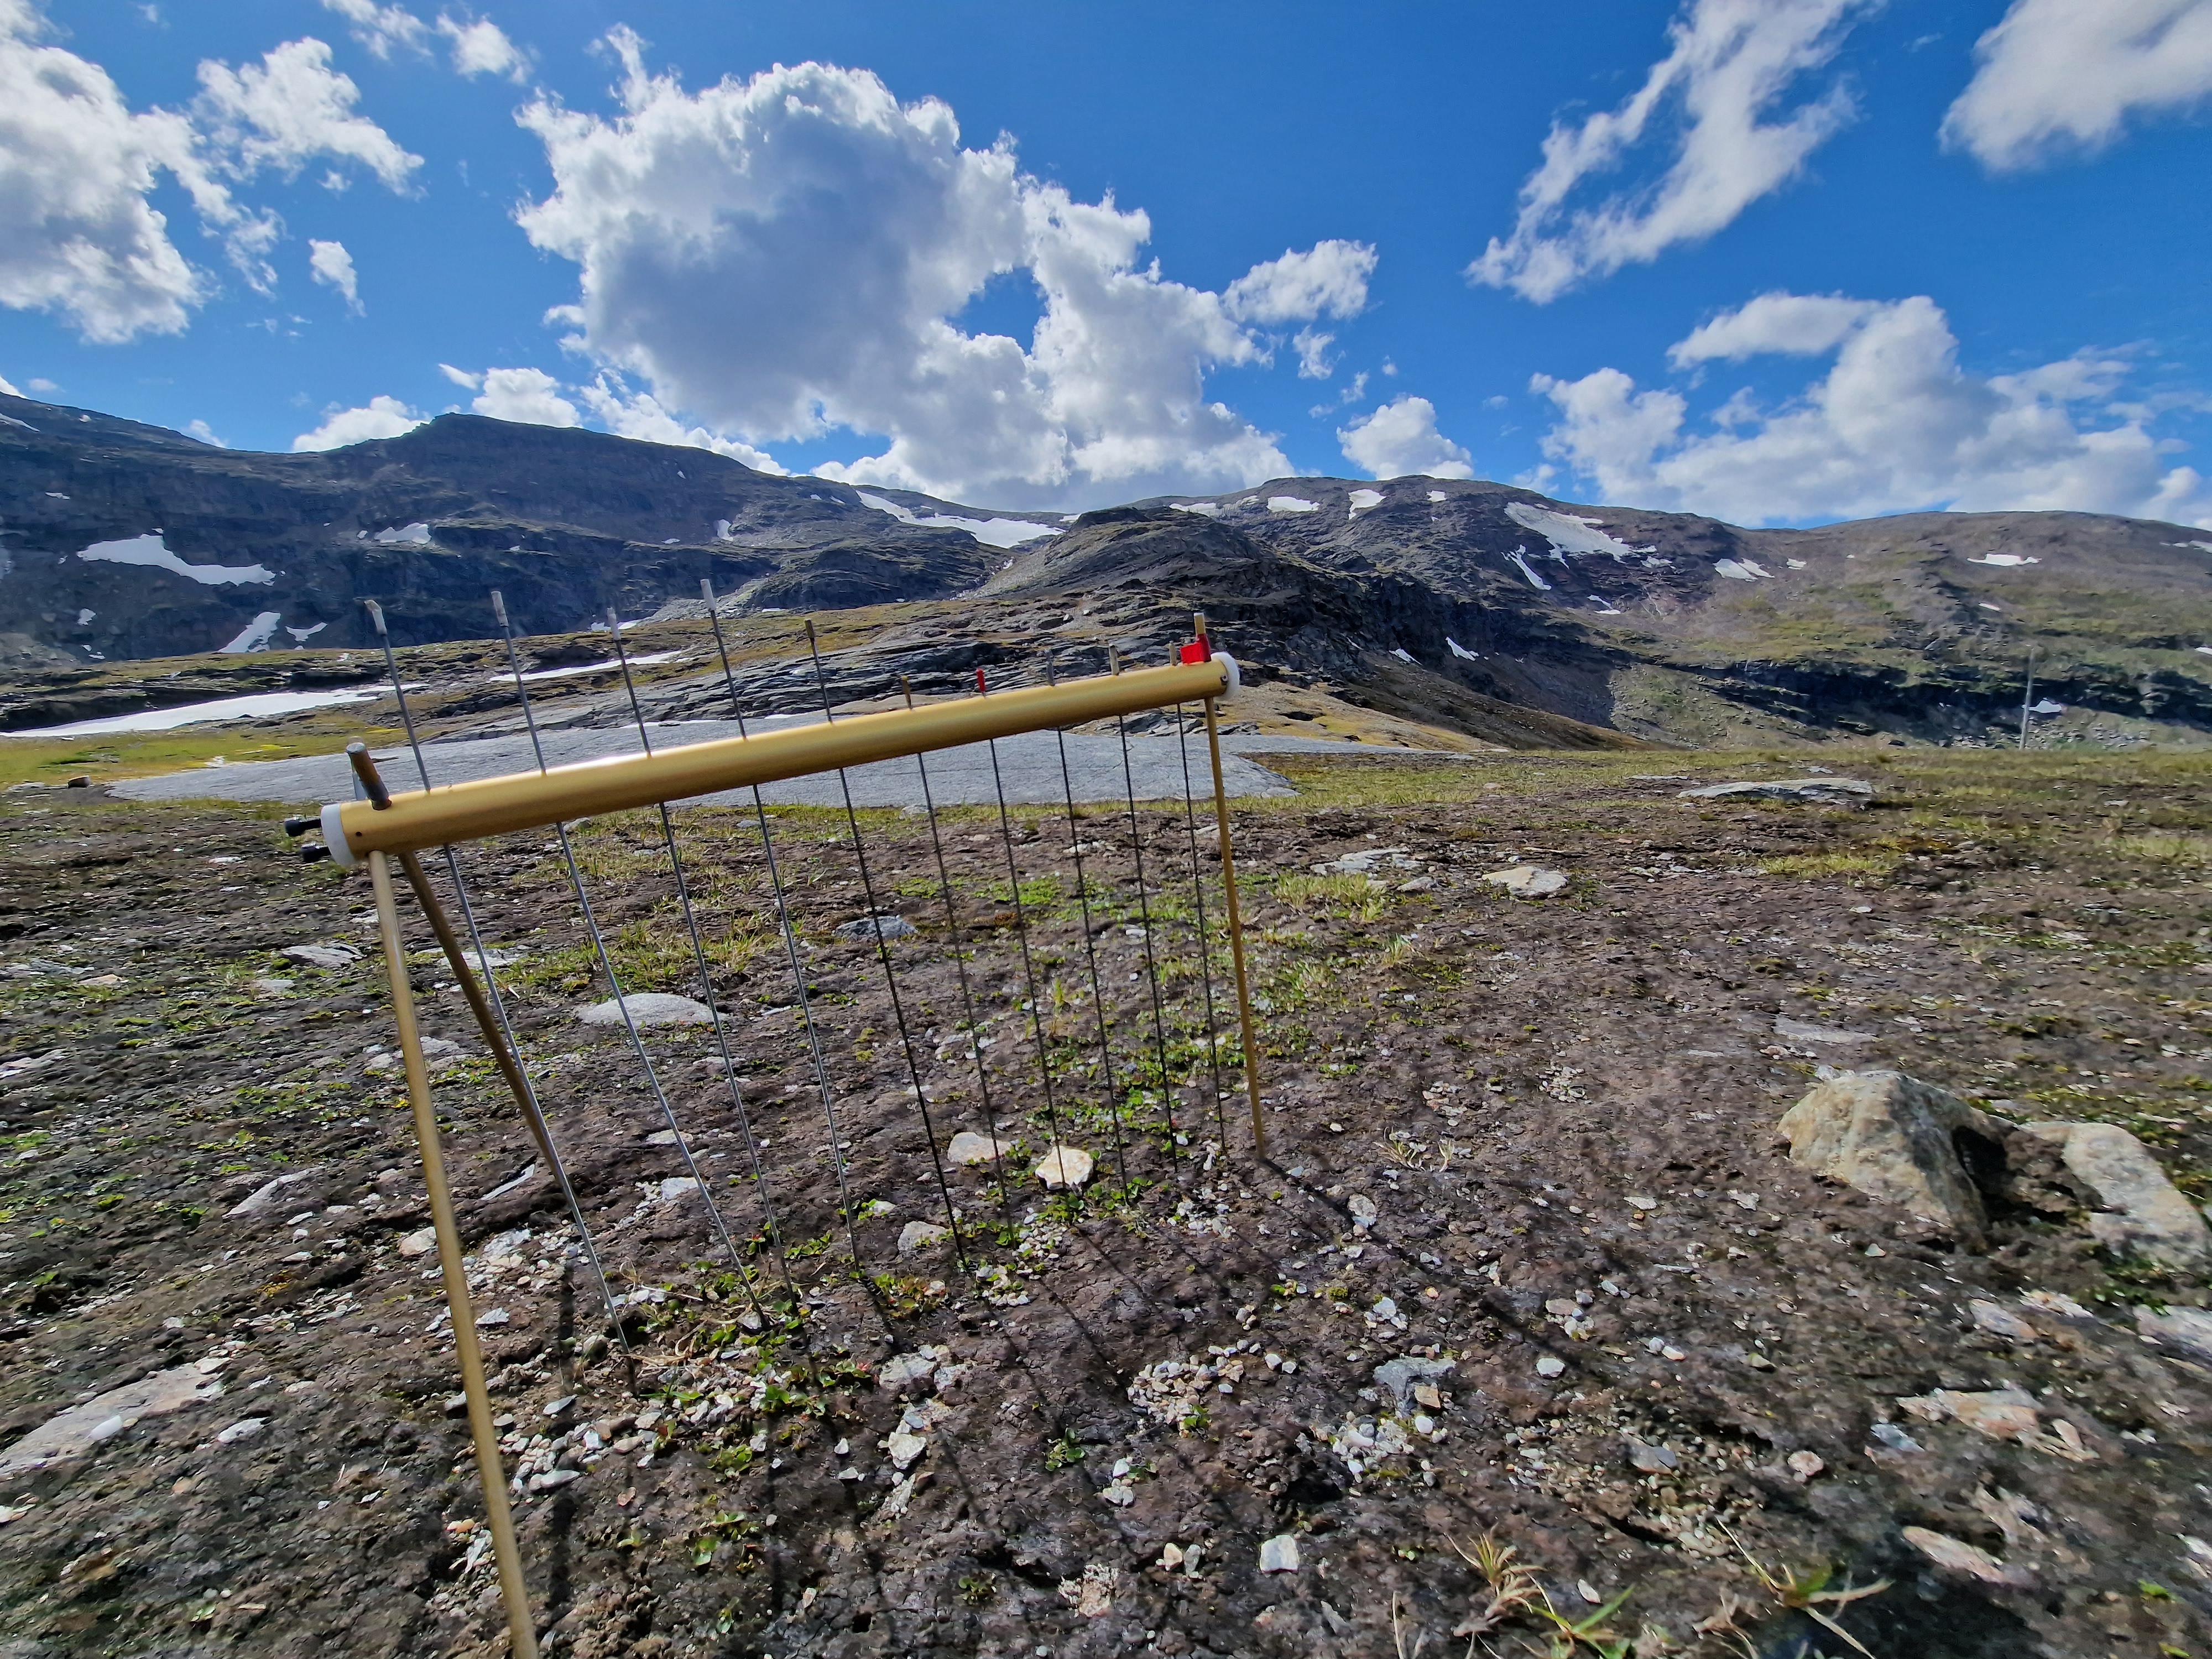
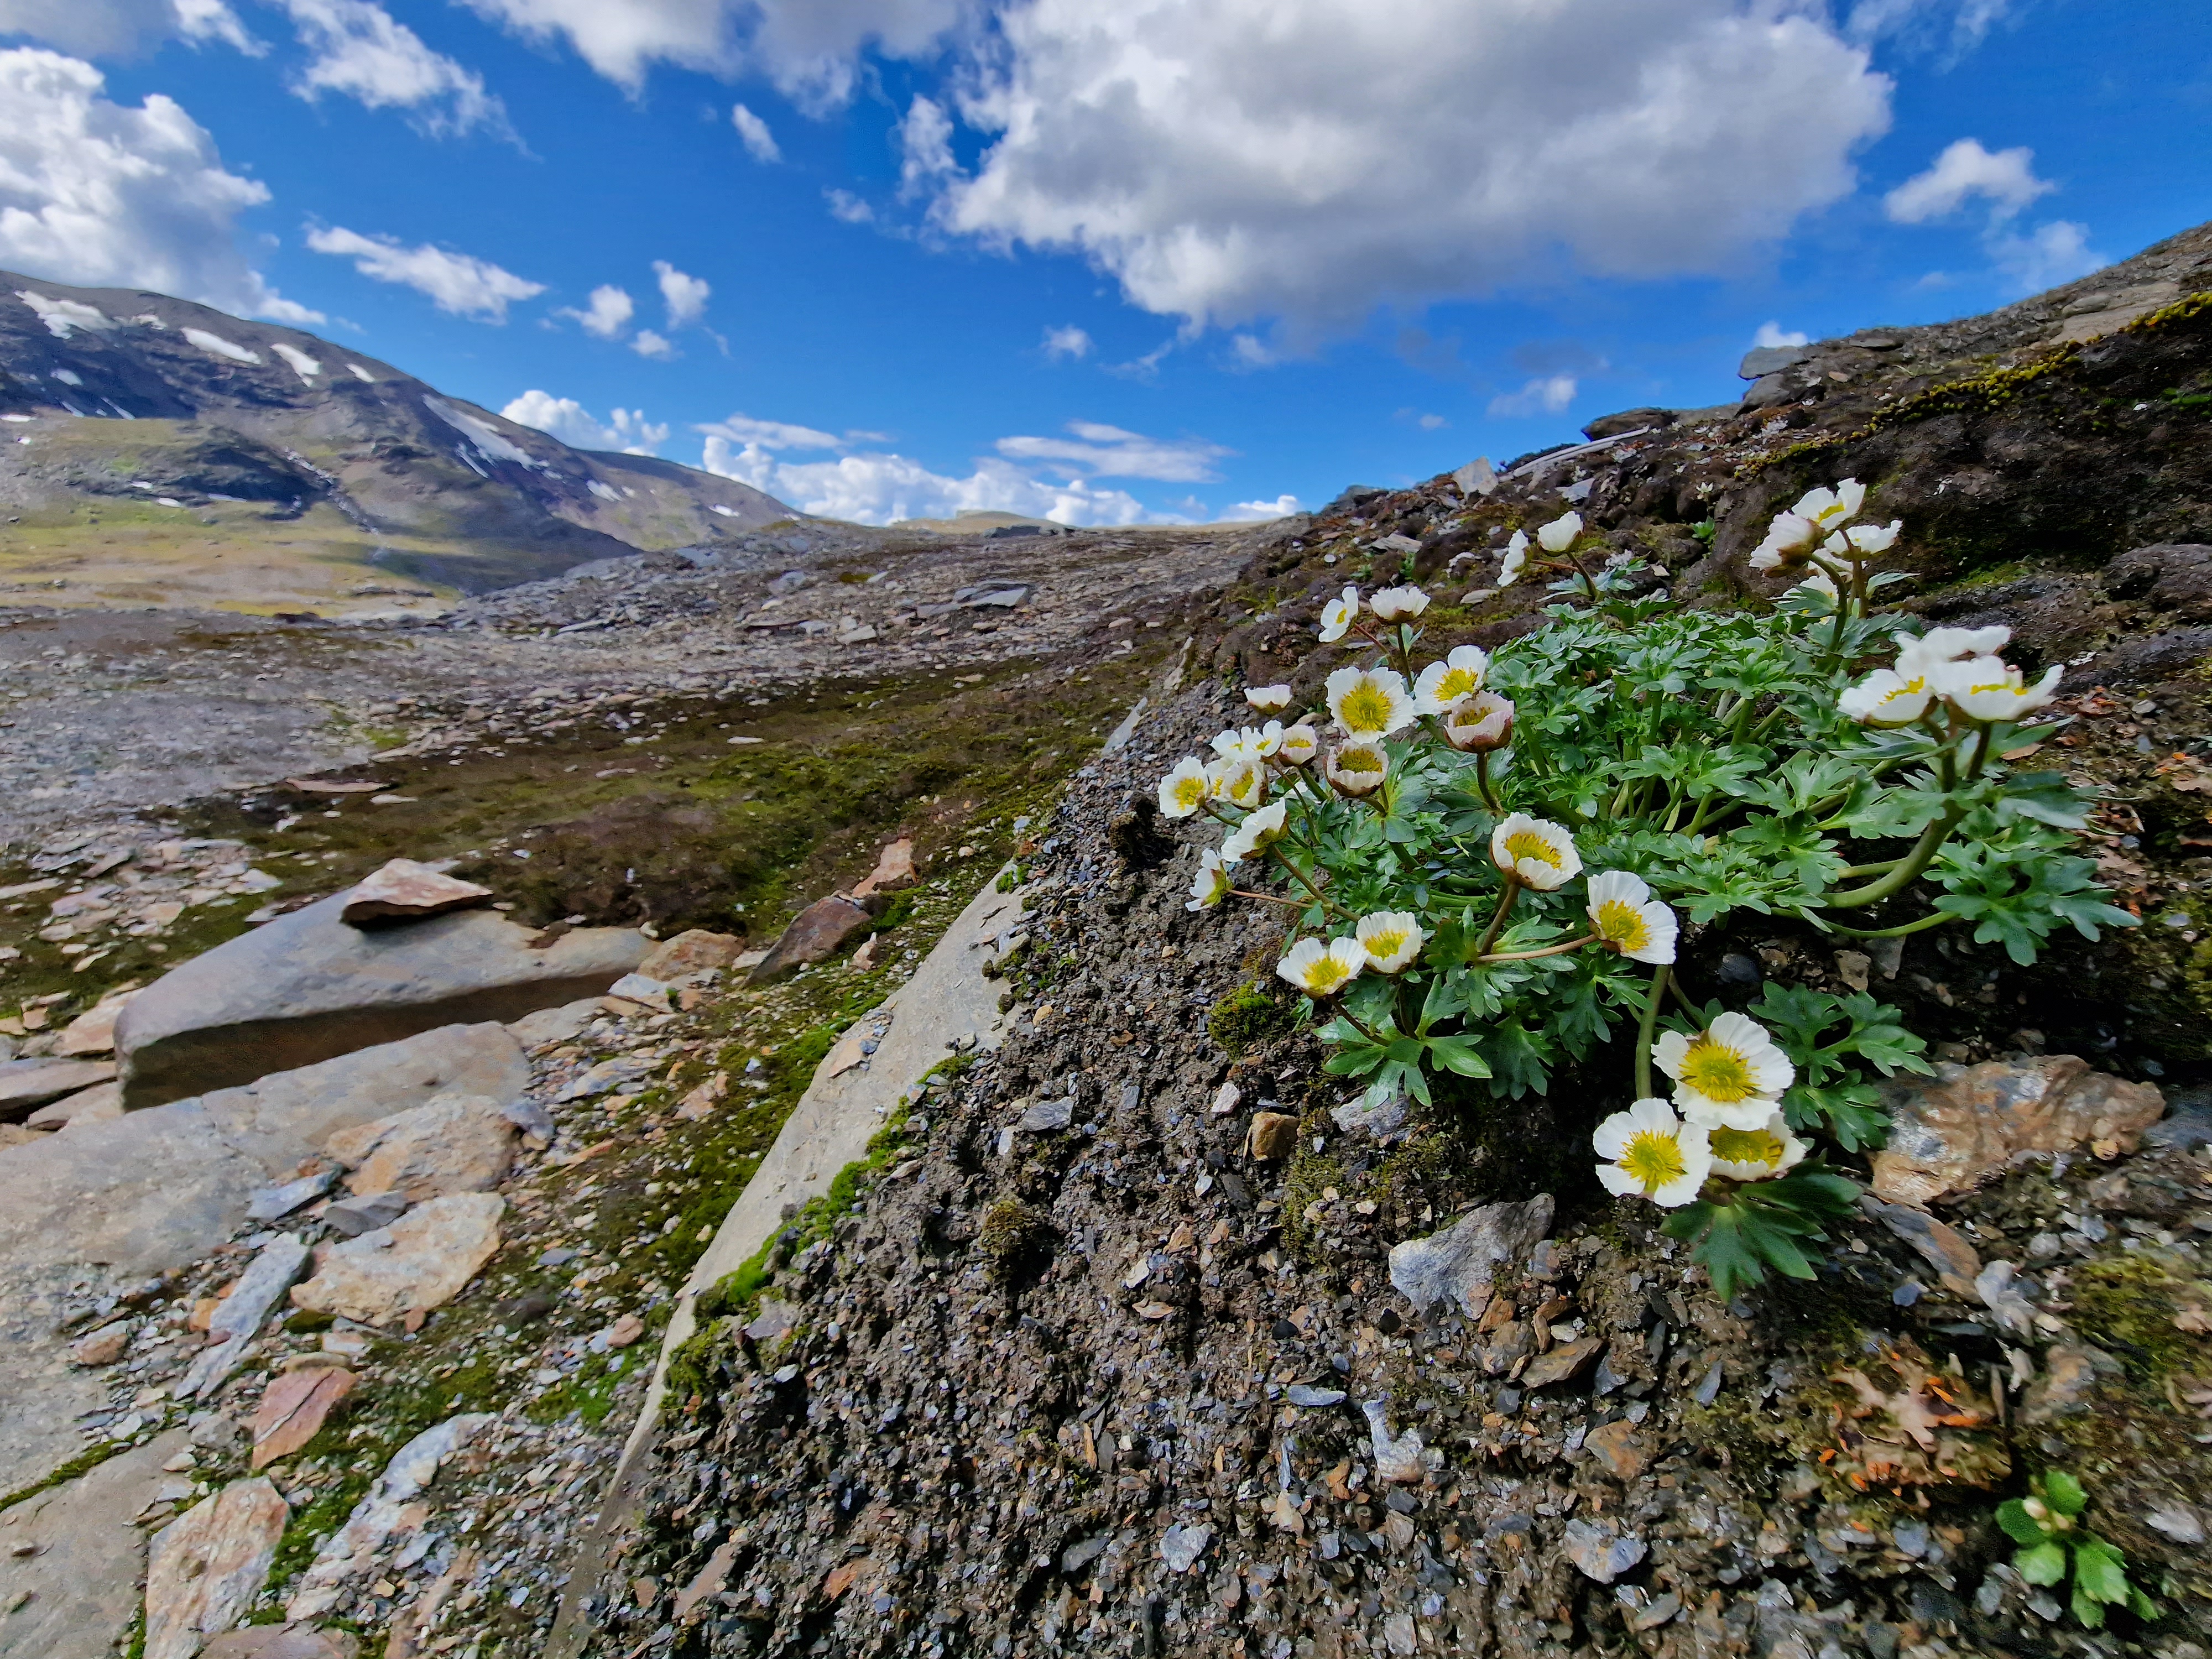
Microclimate and vegetation monitoring with a view of Abisko villageA yellow field of buttercupsAbsolute cutie: Linnaea borealisThe beautiful wooden poles marking our long-term vegetation monitoring plots on mount Nuolja, with the famous Lapporten mountain gap in the backgroundEvening sun on Trollius europaeus and Geranium sylvaticumMicroclimate monitoring with a view of a Norwegian fjordThis majestic rock has tempted to roll down into the fjord for at least twelve years‘Vegetation’ monitoring in the high-alpine zone of the Laktatjakka trailRanunculus glacialisPart of the team in action on a beautiful day in the Laktatjakka valleyMiniature forest in the high-alpine zone
Lake Törnetrask, Abisko Research Station, Abisko, Sweden
Abisko, Sweden
Norway, Narvik
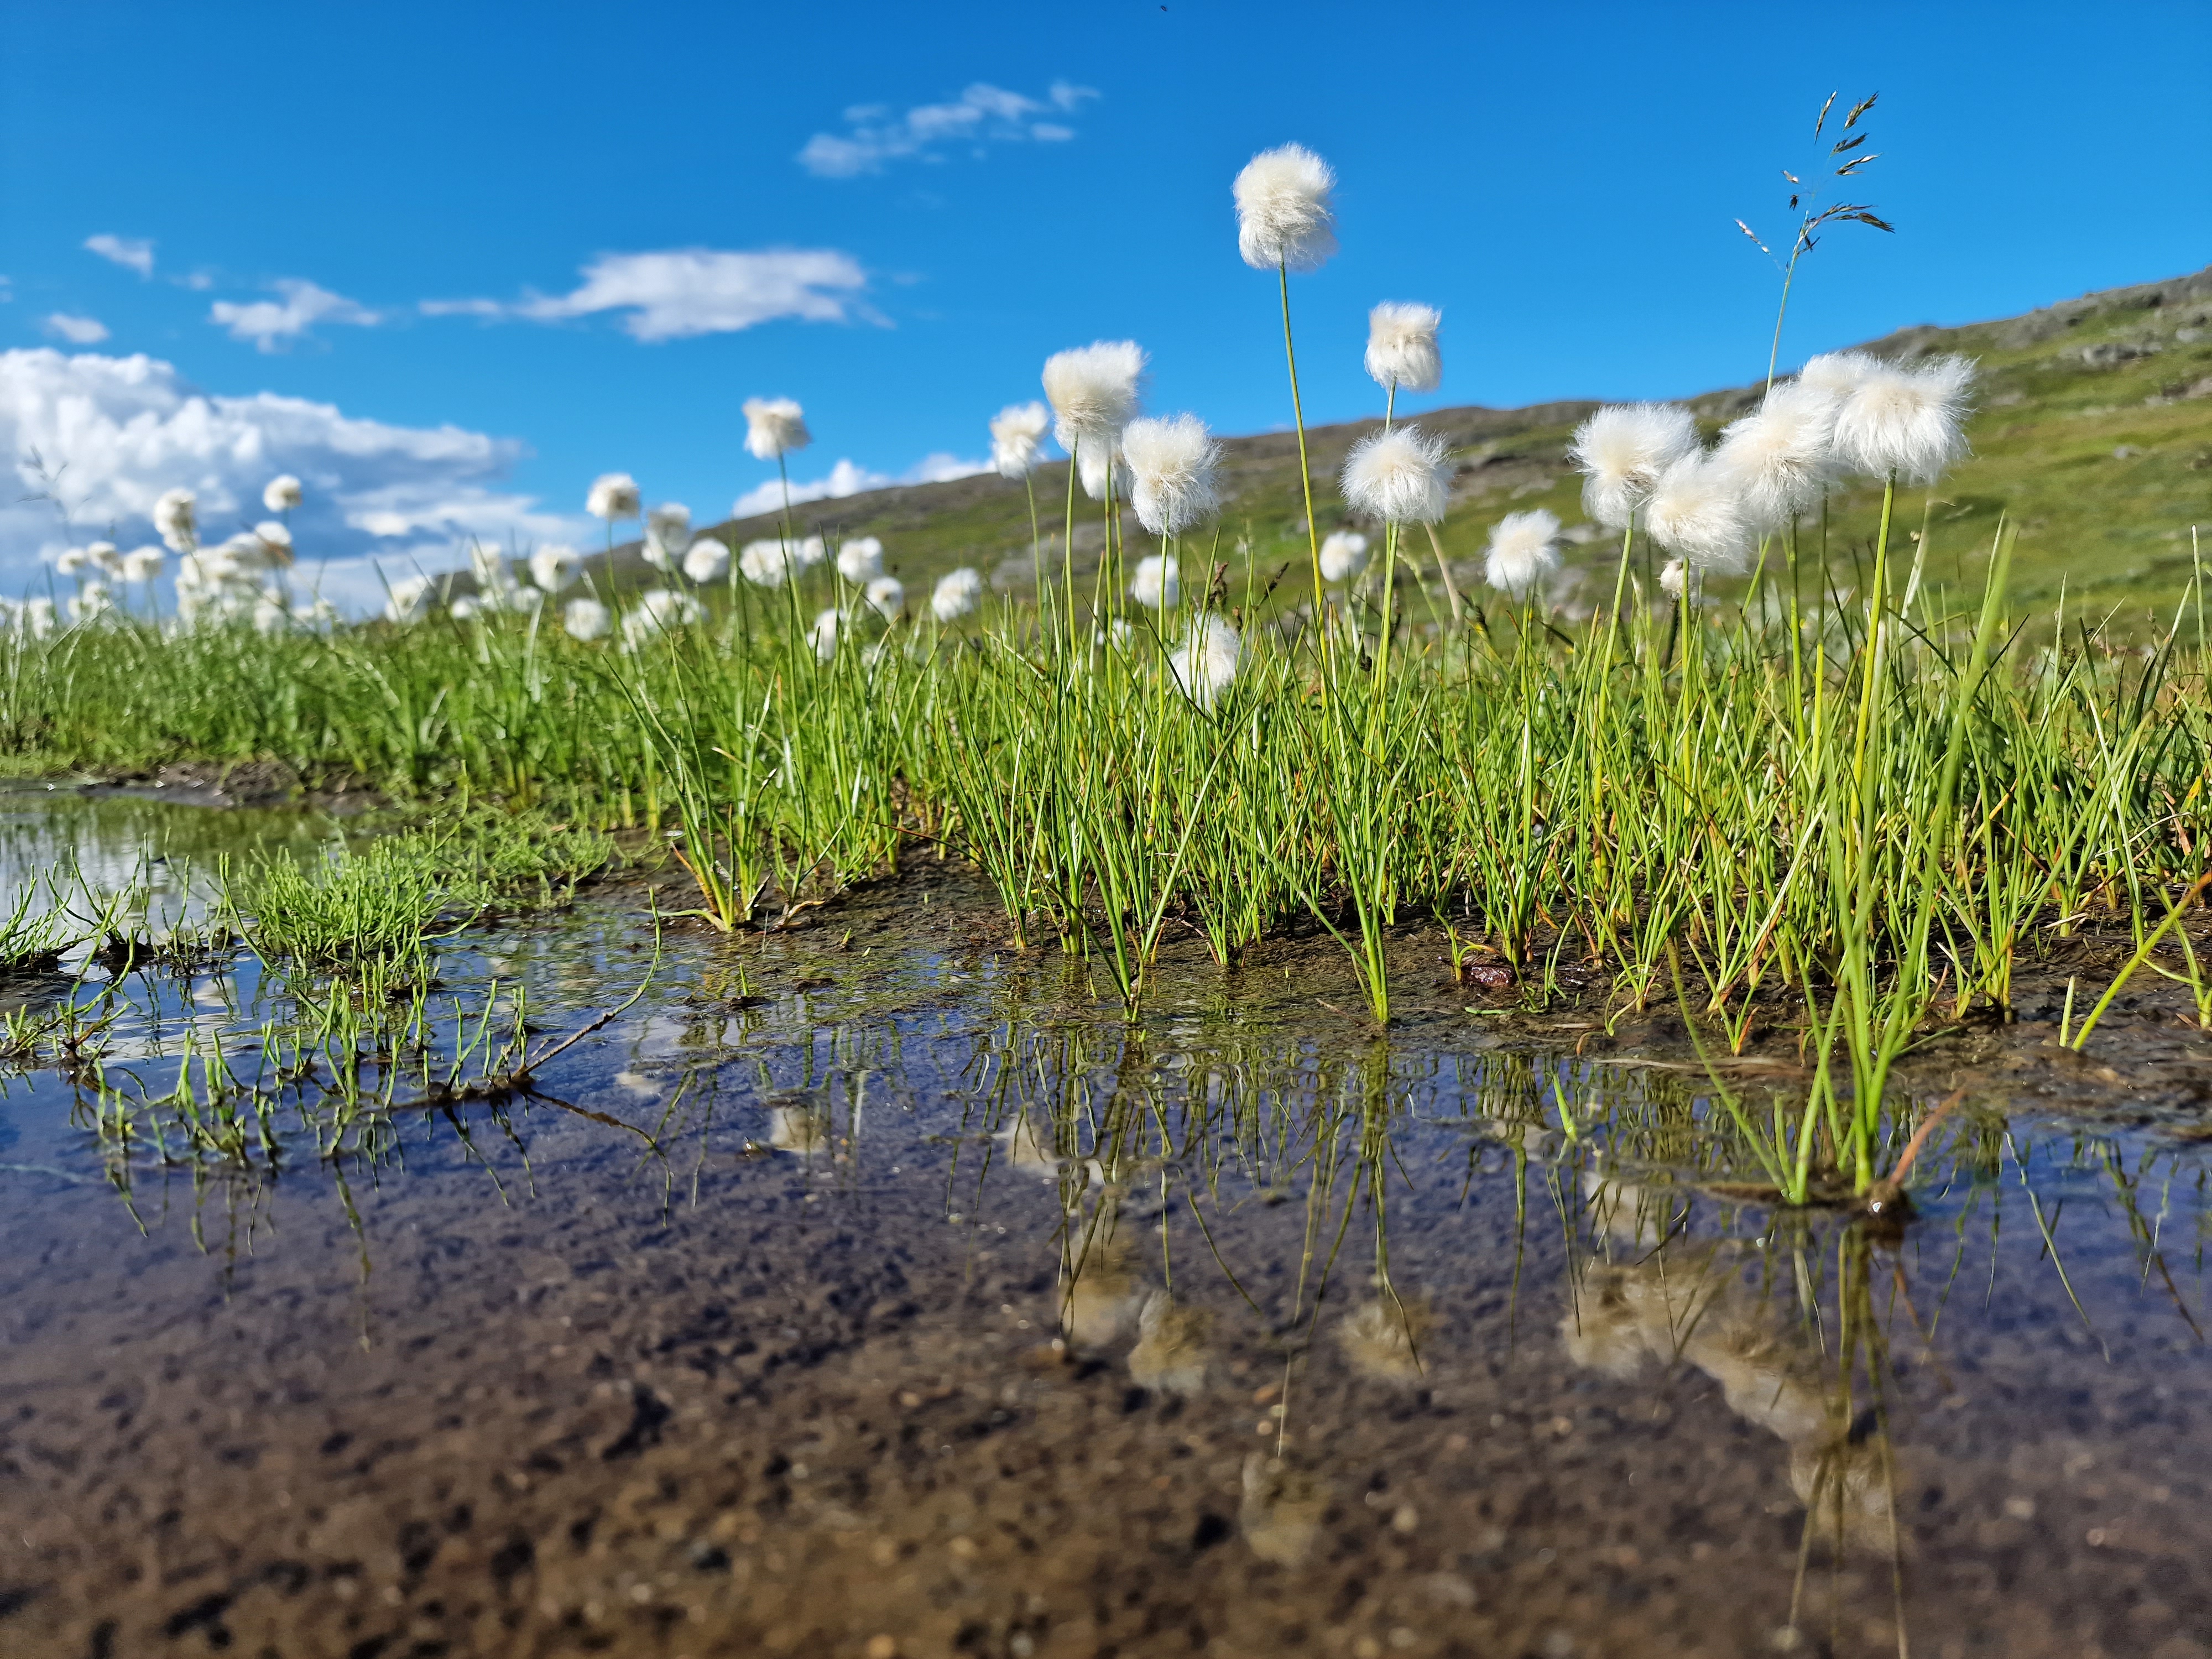
Eriophorum vaginatum
Angelica archangelica
Norway
Diapensia lapponica in one of our plots
Narvik, Norway
Lake Torneträsk, Abisko, Sweden
Oenanthe oenanthe, alpine tundra Abisko, Sweden
Laktatjakka valley
Summer in the Skjomen valley, northern Norway
Pinus sylvestris, Narvik, Norway
Narvik, Northern Scandes, Norway
in the Skjomen valley
Luscinia svecica, Abisko, Sweden
Skjomen valley, northern Norway
Common heather
Seen from Nuolja, Abisko
Norway
Phyllodoce caerulea
Skjomen valley, northern Norway
Saxifraga aizoides, Narvik, Norway
Epilobium angustifolium
Norway
Skjomen valley, northern Norway
Narvik, Norway
Hallerbos 2017
Young bluebell (Hyacinthoides non-scripta) surrounded by flowers of yellow archangel (Lamium galeobdolon)
The common bluebell (Hyacinthoides non-scripta), the signature flower of the Hallerbos
Single bluebell flower surviving on a wetter spot, as indicated by the field of wild garlic (Allium ursinum)
A really wet patch of forest, with giant horsetail (Equisetum telmateia) in a field of wild garlic (Allium ursinum)
Wild garlic (Allium ursinum) in the Hallerbos flowers a bit later than the bluebells, yet this one was already in full bloom
A bumblebee visiting yellow archangel (Lamium galeobdolon)
A bumblebee visiting yellow archangel (Lamium galeobdolon)
Wild garlic (Allium ursinum)
Wild garlic (Allium ursinum)
Weirdly beautiful, the inflorescence of pendulous sedge (Carex pendula), typical for the wettest spots in the forest
Weirdly beautiful, the inflorescence of pendulous sedge (Carex pendula), typical for the wettest spots in the forest
A little stream in the Hallerbos, surrounded by endless fields of wild garlic (Allium ursinum)
The herb-paris (Paris quadrifolia), less common in the forest
Wild garlic (Allium ursinum)
Bluebells (Hyacinthoides non-scripta)
Weirdly beautiful, the inflorescence of pendulous sedge (Carex pendula), typical for the wettest spots in the forest
Another one from the wet plots: large bitter-cress (Cardamine amara)
Another one from the wet plots: large bitter-cress (Cardamine amara)
Young beech leaves, as soon as they are fully grown, spring in the understory is over
A beech forest without understory, most likely too dry and too acid for any survivors
A young beech seedling (Fagus sylvatica), looking nothing like a beech, yet everything like a tiny dancer
Young beech seedling (Fagus sylvatica)
Bluebells (Hyacinthoides non-scripta)
Bluebells (Hyacinthoides non-scripta)
Bluebells (Hyacinthoides non-scripta)
Mountain melick (Melica nutans), a grass in the most amazing green
Bluebells (Hyacinthoides non-scripta) in a rare patch of mountain melick (Melica nutans), a grass in the most amazing green
Bluebells (Hyacinthoides non-scripta)
Bluebells (Hyacinthoides non-scripta)
Montpellier 2017
The entrance to the cathedral of Montpellier
The cathedral of Montpellier
The entrance to the cathedral of Montpellier
The cathedral of Montpellier
Narcissus poetics
The cathedral of Montpellier
The botanical garden of Montpellier
The botanical garden of Montpellier
The botanical garden of Montpellier
Brackish Camargue vegetation
Brackish Camargue vegetation
Brackish Camargue vegetation
A typical lagune
Brackish Camargue vegetation
Camargue horses
Camargue horses
Camargue horses
Brackish Camargue vegetation
Brackish Camargue vegetation
Brackish Camargue vegetation
Camargue horses
Brackish Camargue vegetation
Little egret in the evening sun
Flamingo’s in the evening sun
A typical lagune
Dandelion fuzz
Grass lily
Grass lily
Dandelion fuzz
Veronica in a sea of poplar fluff
Euphorbia in a sea of poplar fluff
Poplar
Gare du Midi, Brussels
Gare du Midi, Brussels
Gare du Midi, Brussels
Gare du Midi, Brussels
Sweden autumn 2016
Autumn in Abisko
Yellow leaves of mountain birch, with lake Torneträsk in the background.
Lapporten, the gate to Lapland, in Abisko
Rain blowing over the Abisko National Park
The colours of the north: red fireweed and yellow mountain birches, with lake Torneträsk on the background
Yellow leaves of mountain birch, with lake Torneträsk in the background.
Rain on the background, the ski lift in Abisko on the foreground
The steep slope of mount Nuolja on a dramatic looking morning
The beautiful colors of lake Torneträsk in Abisko
A little stream on top of the mountain, with a view on Lapporten, the gate to Lapland
Well, that is a beautiful table with a nice view on lake Torneträsk in Abisko
Our little experiment on top of the mountain in Abisko, with a view on Lapporten
Autumn in Abisko is extremely colorfull
The ski lift with a view on Abisko National Park and Lapporten
Hiking dowhill towards lake Torneträsk
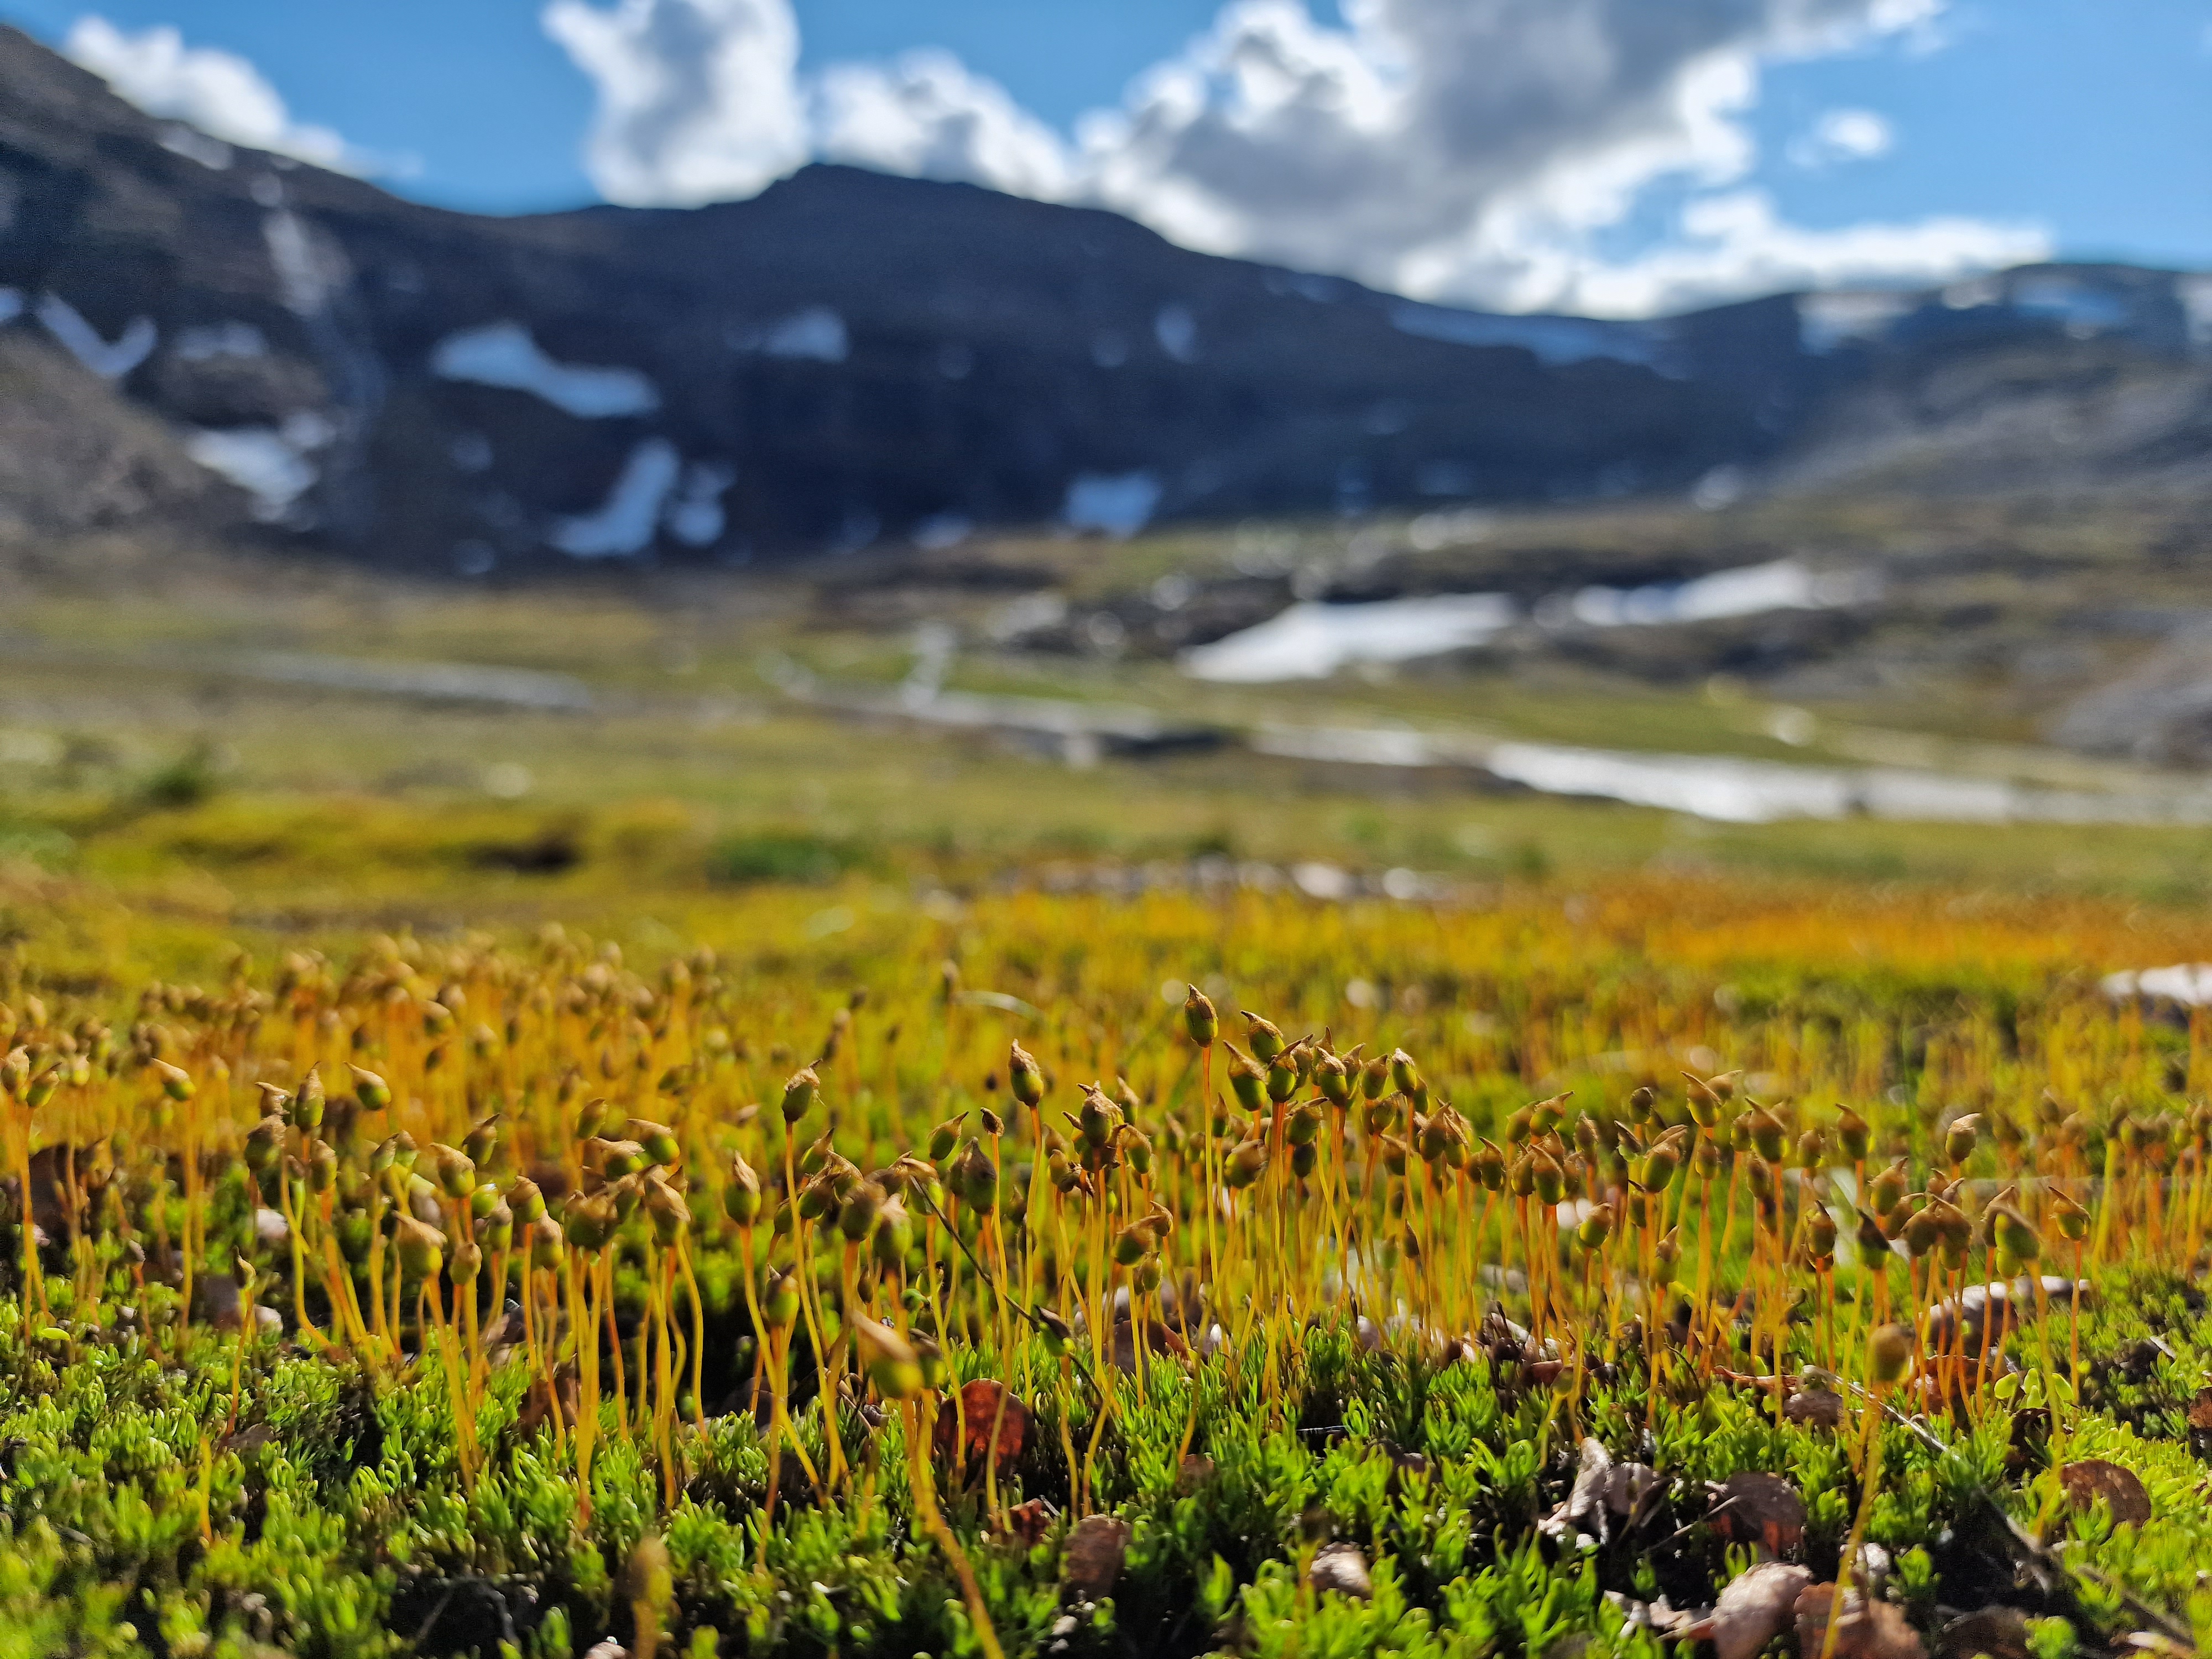
This green is greener than the greenest green: moss on top of mount Nuolja
Well, that is a beautiful table with a nice view on lake Torneträsk in Abisko
The ski lift with a view on Abisko National Park and Lapporten
The ski lift with a view on Abisko National Park and Lapporten
The most beautiful hiking trail of the world: Nuolja in Abisko
Angelica archangelica, often the biggest plant of the Arctic
The most beautiful hiking trail of the world: Nuolja in Abisko
Cirsium helenioides, the melancholy thistle
Hiking down mount Nuolja
The steep slope of mount Nuolja on a dramatic looking morning
The colours of the north: red fireweed and yellow mountain birches, with lake Torneträsk on the background
The prettiest yellow and blue: autumn in Abisko
Fireweed, Epilobium angustifolium
Campanula or bellflower, I think ‘uniflora’
Vaccinium myrtillus
Cornus suecica, the prettiest red of the world
Hieracium alpinum, alpine hawkweed
Carex atrata, one of my favourite sedges
Alpine clubmoss, Diphasiastrum alpinum
Agrostis capillaris, bentgrass
Common yarrow (Achillea millefolium)
Anthoxanthum odoratum, sweet vernal grass, fully grown and mature
Snow scooter trail
Our plot in the mids of a field of horsetails (Equisetum pratense)
Equisetum pratense
Cliff overlooking the valley with the road to Norway
Seedling of Taraxacum officinale, the dandelion, after two years of growing in bad conditions
Poa alpina, the alpine meadow-grass, with its viviparous seeds
Massive flowerhead of Angelica archangelica
Angelica archangelica
Blueberry (Vaccinium myrtillus) in autumn
A lowland marsh in Abisko in autumn
Installing the plots of our trail observations on top of mount Nuolja
Installing the plots of our trail observations on top of mount Nuolja
Tanacetum vulgare (Tansy), non-native for the high north
Autumn forest down in the valley
The valley of Nuolja to Björkliden
Summer on the Nuolja-side
A full rainbow behind mount Nuolja in Abisko
It’s raining in the west, clouds trapped behind the mountains
A strong wind blowing rain from behind the mountains to our side
A strong wind blowing rain from behind the mountains to our side
Betula nana, the dwarf birch, mini autumn forest
Betula nana, the dwarf birch, mini autumn forest
The valley of Björkliden in autumn
The valley of Björkliden in autumn
The valley of Björkliden in autumn
The valley of Björkliden in autumn
Sweden spring 2016
Ranunculus glacialis
Trifolium pratense
The valley of the lakes
Dryas octopetala
Silene suecica
Silene acaulis
Melting snowpatch on a lake
Although the alpine zone has been harder for invasives to access than most places, human structures like trails are often an easy gateway for the invaders to get up there. Picture from Abisko, Swedish Lapland.
Trifolium repens
A rainy hike
Bartsia alpina
Cornus suecica
Eriophorum vaginatum
Salix reticulata
Ranunculus glacialis
Oxyria digyna
Overlooking the valley of Laktajakka
Western European species like the red clover (Trifolium pratense) here are often listed as non-native species in mountain regions.
Rubus arcticus
Amiens
Maria without a shirt
Cold!
Cathedral at night
Amiens is filled with cute little houses
The museum behind the beautiful gates
Frozen mirror
Cathedral at night
Winter sun on the Place du Don
The southern side
Sun rising above the water
View from my office window
View from my office window
Sunny but cold, the Quai Bélu
Le Club d’Aviron in winter weather
Just outside of Amiens
Gargoyle planning to eat the cathedral
Cathedral at night
Almost cold enough for ice-skating
Cathedral with a glimpse of spring
Frozen to the bone
Nice architectural curve
Enjoying silence and the morning sun
Colourful mirror
Cathedral seen from the frozen Parc Saint-Pierre
Sunny but cold, the Quai Bélu
Cathedral at night
House on the square before the cathedral
Sweden autumn 2015
Lichen
Sweden summer 2015
View on the 1000 meter plots
Doing research on a cold Arctic morning
Plots flooded by the snowmelt
Flooded by the snowmelt
Meltwater river, racing down the mountain
After a hike, even the most basic house looks cosy. Little hut in the mountains, open for everybody
Snowbridge, maybe don’t cross…
Snowbridge
View from a cliff
Silene acaulis or cushion pink, cutest plant of the Arctic
Two seasons in one image
Steep slope
Hiking down
Narvik Kirche, church of the subarctic
Narvik Kirche
Reindeer on top of the mountain
Narvik Kirche
Summer at the church
Summer flowers
Massive waterfall
Young willow catkins
View from Narvik’s hospital, with lilac flowers
Building a bridge over the fjord will gain al drivers at least an hour
Norwegian fjord
Posing with the water, getting soaked
Minimalistic mountains
Insect investigating our reindeer antler
Catching mosquitoes with our license plate, harvest of the year!
Posing with the plot
Fieldwork on the most beautiful spot of the world
Fieldwork on the most beautiful spot of the world
Summer bridge – still next to the sadly impassable river
Rhinanthus flower in the mountains
Plateau in the valley, beautiful brown
Experimental view from my favourite plot
Salix catkins
Extremely old Betula tree
Waterfall from a cliff
Buttercup is the earliest in spring, here
Rocks!
Alpine views
Views!
Fieldwork
Jumping over rivers
Plot
Golden plover
Angry lemming
Green, the whole north is green!
Snow, so much snow left!
Minimalistic mountain moments
Fieldwork
The research center
Red clover – focal invader
Look at this tiny cute snail!
Massive floods of melting water
Bartsia alpina
Hooray, a toilet!
Dryas octopetala
Lowest elevation plots
Butterball!
That’s a lot of water
Midnight sun is the best
At the lakeside
Beautiful Bistorta vivipara
Don’t fall in the water
Midnight sun
Wild river
Art – made by ages of wild rivers
Baby firework for America’s independence day
Midnight sun at the lake
The Abisko canyon was wilder than ever
That’s a crazy amount of water!
The Abisko canyon was wilder than ever
The Abisko canyon was wilder than ever
Black and white
Stone-man overlooking Abisko
Nothing as soft as a willow catkin
Label and soil temperature sensor attached
I’d drive to the top every day
Reflections
Rocks and clouds
Brave little birch
Brewing our camping poison
Basic camping stuff
Camping in Norway
Home-made temperature houses
Roadside research at its best
Norway is crazy
Horsetail is so funny
Little creek in magical forest
Birches, birches everywhere
Beautiful rock, a gift from the river
Another roadside fellow
Lichen
Ready to rock the summer
Collecting mosses
That’s a crazy old lichen
Tiny tiny piny trees, but old, so old!
Ready to jump into the fjord?
Ready to jump into the fjord?
That’s a spiky stone!
Views on Norwegian fjords
Silene in the mountains
Cute little orchid
Skua
Attacking skua, mind your heads!
Watch out for the attack of the fierce skua!
Black snail
New plot!
Still a lot of snow to melt, but this spot was free for a new plot
Reindeer are better than people
Two seasons in one picture
Let’s see what is happening to the balance in mountains! Is this a starting avalanche, or will it last a bit longer?
Cute little hut
Climbing mountains by car
Softest moss in history
Drosera in the marsh
Hiking in no-man’s land
The clouds are coming
Abisko valley
‘Butterball’
Fieldwork in the tundra
Abisko valley
Little plot
Clouds and sun and mountains
Making soup on a campfire with a view
Little creek on high elevations
Skua on the look-out
Melting snow in a river
Rhodiola rosea and the Törnetrask lake
Beginning of spring
Flooded plots, melting snow, impassible wetness
Ferns and horsetails
Chile 2015
Trips to the field sites were sometimes a real adventure, especially right after snowmelt
Lunch made by our local colleague, with funny bread (tasty as well!)


")


")
")


")


")


")


")


")


