It intuitively makes a lot of sense, doesn’t it? As the climate warms, species should be moving north, racing to stay within the climatic conditions they can survive in.
So, naturally, we thought the same when we set out to monitor long-term shifts in the distribution of forest understory plants, expecting to find a dominant northward migration. Except, that wasn’t at all what we found…
In fact, the actual trends were very striking: forest plants were 2.6 times more likely to move westward than northward. And this wasn’t just some fluke—this finding comes from the ‘ForestREPlot’ database, which compiles repeated surveys of forest understories from across Europe. It’s a remarkable dataset, tracking over 3,000 semi-permanent plots that have been resurveyed over periods ranging from 13 to 67 (!) years.
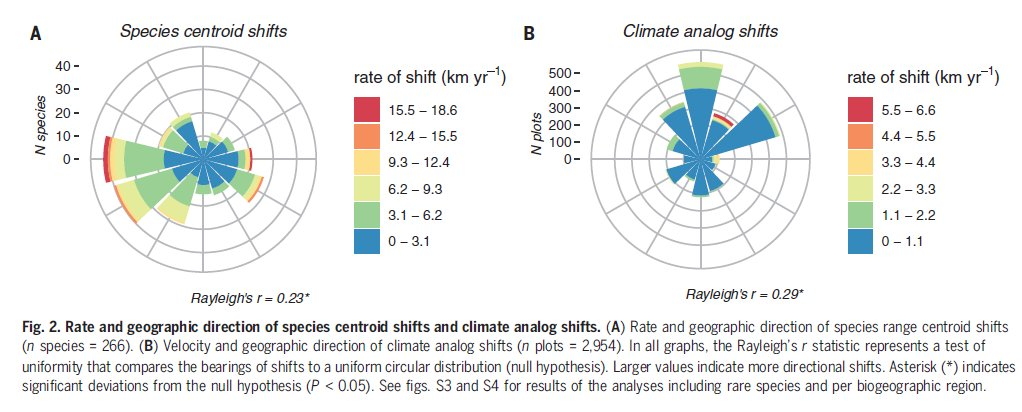
We expected to see species migrating north to track the warming climate. In theory, the wind roses—visualizing shifts in species centroids and climate—should have aligned, with species following the northward drift of suitable climates. But the reality? Starkly different. Instead of predominantly northward shifts, species distributions were veering strongly east-west, often moving faster than the climate itself.
The power of this database lies in its ability to track long-term changes in species distributions across decades of global change. Moreover, by looking at both centroid shifts and colonization/extinction events, we were able to paint a comprehensive picture—not just of range edges, but of how entire species ranges are being reshaped. And the results, now published in Science, tell a clear story: northward movement is being eclipsed by these striking east-west shifts.
So, what’s driving this unexpected trend? After analyzing various potential global change drivers, the main culprit appears to be nitrogen deposition. Indeed, nitrogen-generalists are expanding westward, particularly into regions of Western Europe where nitrogen deposition has been strongest, such as Belgium and the Netherlands. While sulphur pollution from historical acid rain may have played a role, it doesn’t seem to be the primary factor here.
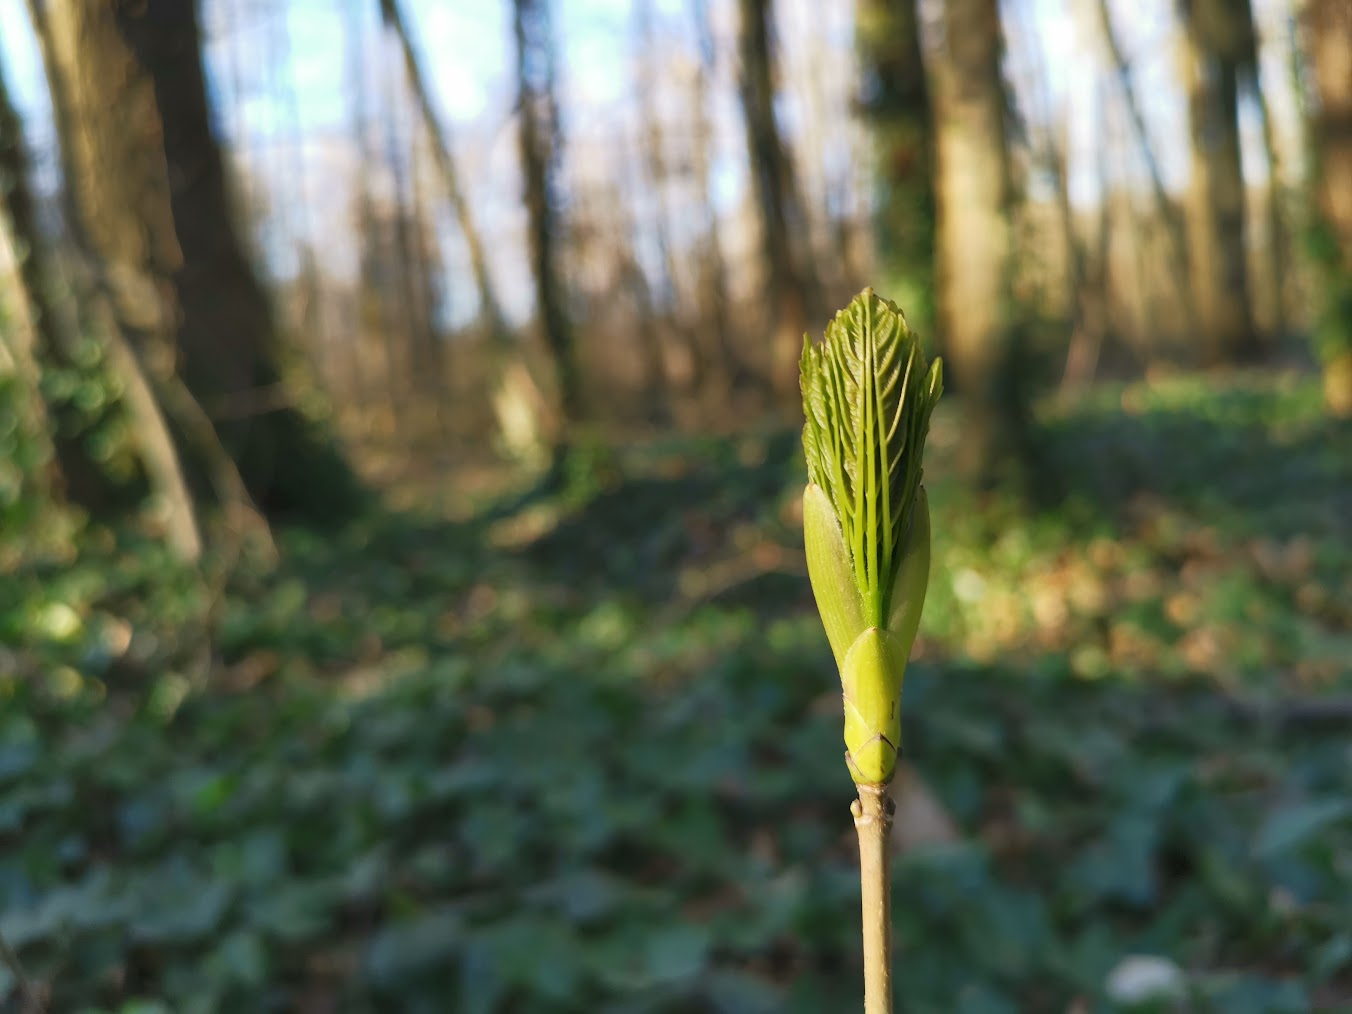
Budding seedling of Acer pseudoplatanus in a Belgian forest – one of the ‘winners’ of the study – strongly expanding its range.
As surprising as these findings may be, they actually align with some of our recent thinking about microclimate. We’ve been hypothesizing that plant movements wouldn’t necessarily mirror macroclimatic trends, since plants experience microclimates—which don’t show the same northward shifts as macroclimate data would suggest. While this microclimate buffering gave us hope, our new study reminds us that we can’t overlook other global change drivers. Their impact on biodiversity may be just as significant—if not more so—than climate change itself.
For the past five years, I have led SoilTemp, the global database of microclimate data. I have witnessed its evolution from humble beginnings to a robust repository housing close to a 100,000 microclimate time series from around the world, several of which are linked to vegetation data from the same locations.
As the database has grown, so too has the variety of use cases. Researchers across microclimate studies, ecology, and beyond are increasingly reaching out to use all that data for a variety of needs. Many, for example, aim to connect in-situ microclimate data from SoilTemp to vegetation data to assess the buffering effects of vegetation or to explore how species distributions are influenced by microclimate.
But what if we could simplify this connection between the two? Currently, data contributors must format and upload their vegetation data to our database, creating redundancy when the same data exists in other databases. This reformatting leads to unnecessary duplication of effort.
Ideally, we wouldn’t need to reformat and resubmit vegetation data stored elsewhere; instead, we could directly access and extract it from those databases themselves!
That is my new BIG dream: to create a way to link existing ecological databases together for easy querying. For example, if I want temperature data from Dutch forests along with vegetation data from the same locations, I envision selecting coordinates and associated parameters on an online dashboard and sending requests to both SoilTemp and any open-access vegetation database that shares the same location. Or if I wish to model the impact of microclimate on root traits, I could reach out to a connected trait database for relevant data from nearby locations.
Wouldn’t that be incredible? I envision a nice and friendly user interface – an RShiny-app perhaps – where users could select locations and receive a list of ecological parameters stored in various open-access databases. These parameters could be from the exact same location, linked by their location name, or from a location nearby, sharing similar coordinates.
So, who’s with me in making this a reality? Are there database managers interested in collaborating on such a ‘SpiderWeb of Ecological Databases’ (SWED)? Or does a similar framework already exist, and we should simply connect SoilTemp to it? (Even better!)
We have some ideas on how to make this happen, but I want to hear from you first! Do you think this would be useful? What features should this imagined ‘SWED’ include? Am I reinventing the wheel, or is this concept as timely as I believe? Please share your thoughts!
The last week of August was marked in red and bold on many calendars: it was the week of the Microclimate Ecology & Biogeography conference, undoubtedly the most important event of the year for global microclimate research.
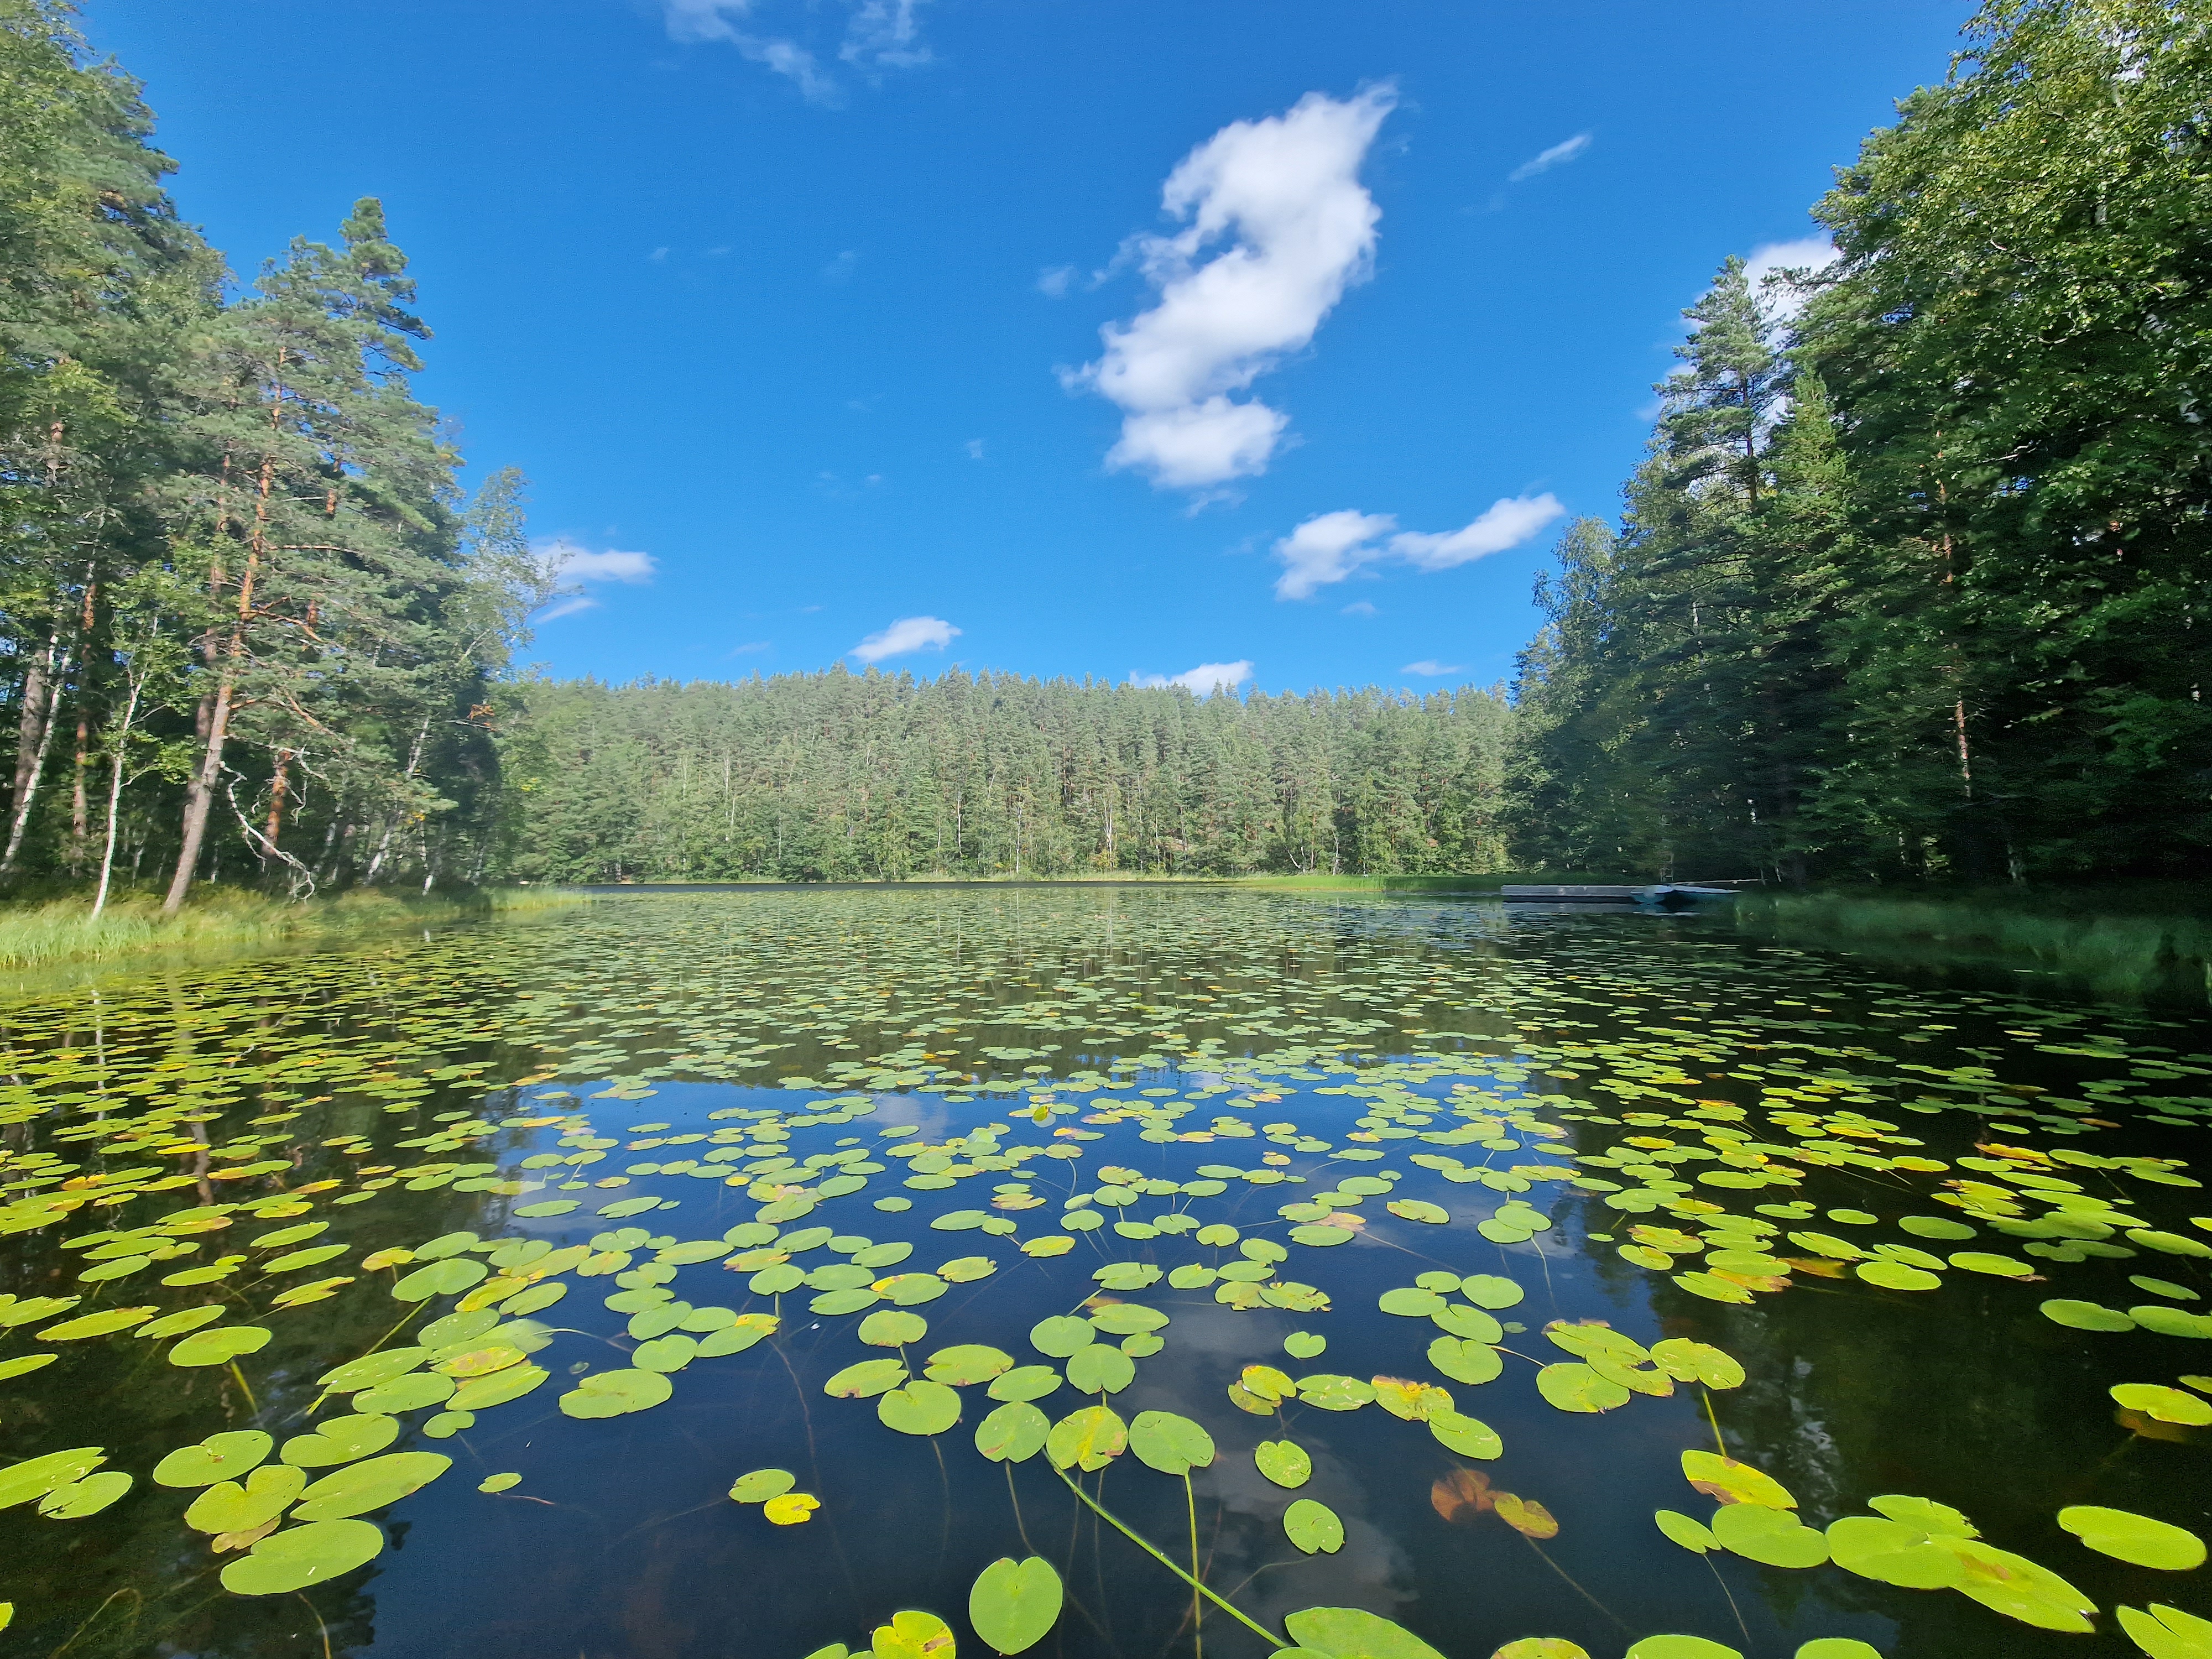
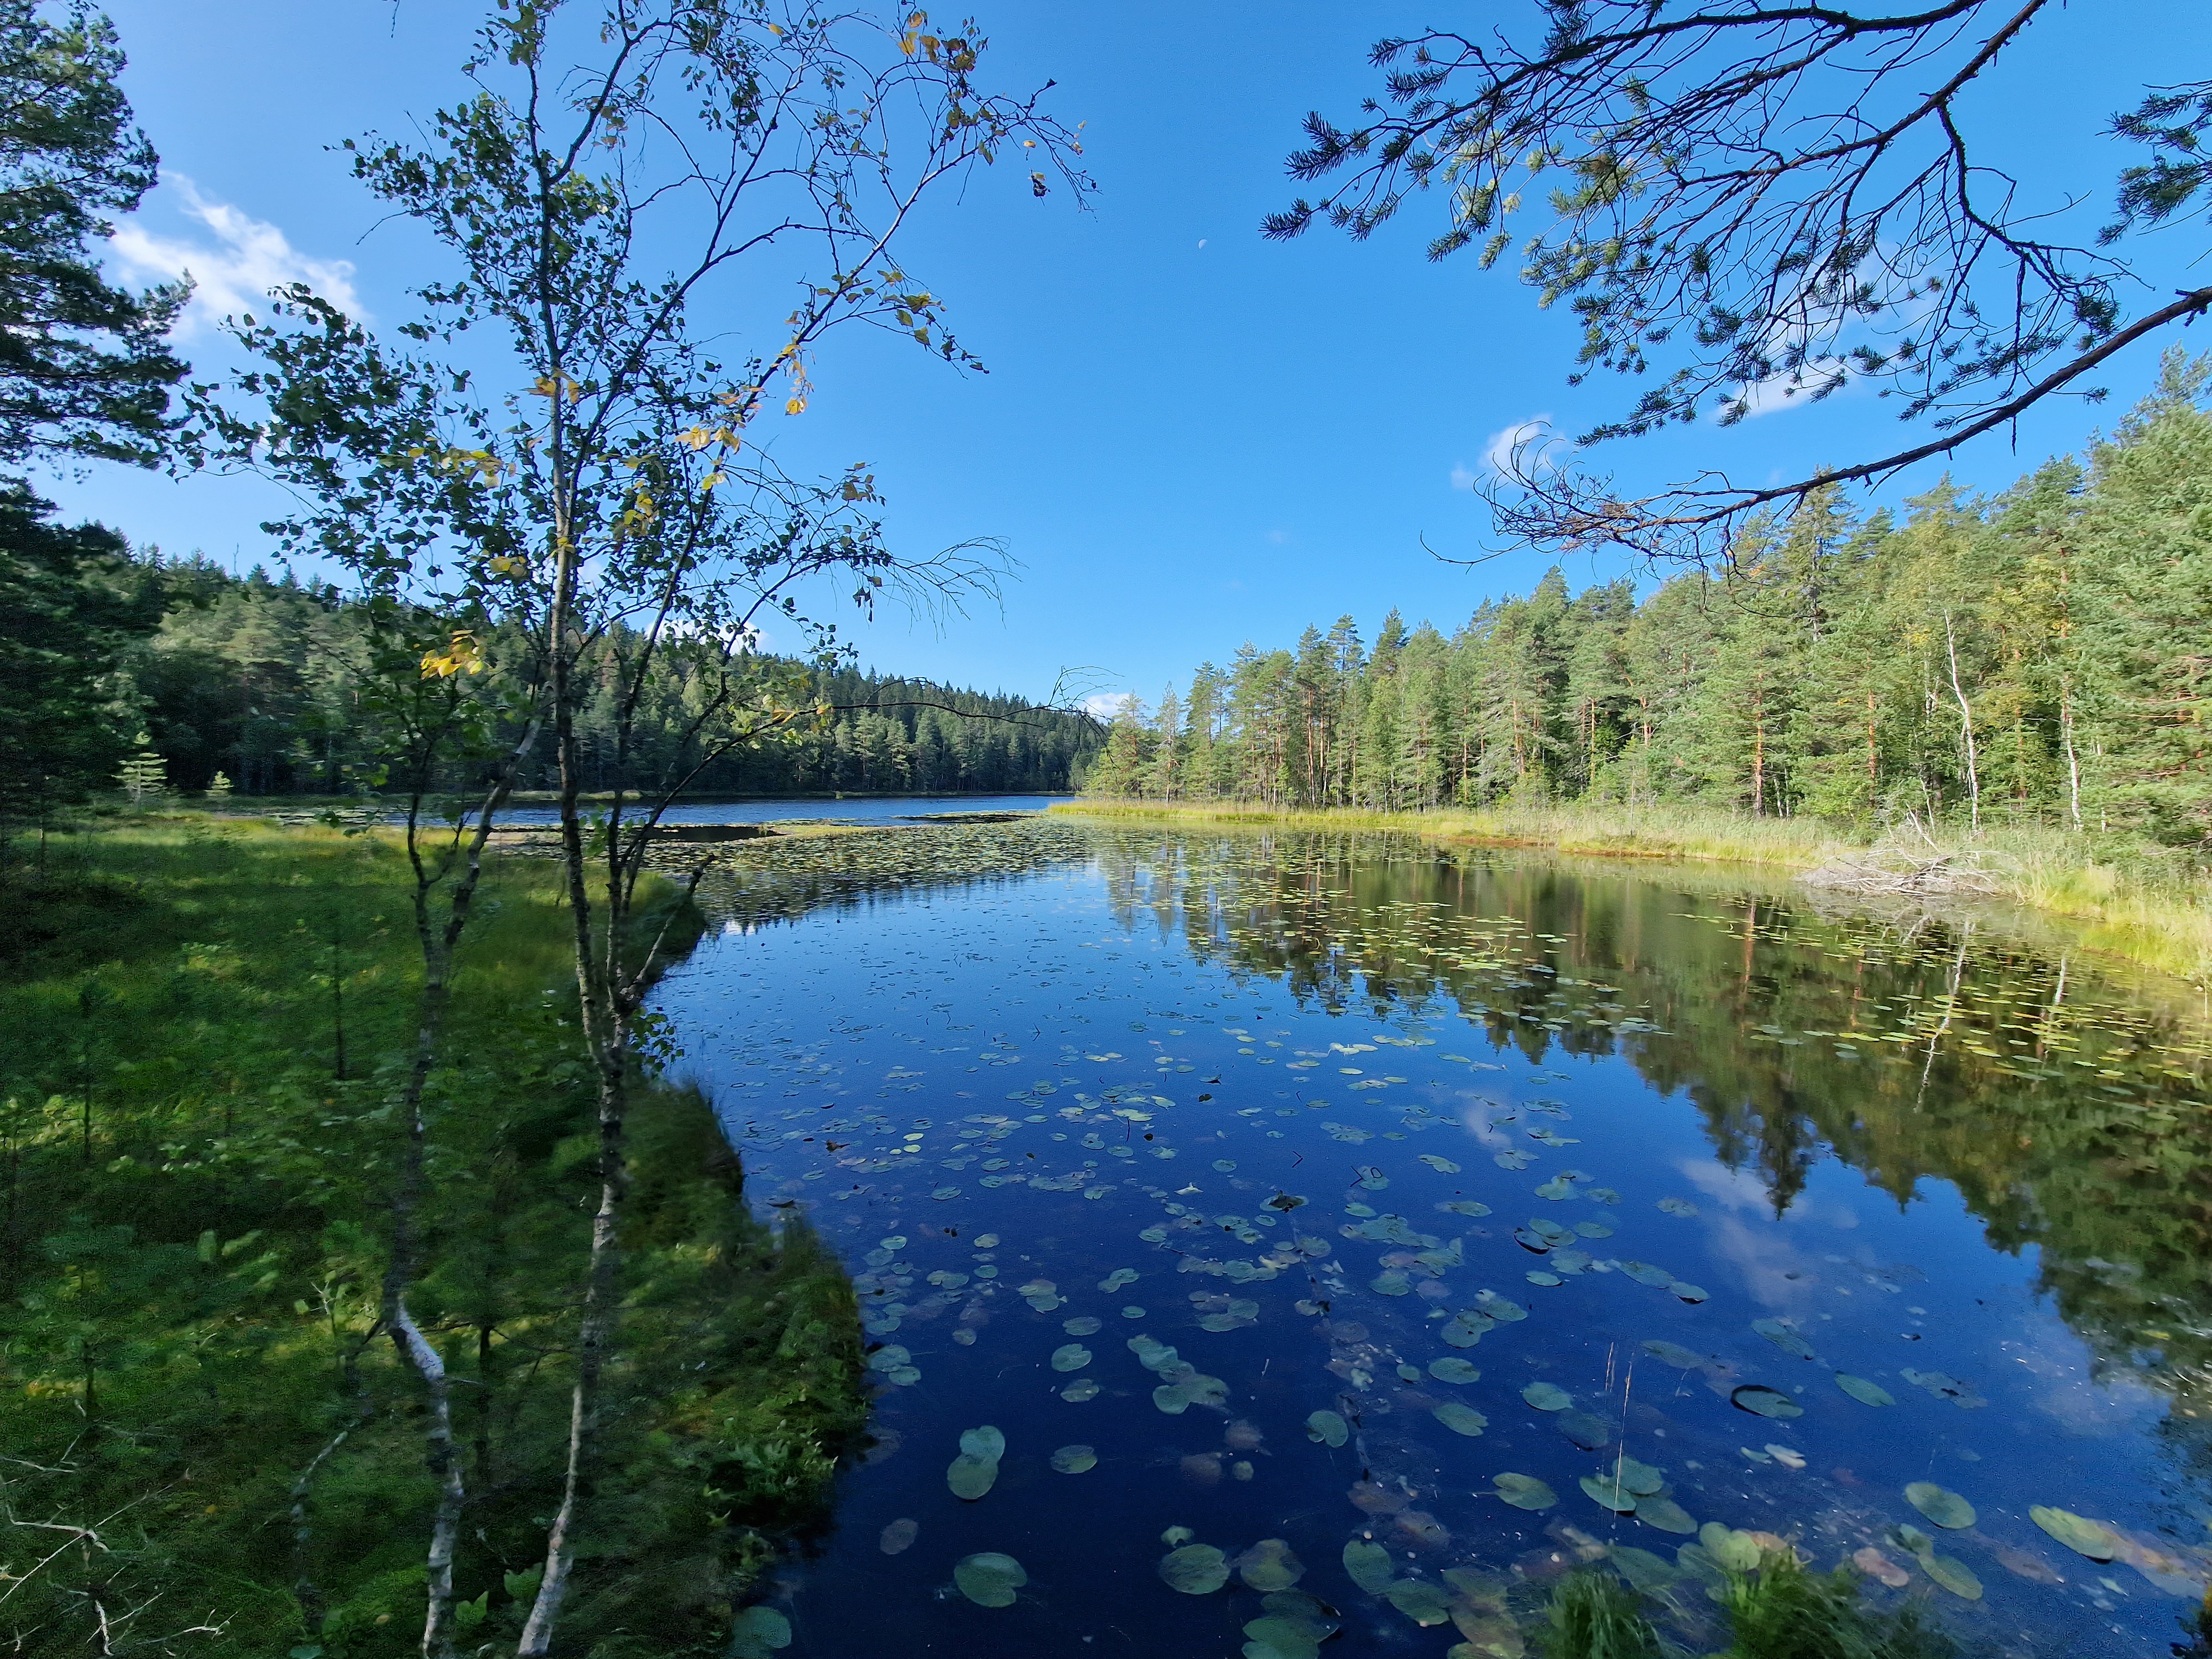
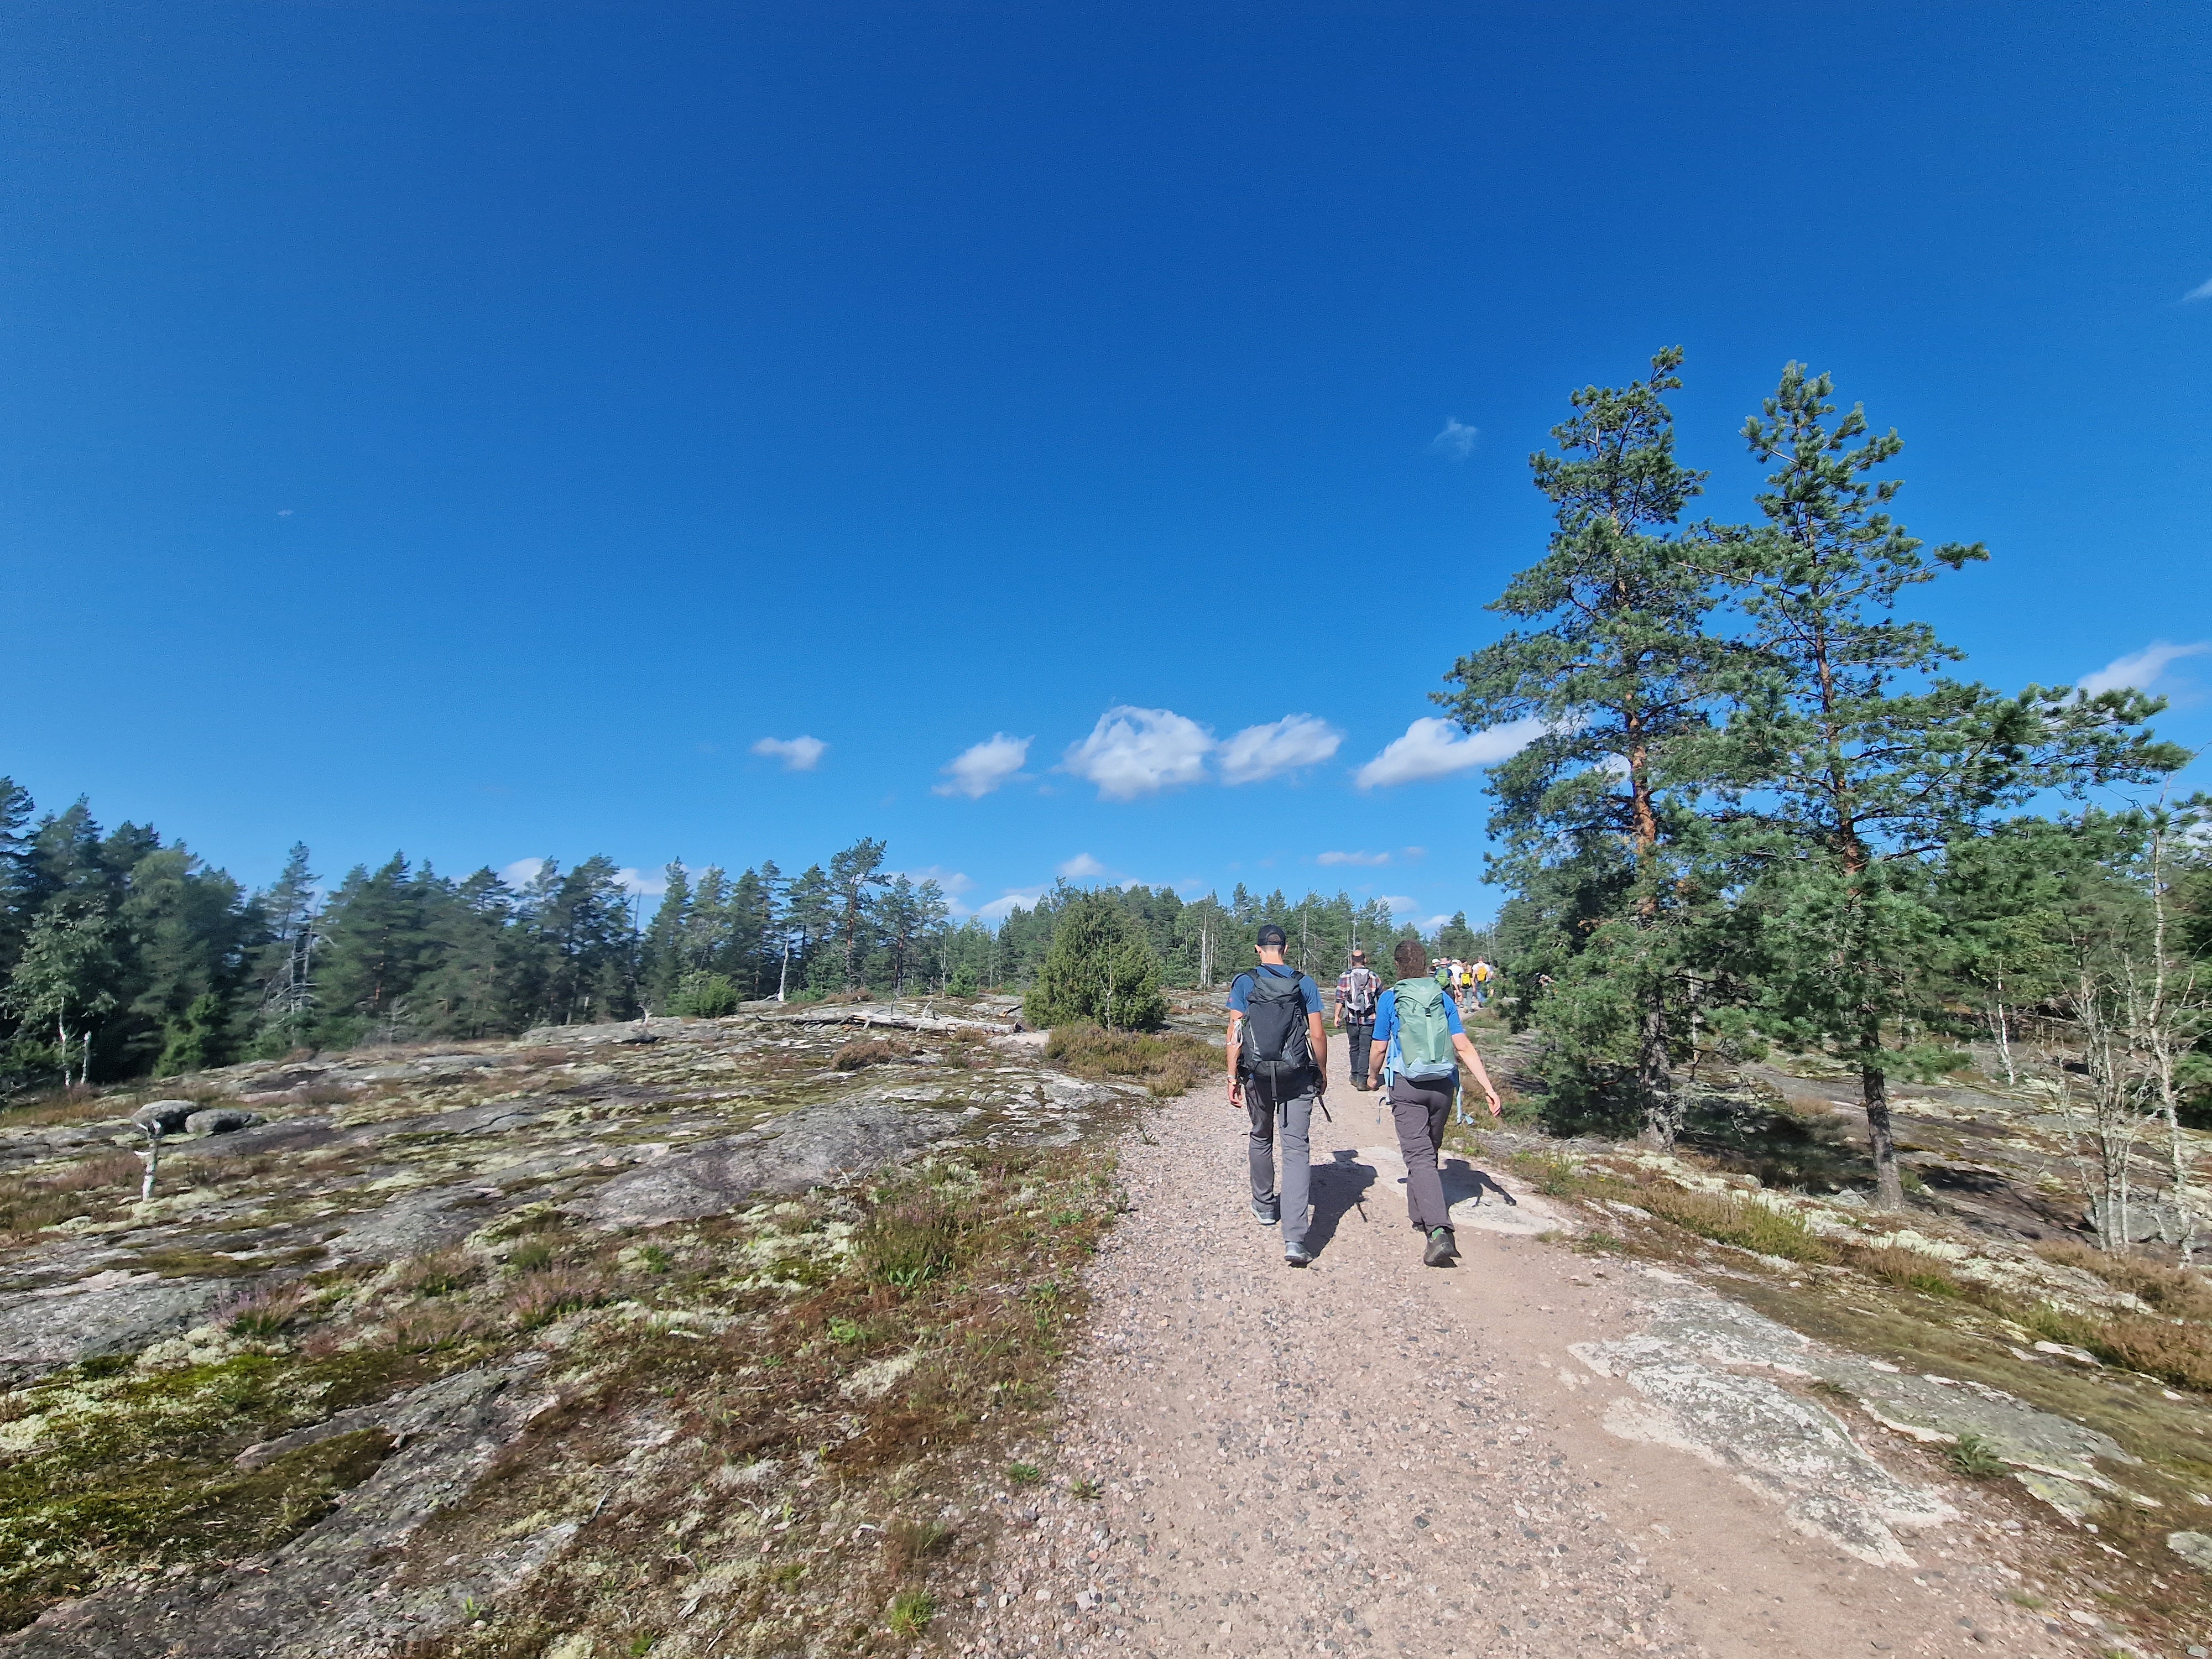
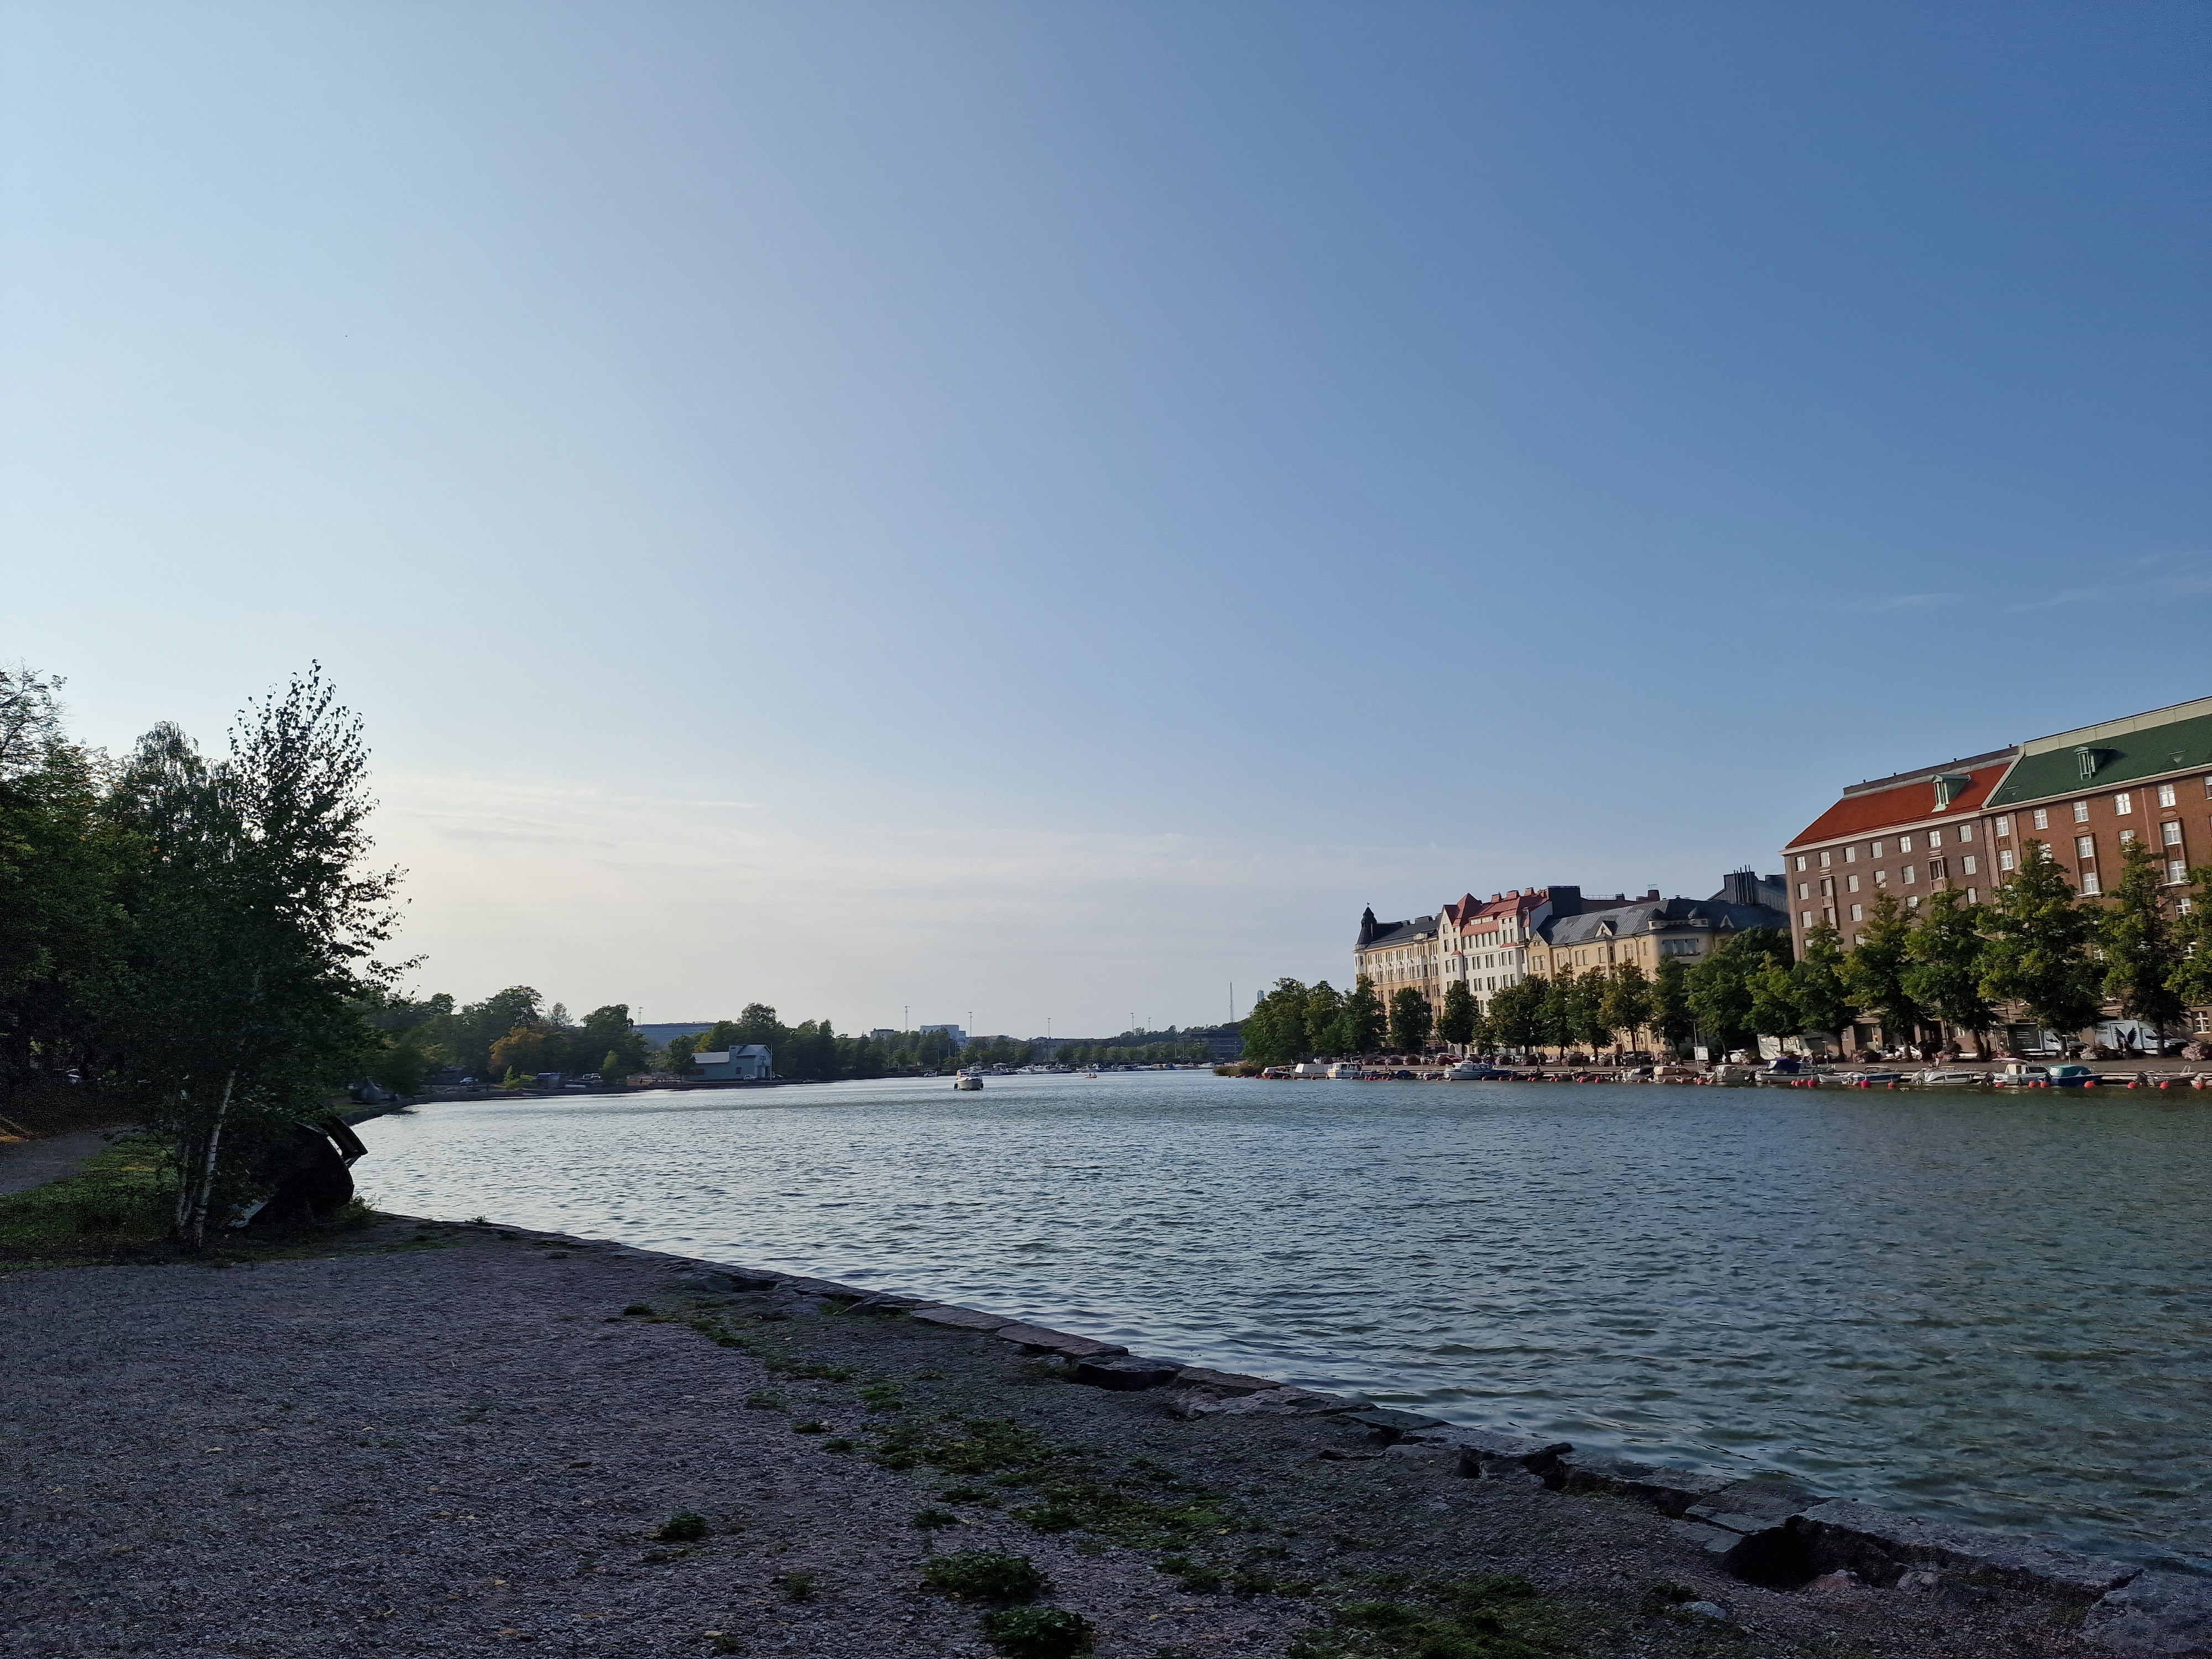
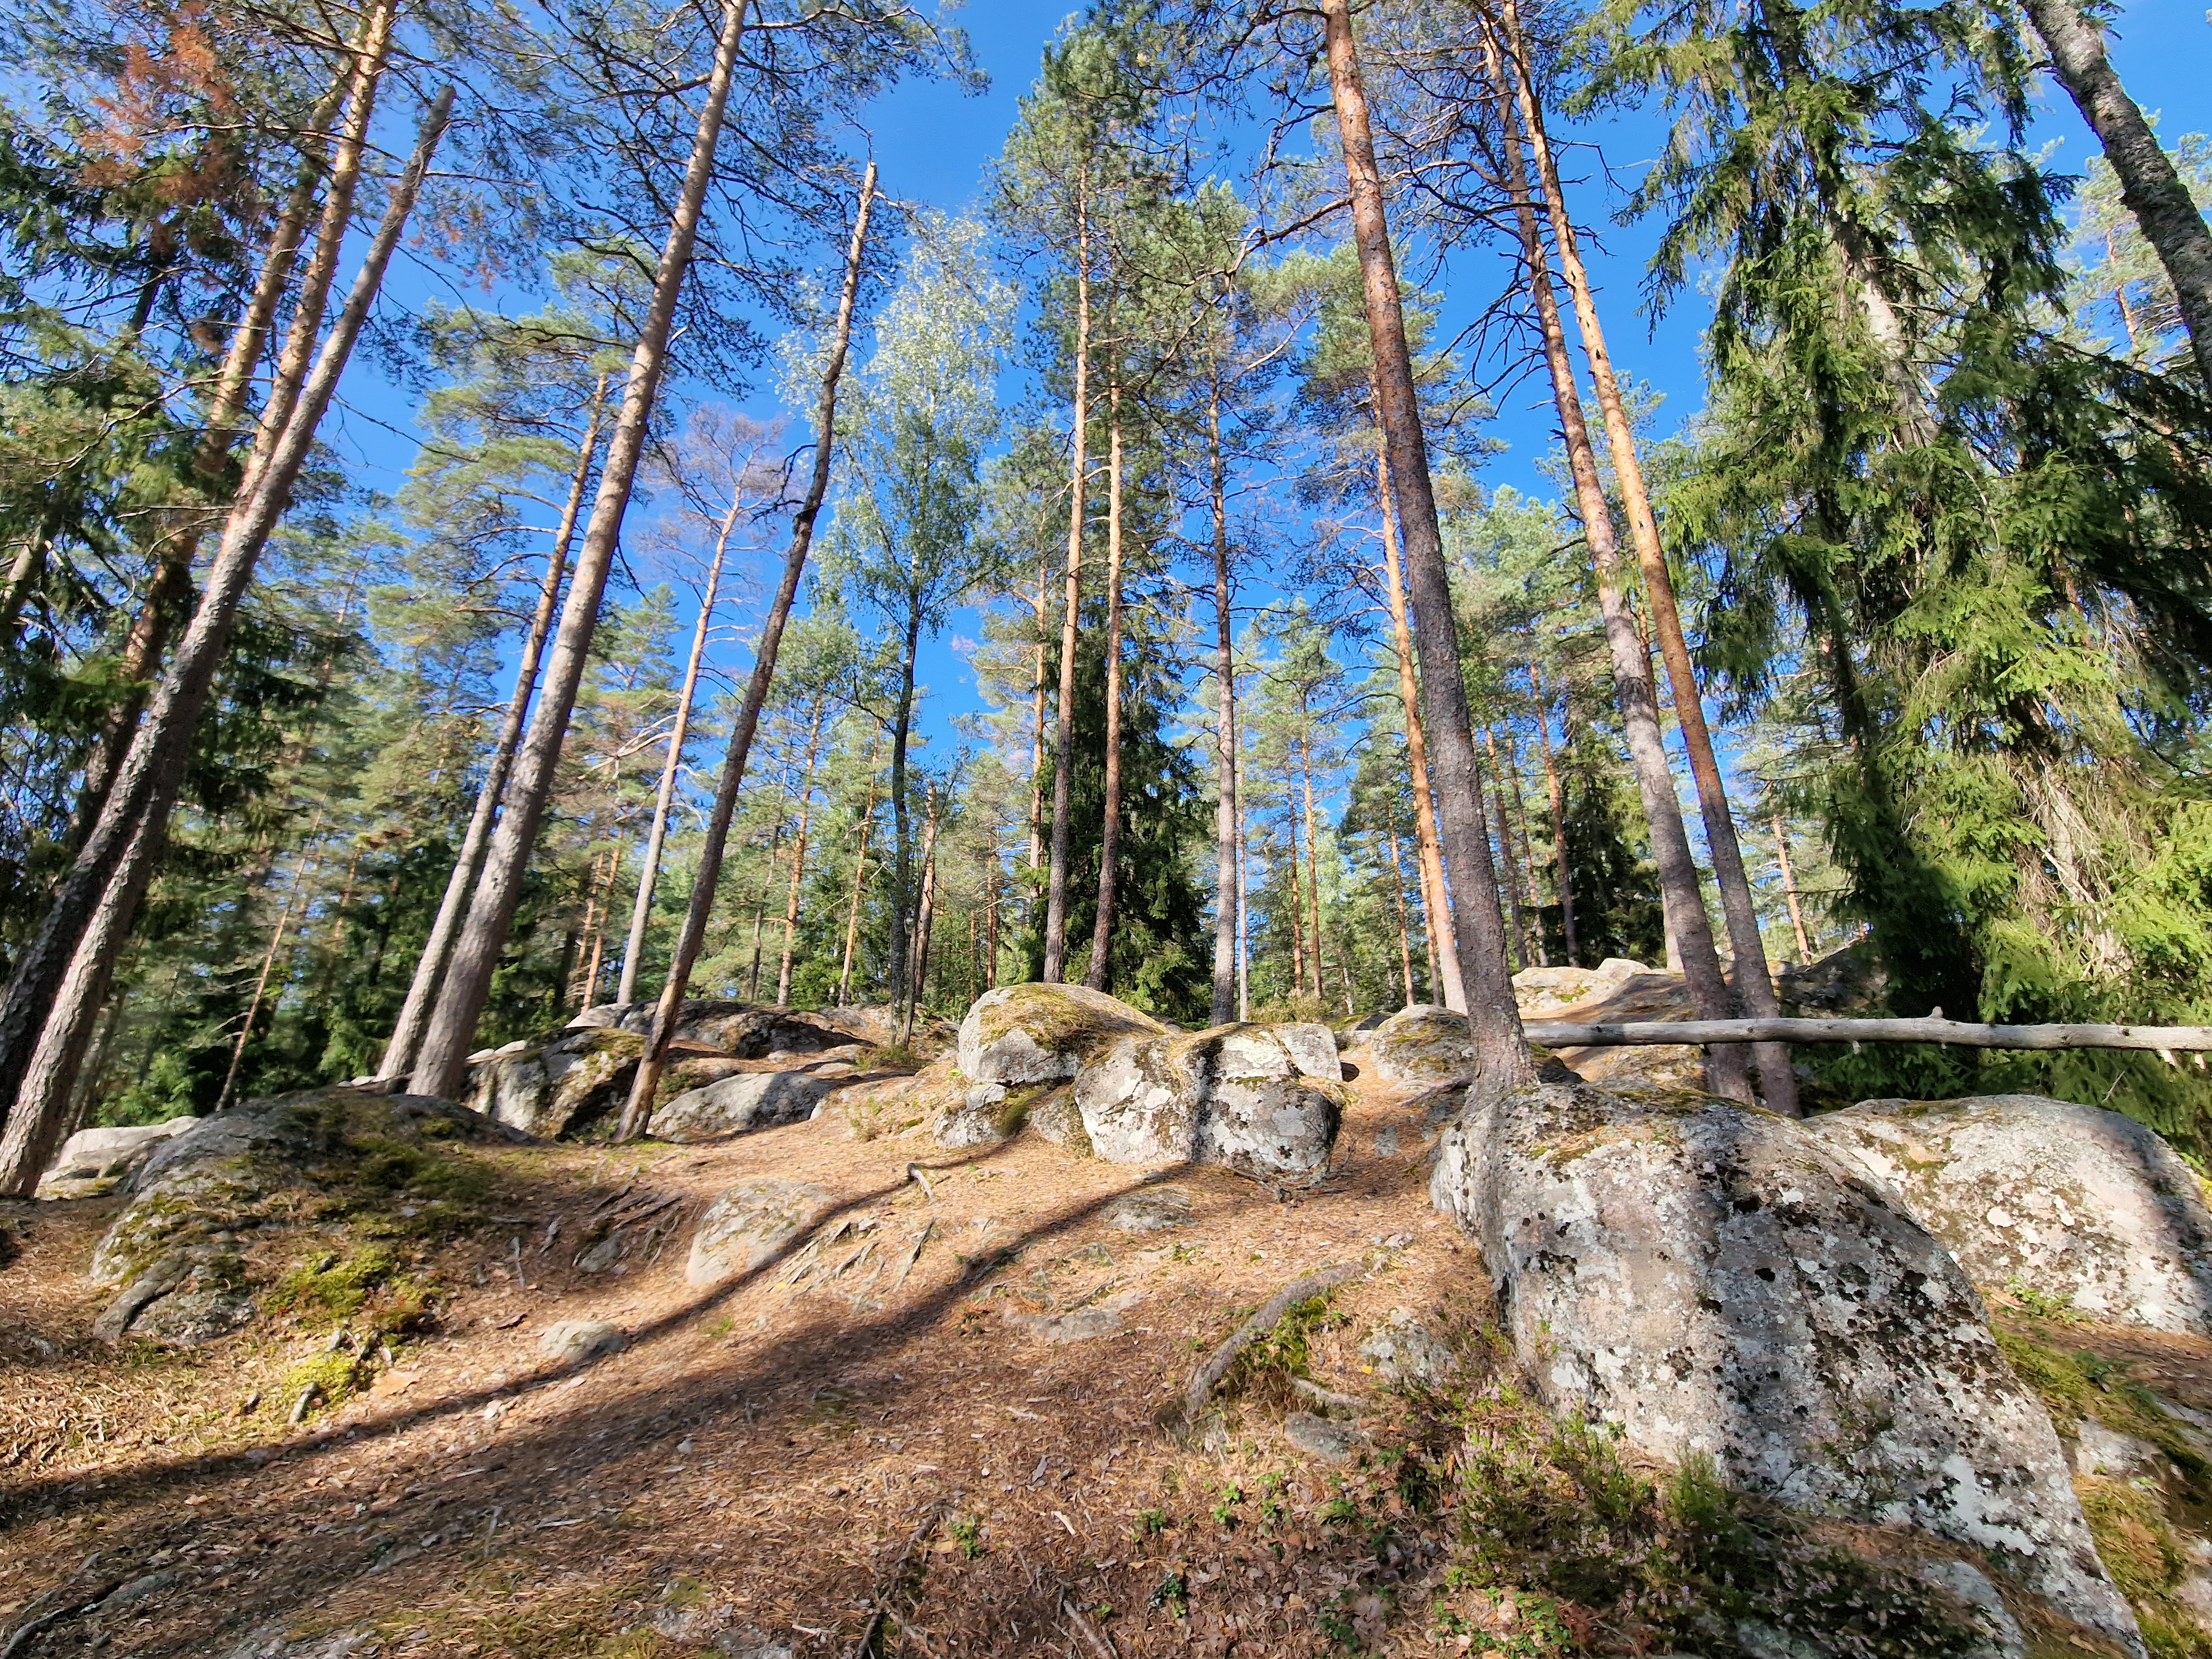
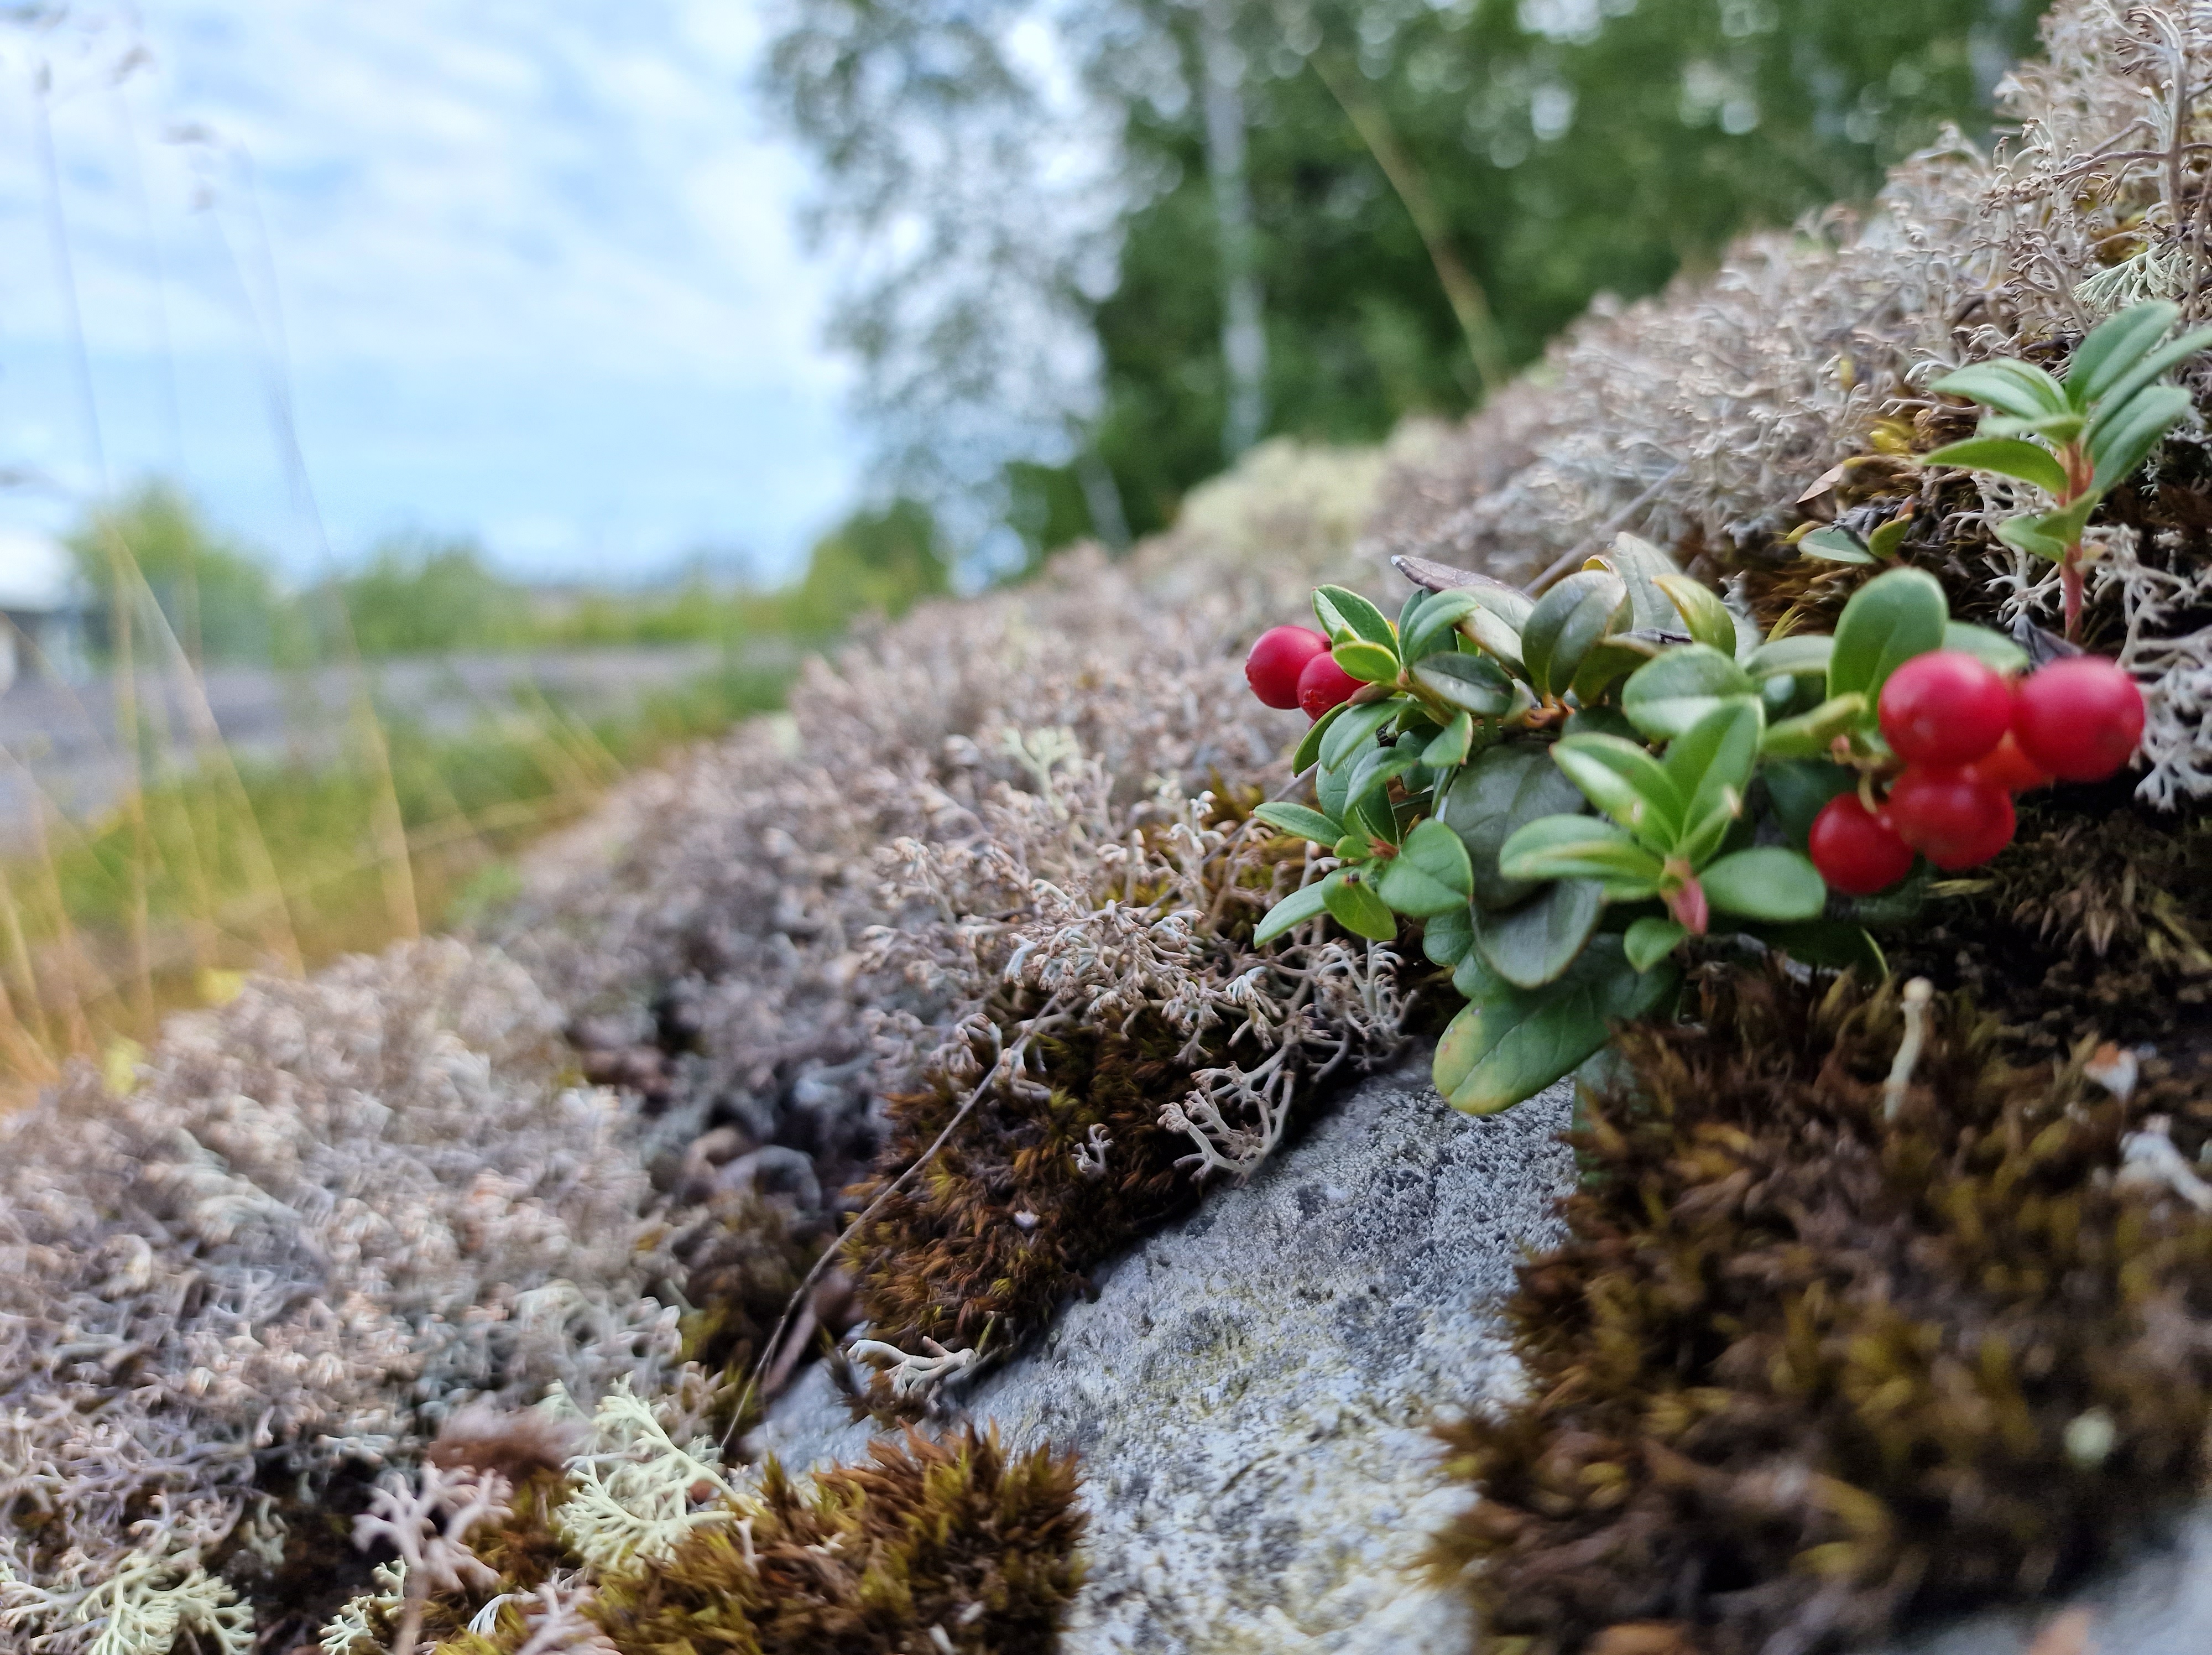
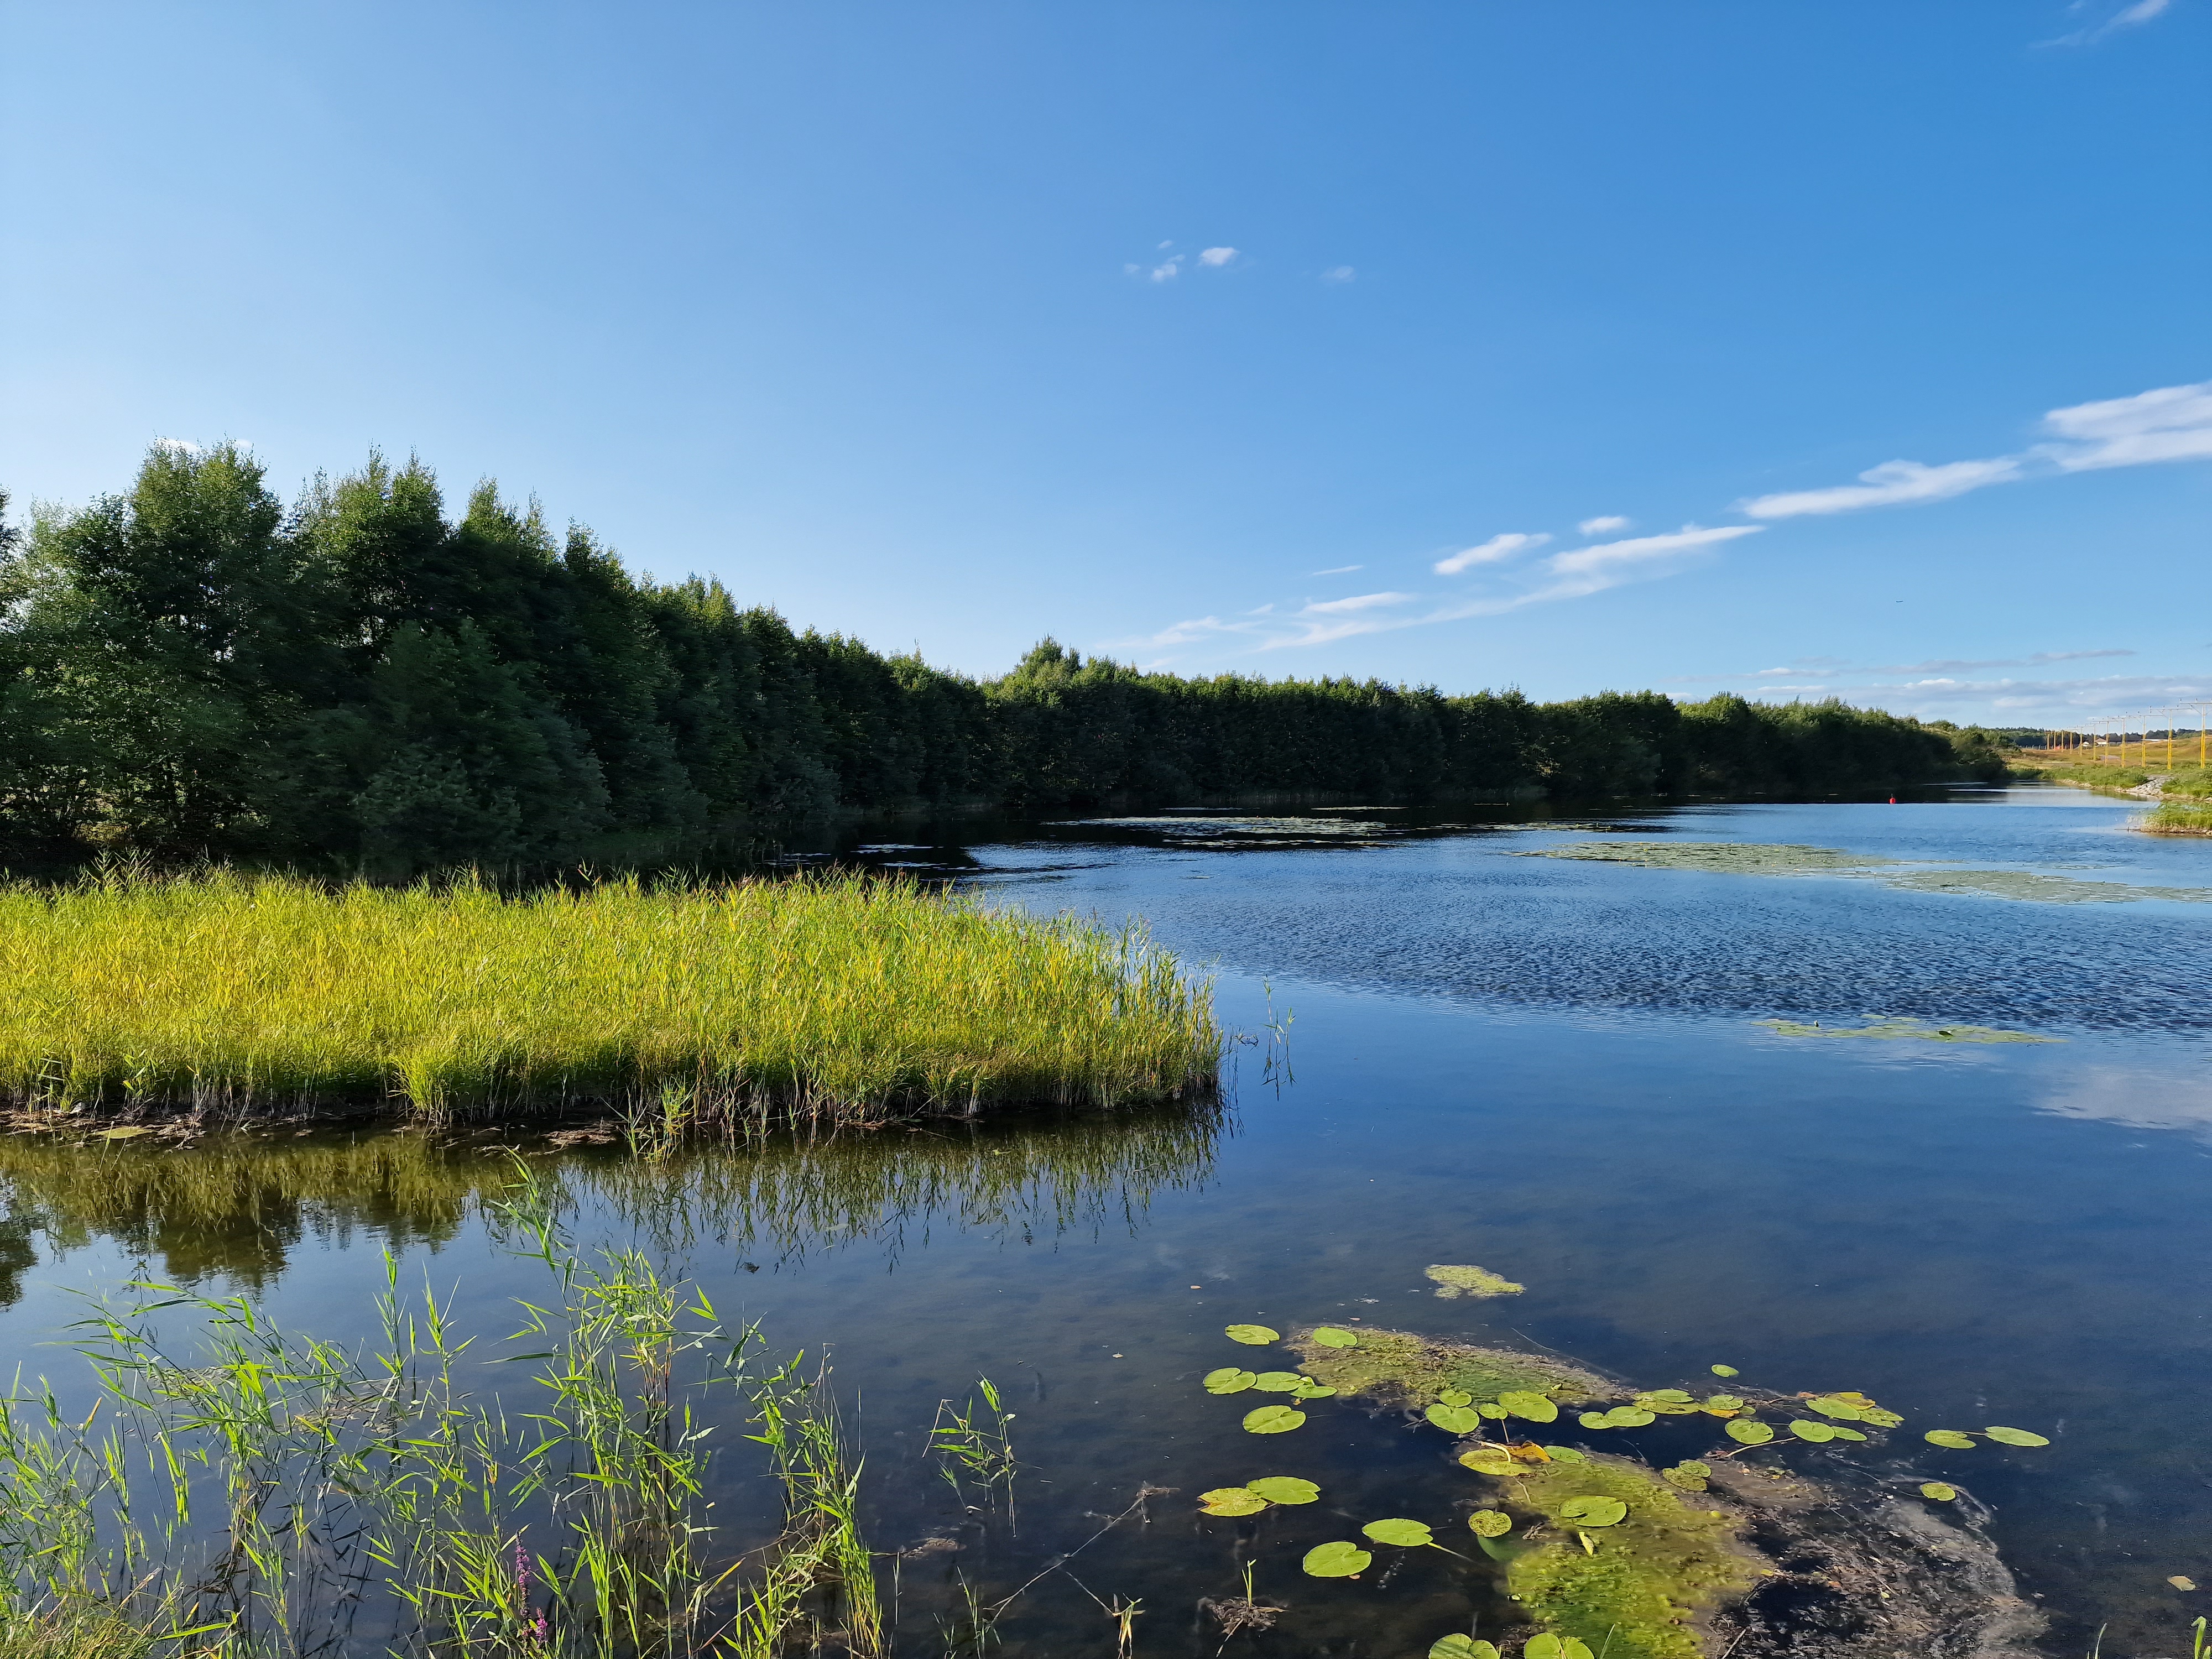
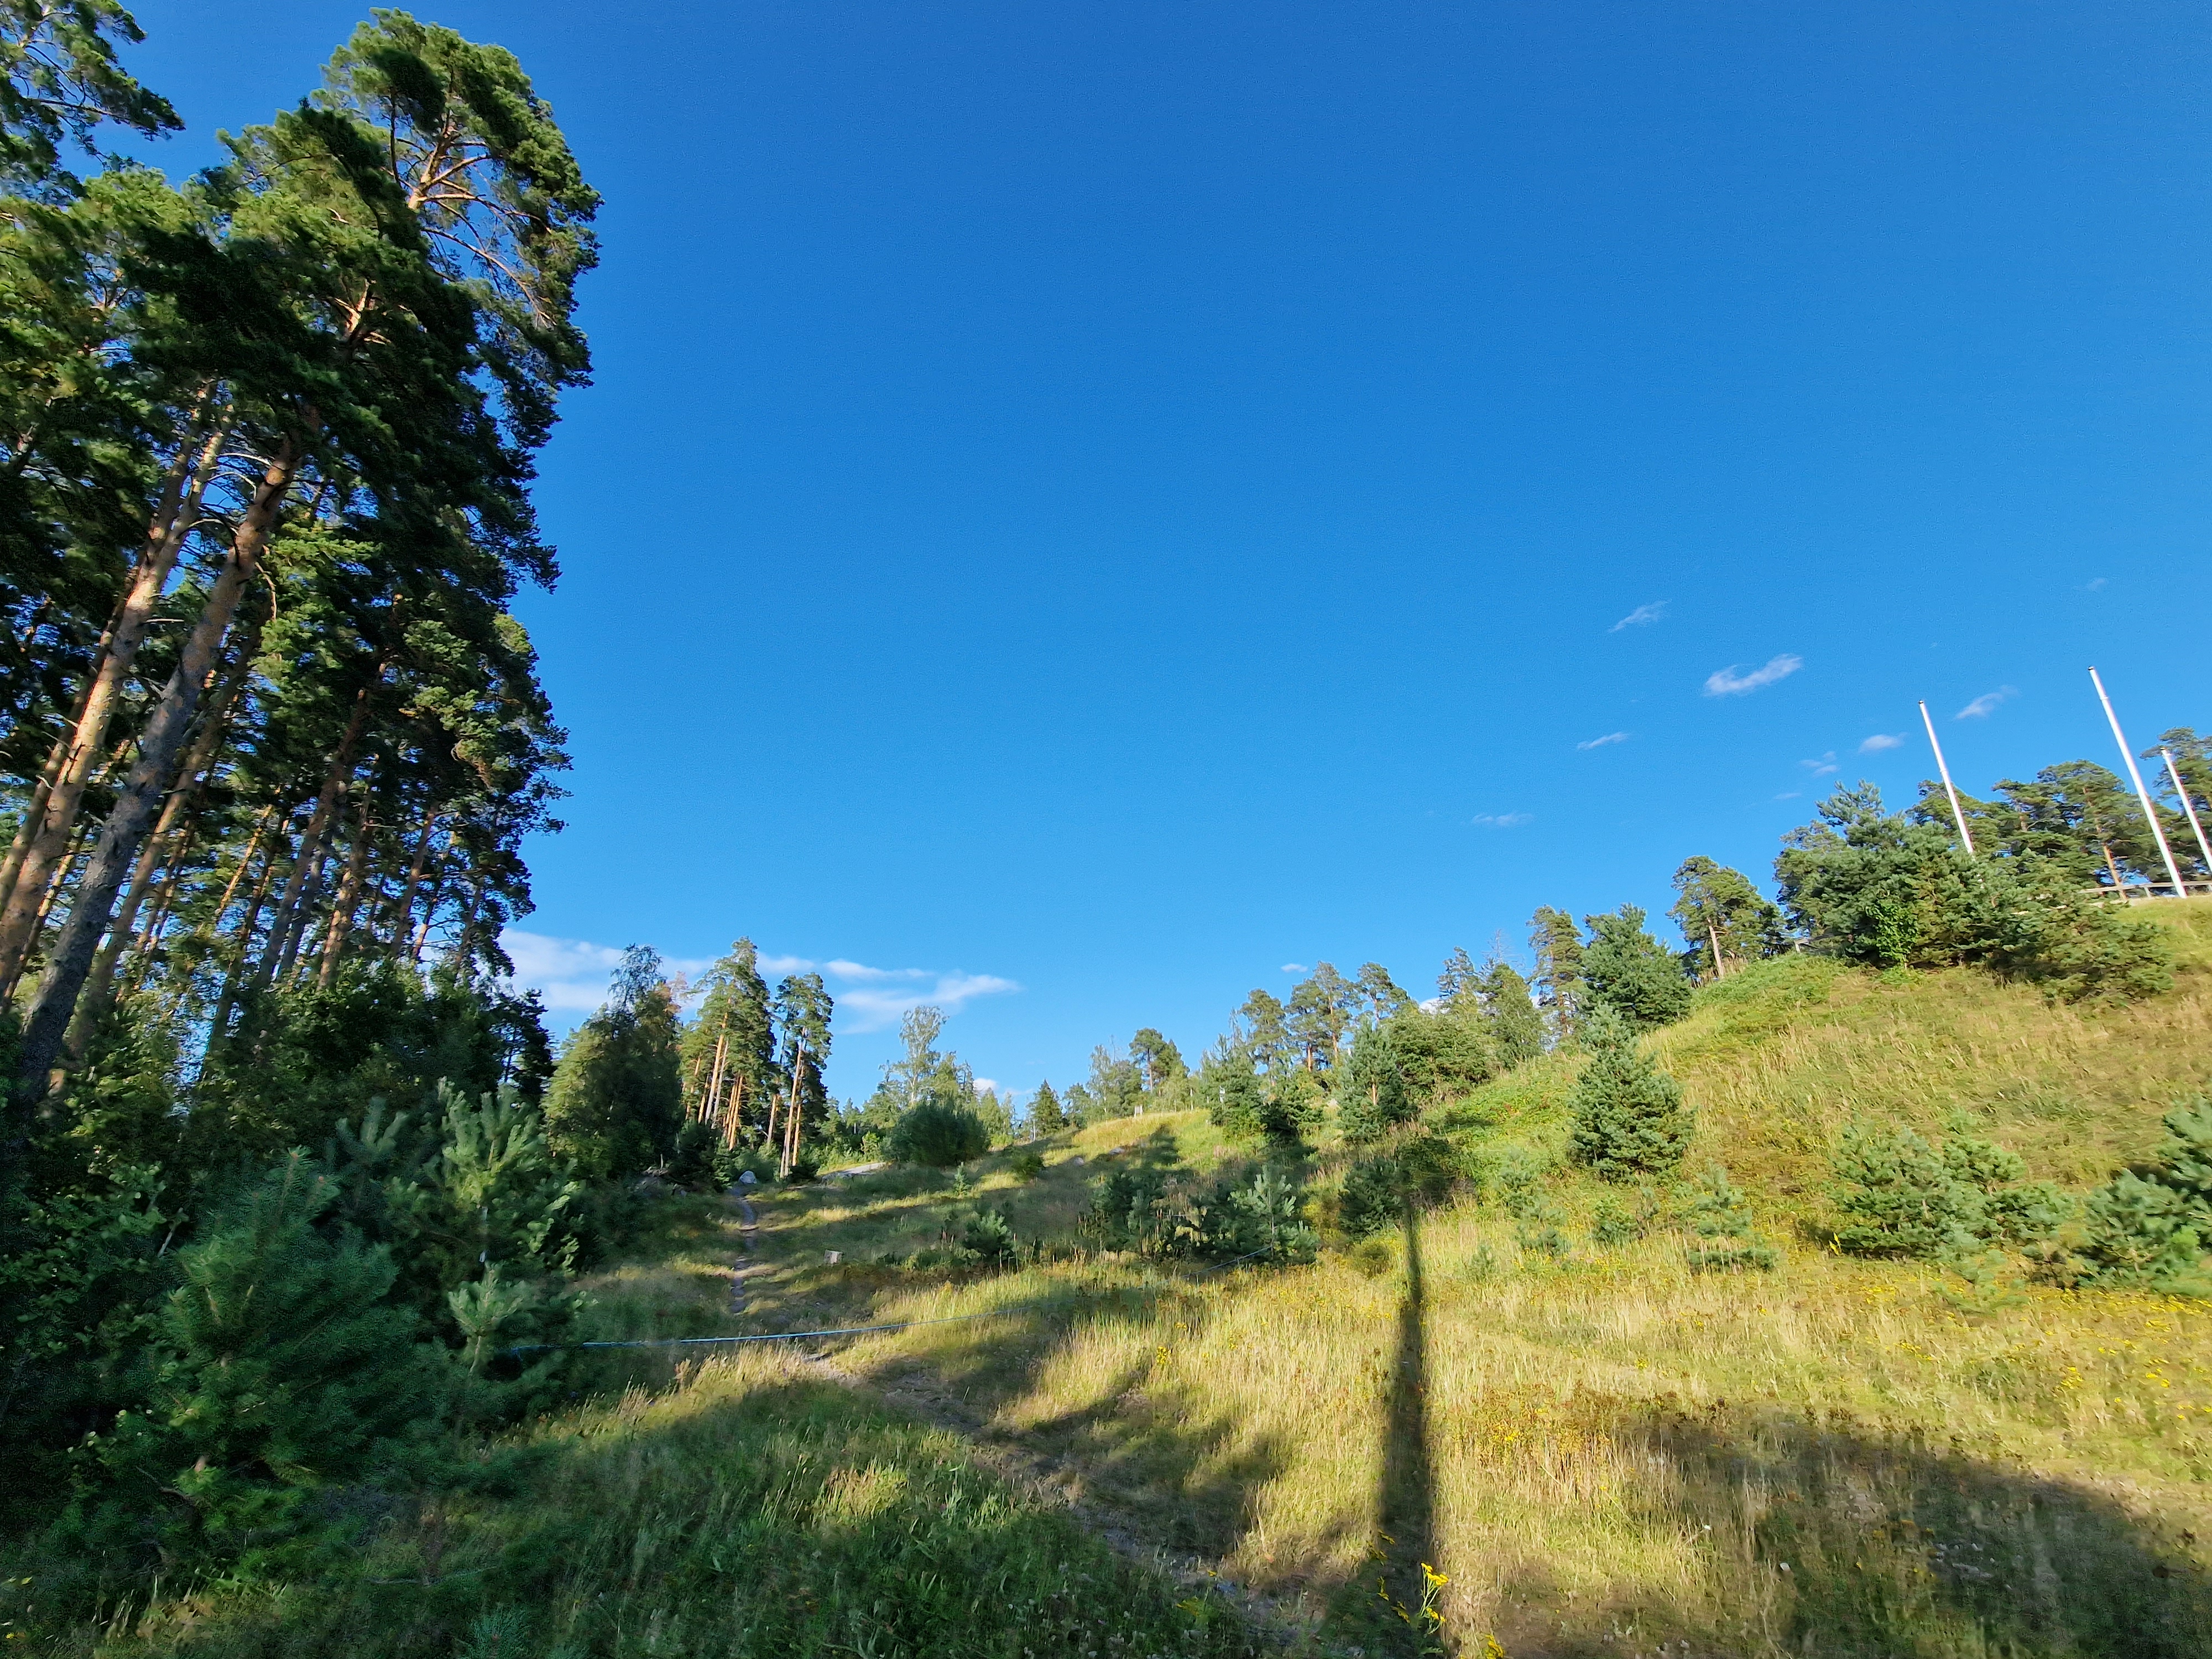
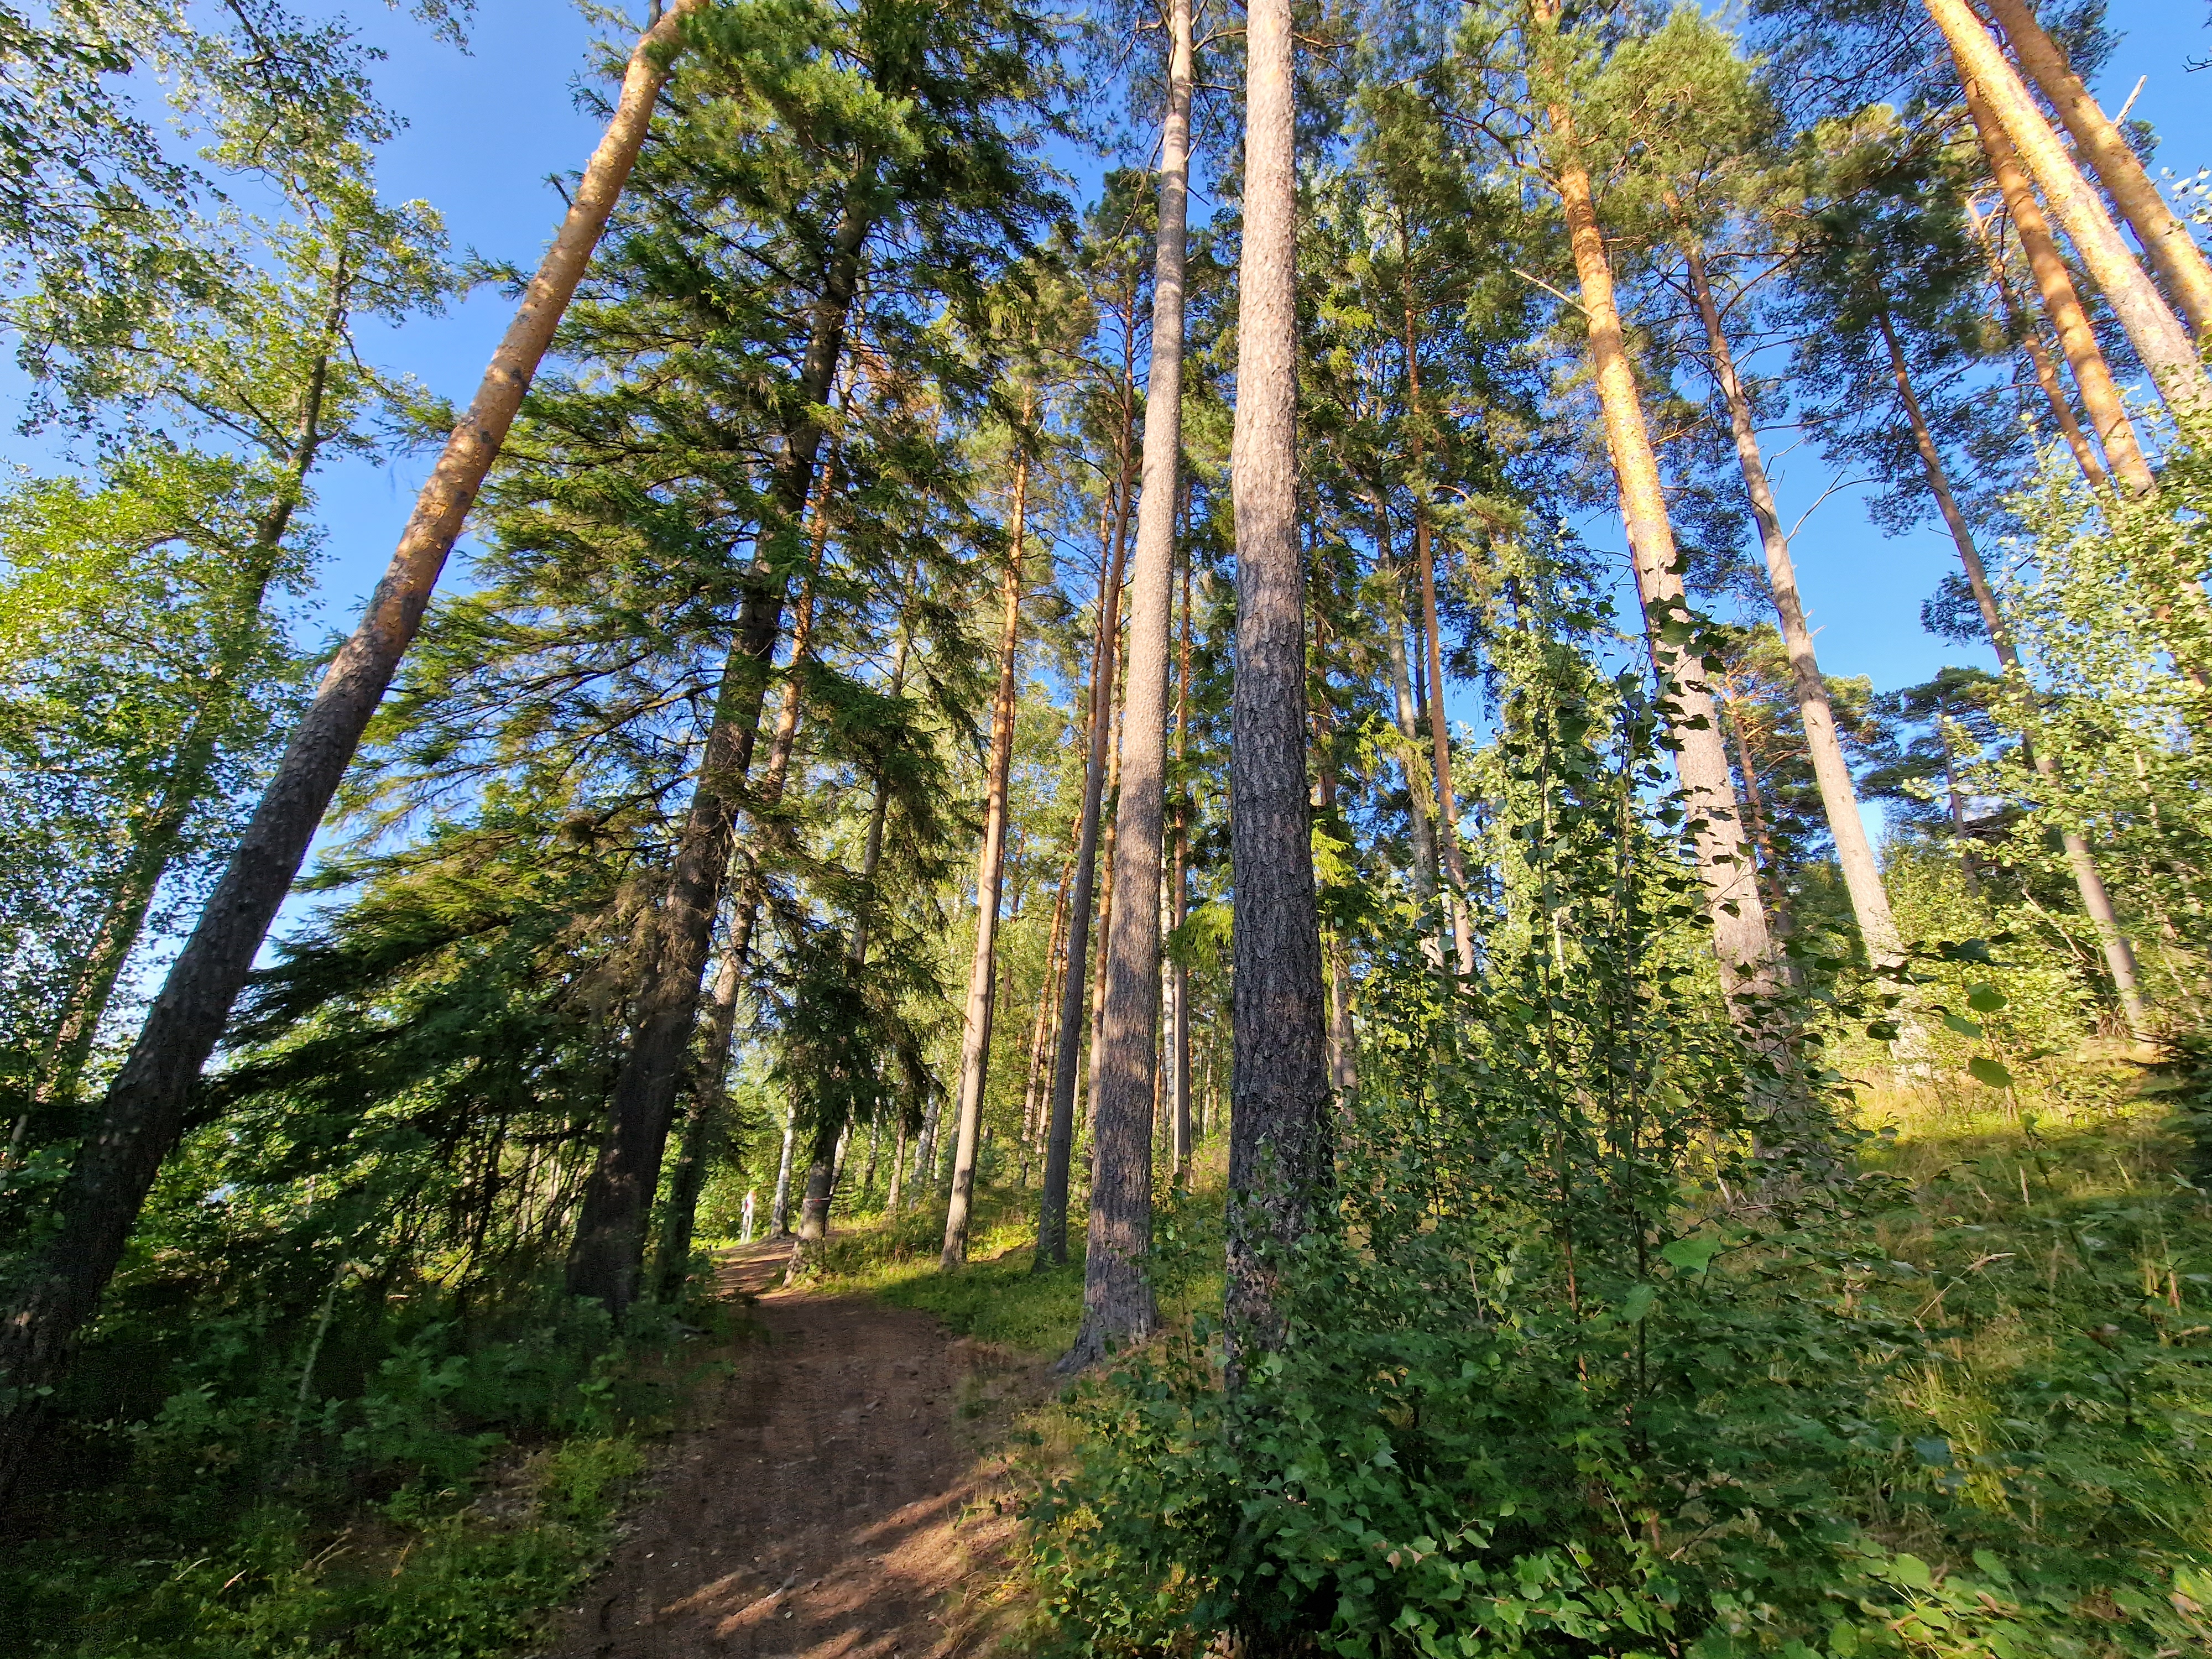
The conference started with a much-appreciated excursion to the lakes, forests and rocks of southern Finland
After this second edition—equally interesting, important, and inspiring as the first one—it’s safe to say that ‘MEB’ has become a tradition. From now on, every two years, the microclimate community will gather for a week of cutting-edge presentations, exhilarating discussions, and simply to enjoy each other’s company. And we’ll all return home better equipped to do even better science.
This blog post is to reflect on the science discussed: what has ME&B 2024 taught me about the state of our field? What have we learned since the last conference, and where are we heading next? Here are a few observations, loosely connected, but hopefully enough to spark inspiration!
Modelling Mayhem
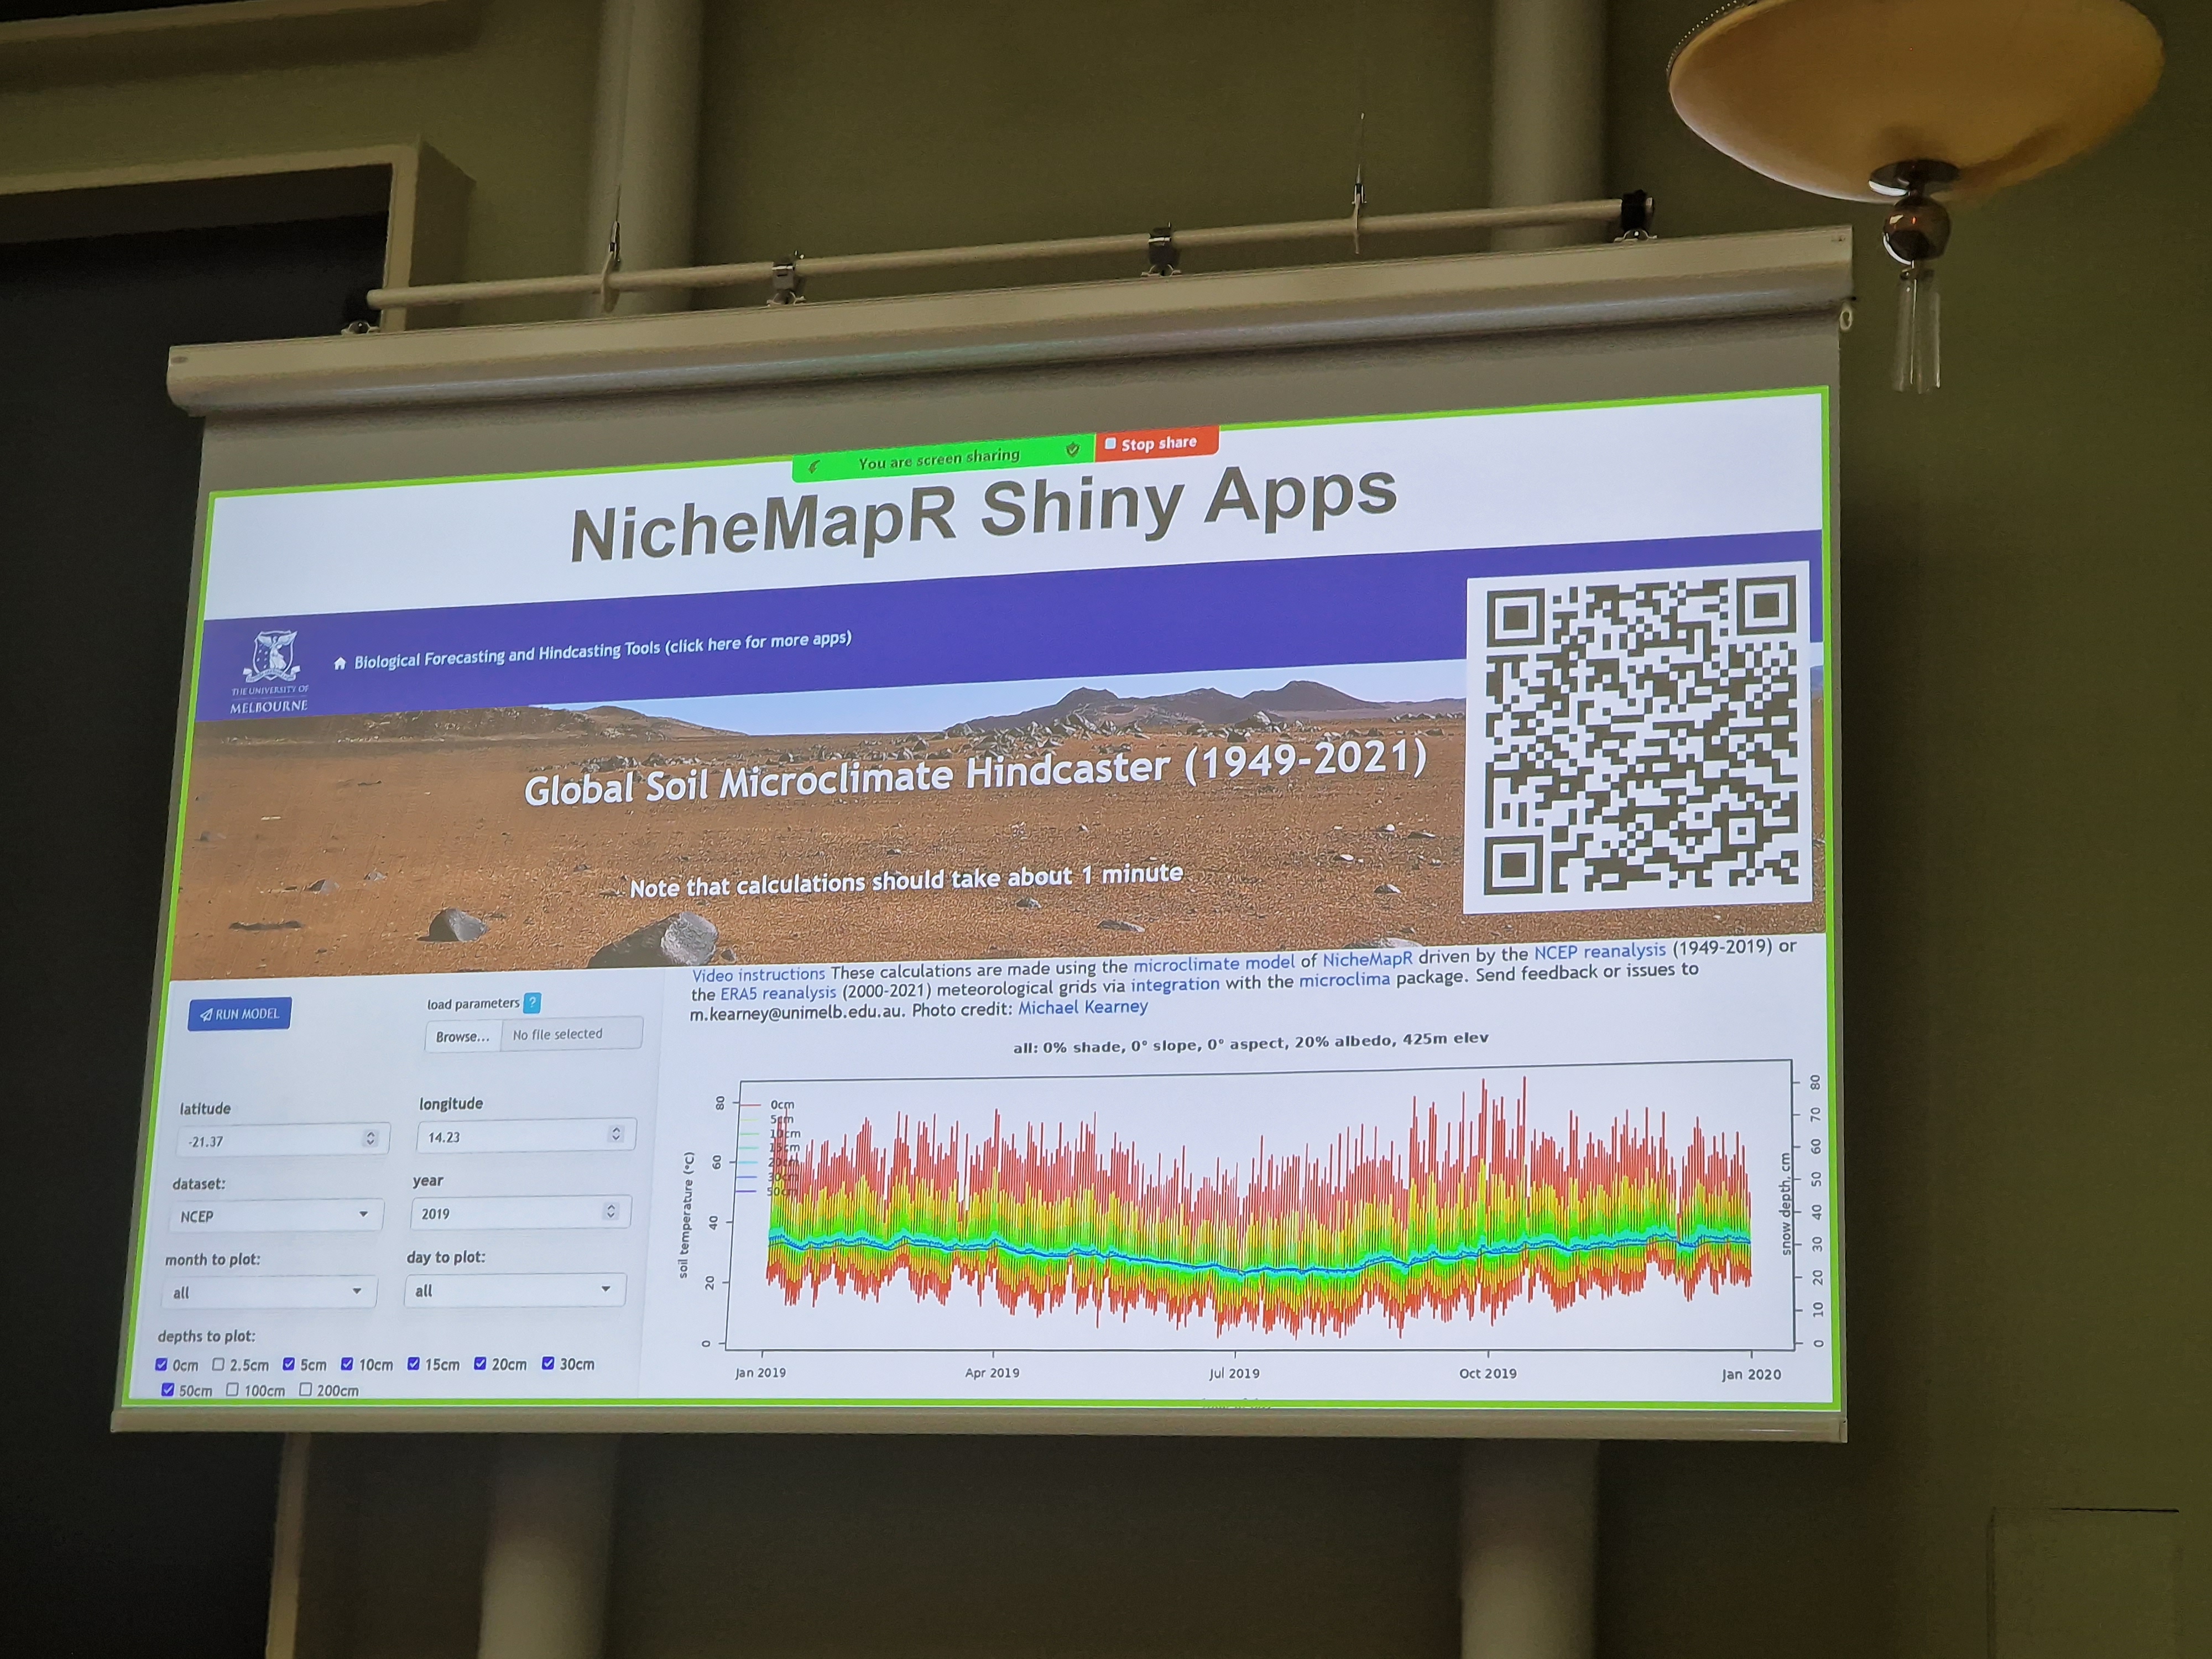
First, and perhaps most significantly: there’s so much exciting progress in modelling! In both of the main categories—mechanistic and correlative models—things are moving rapidly. Mechanistic models are becoming faster, easier to use, more versatile, and more ambitious by the day, zooming in on specific organisms and scaling up to cover larger spatiotemporal extents. Riding the wave of increased computing power, possibilities are emerging that seemed far-fetched only a couple of years ago.
Michael Kearney’s keynote lecture highlighted the great things that can be done with mechanistic microclimate models
But correlative models are keeping pace. Particularly in machine learning, the conference showcased a wide array of new applications, many bigger, better, and bolder than before. Deep learning, for instance, has entered the fray, enabling analyses on increasingly larger datasets. This has finally opened the door to modelling the microclimates of the past and future, moving us closer to answering the biggest question of all: how fast is the microclimate changing?
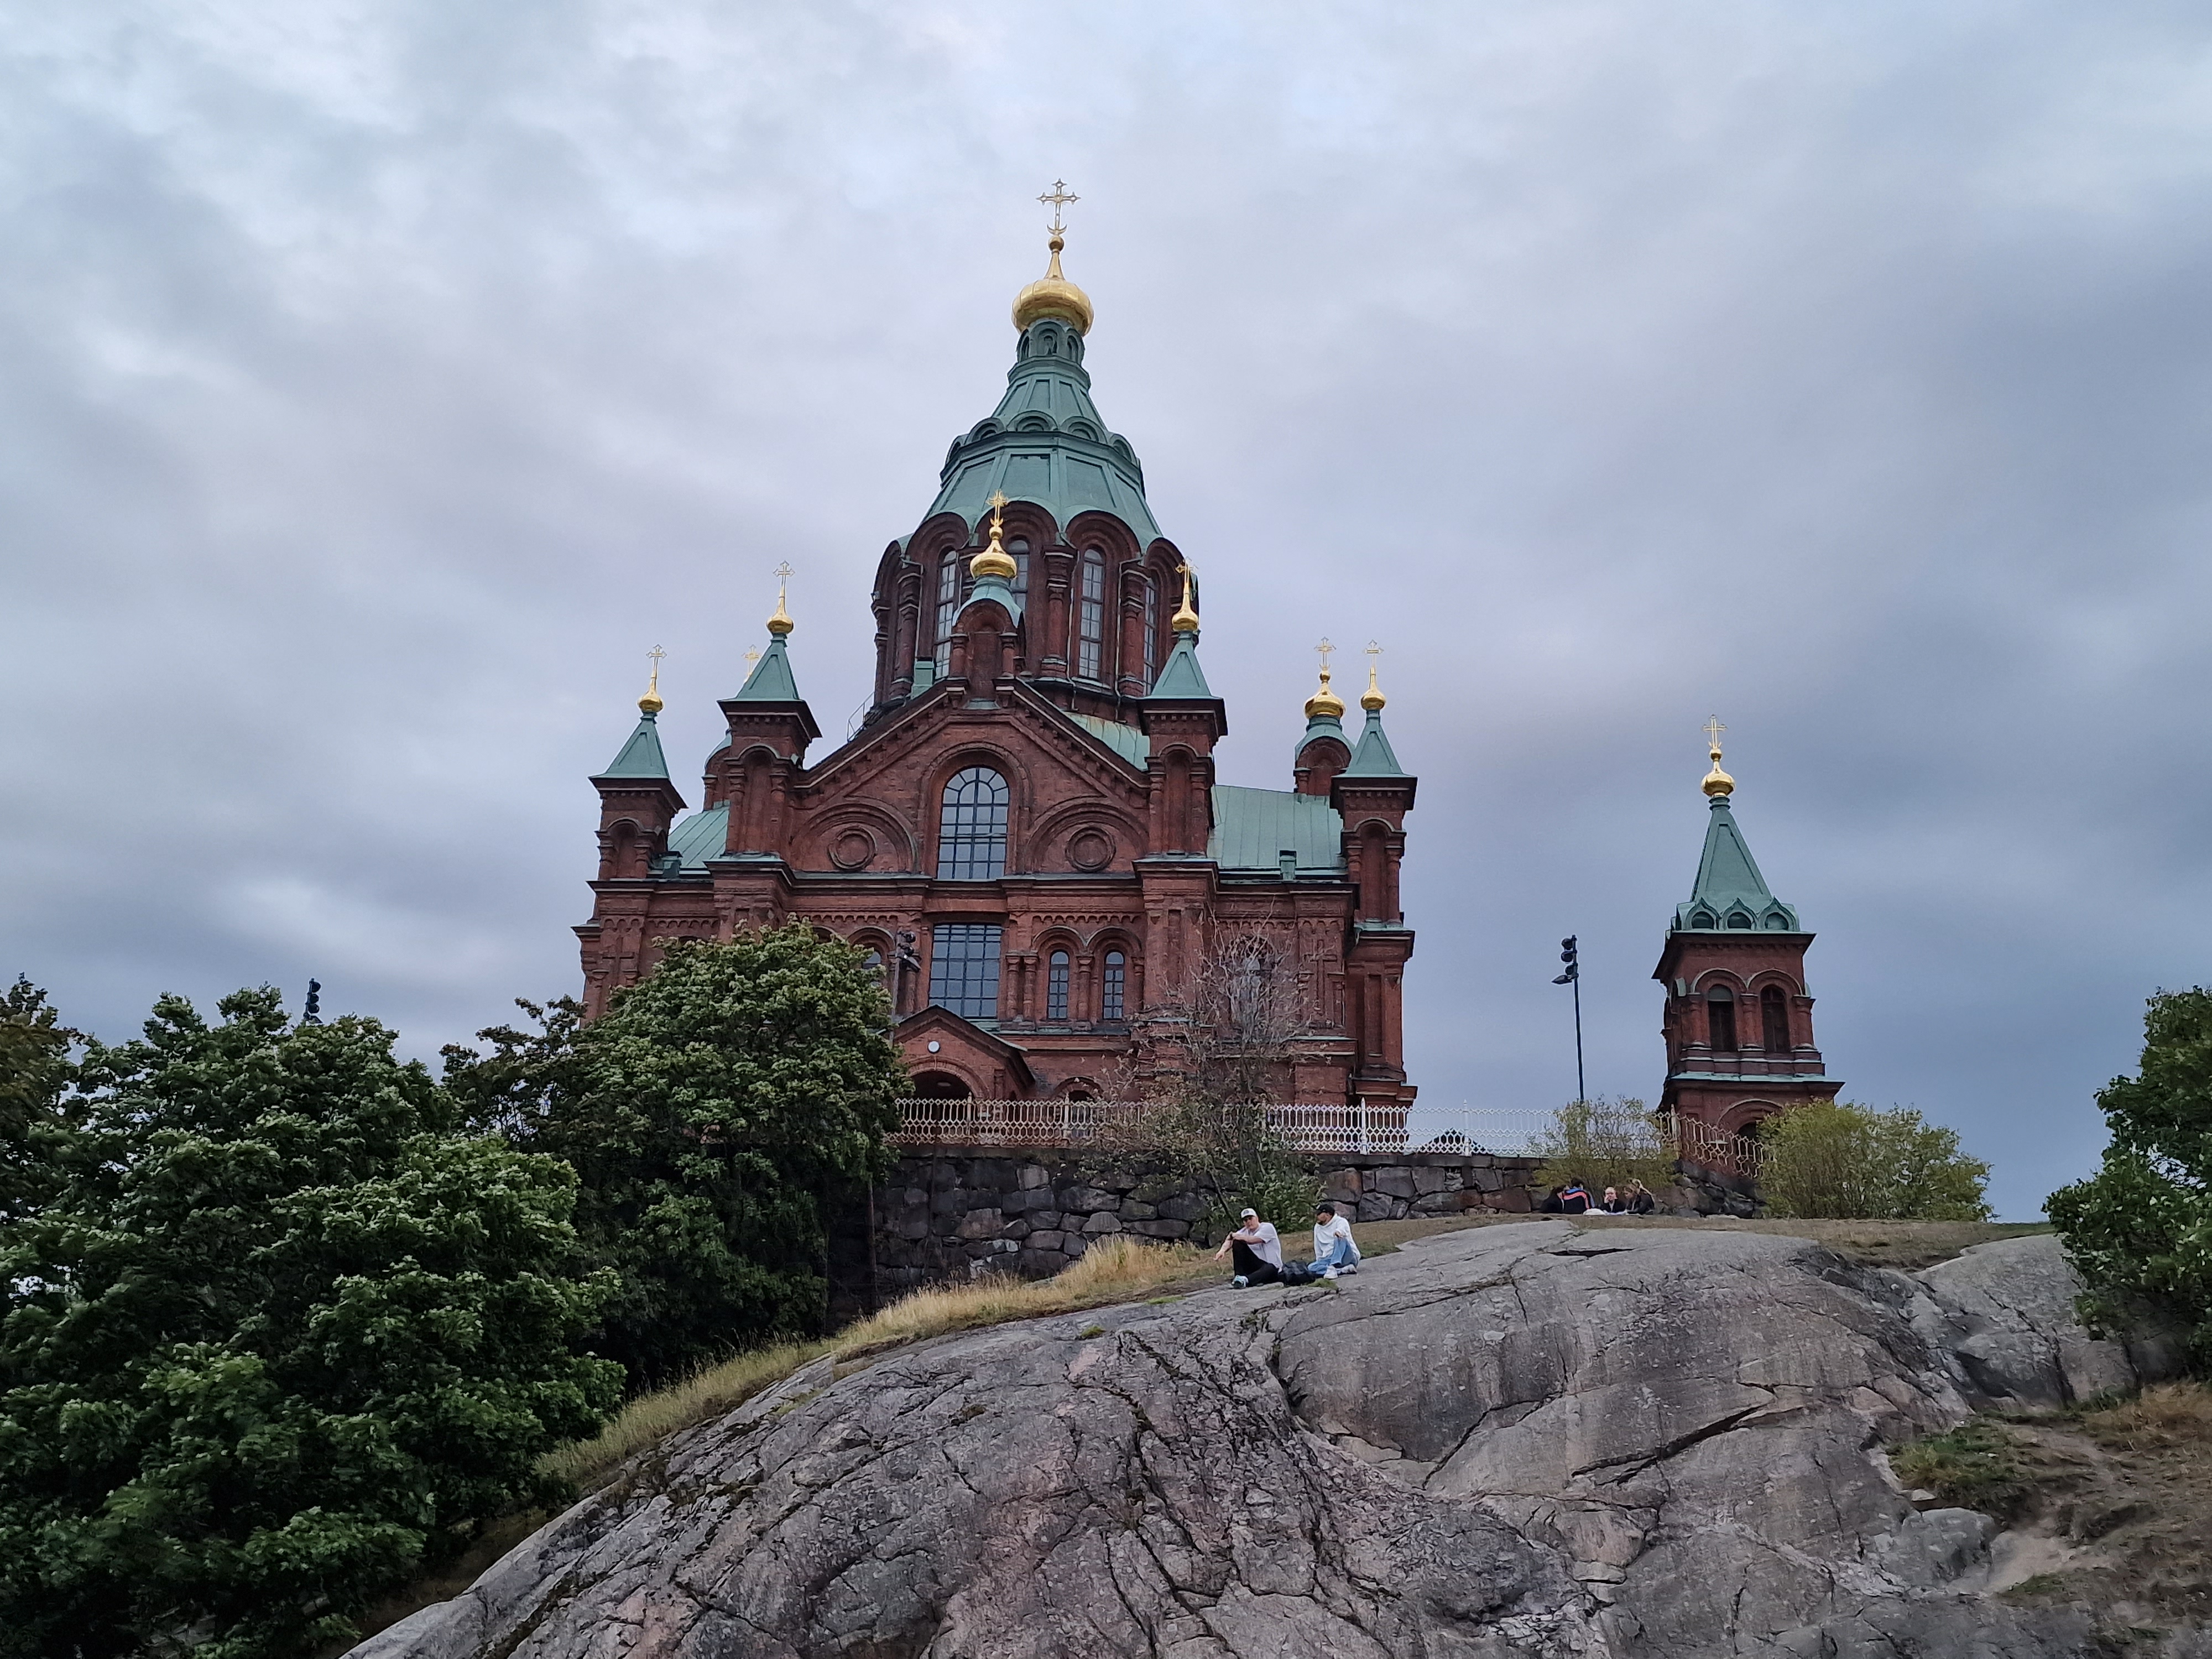
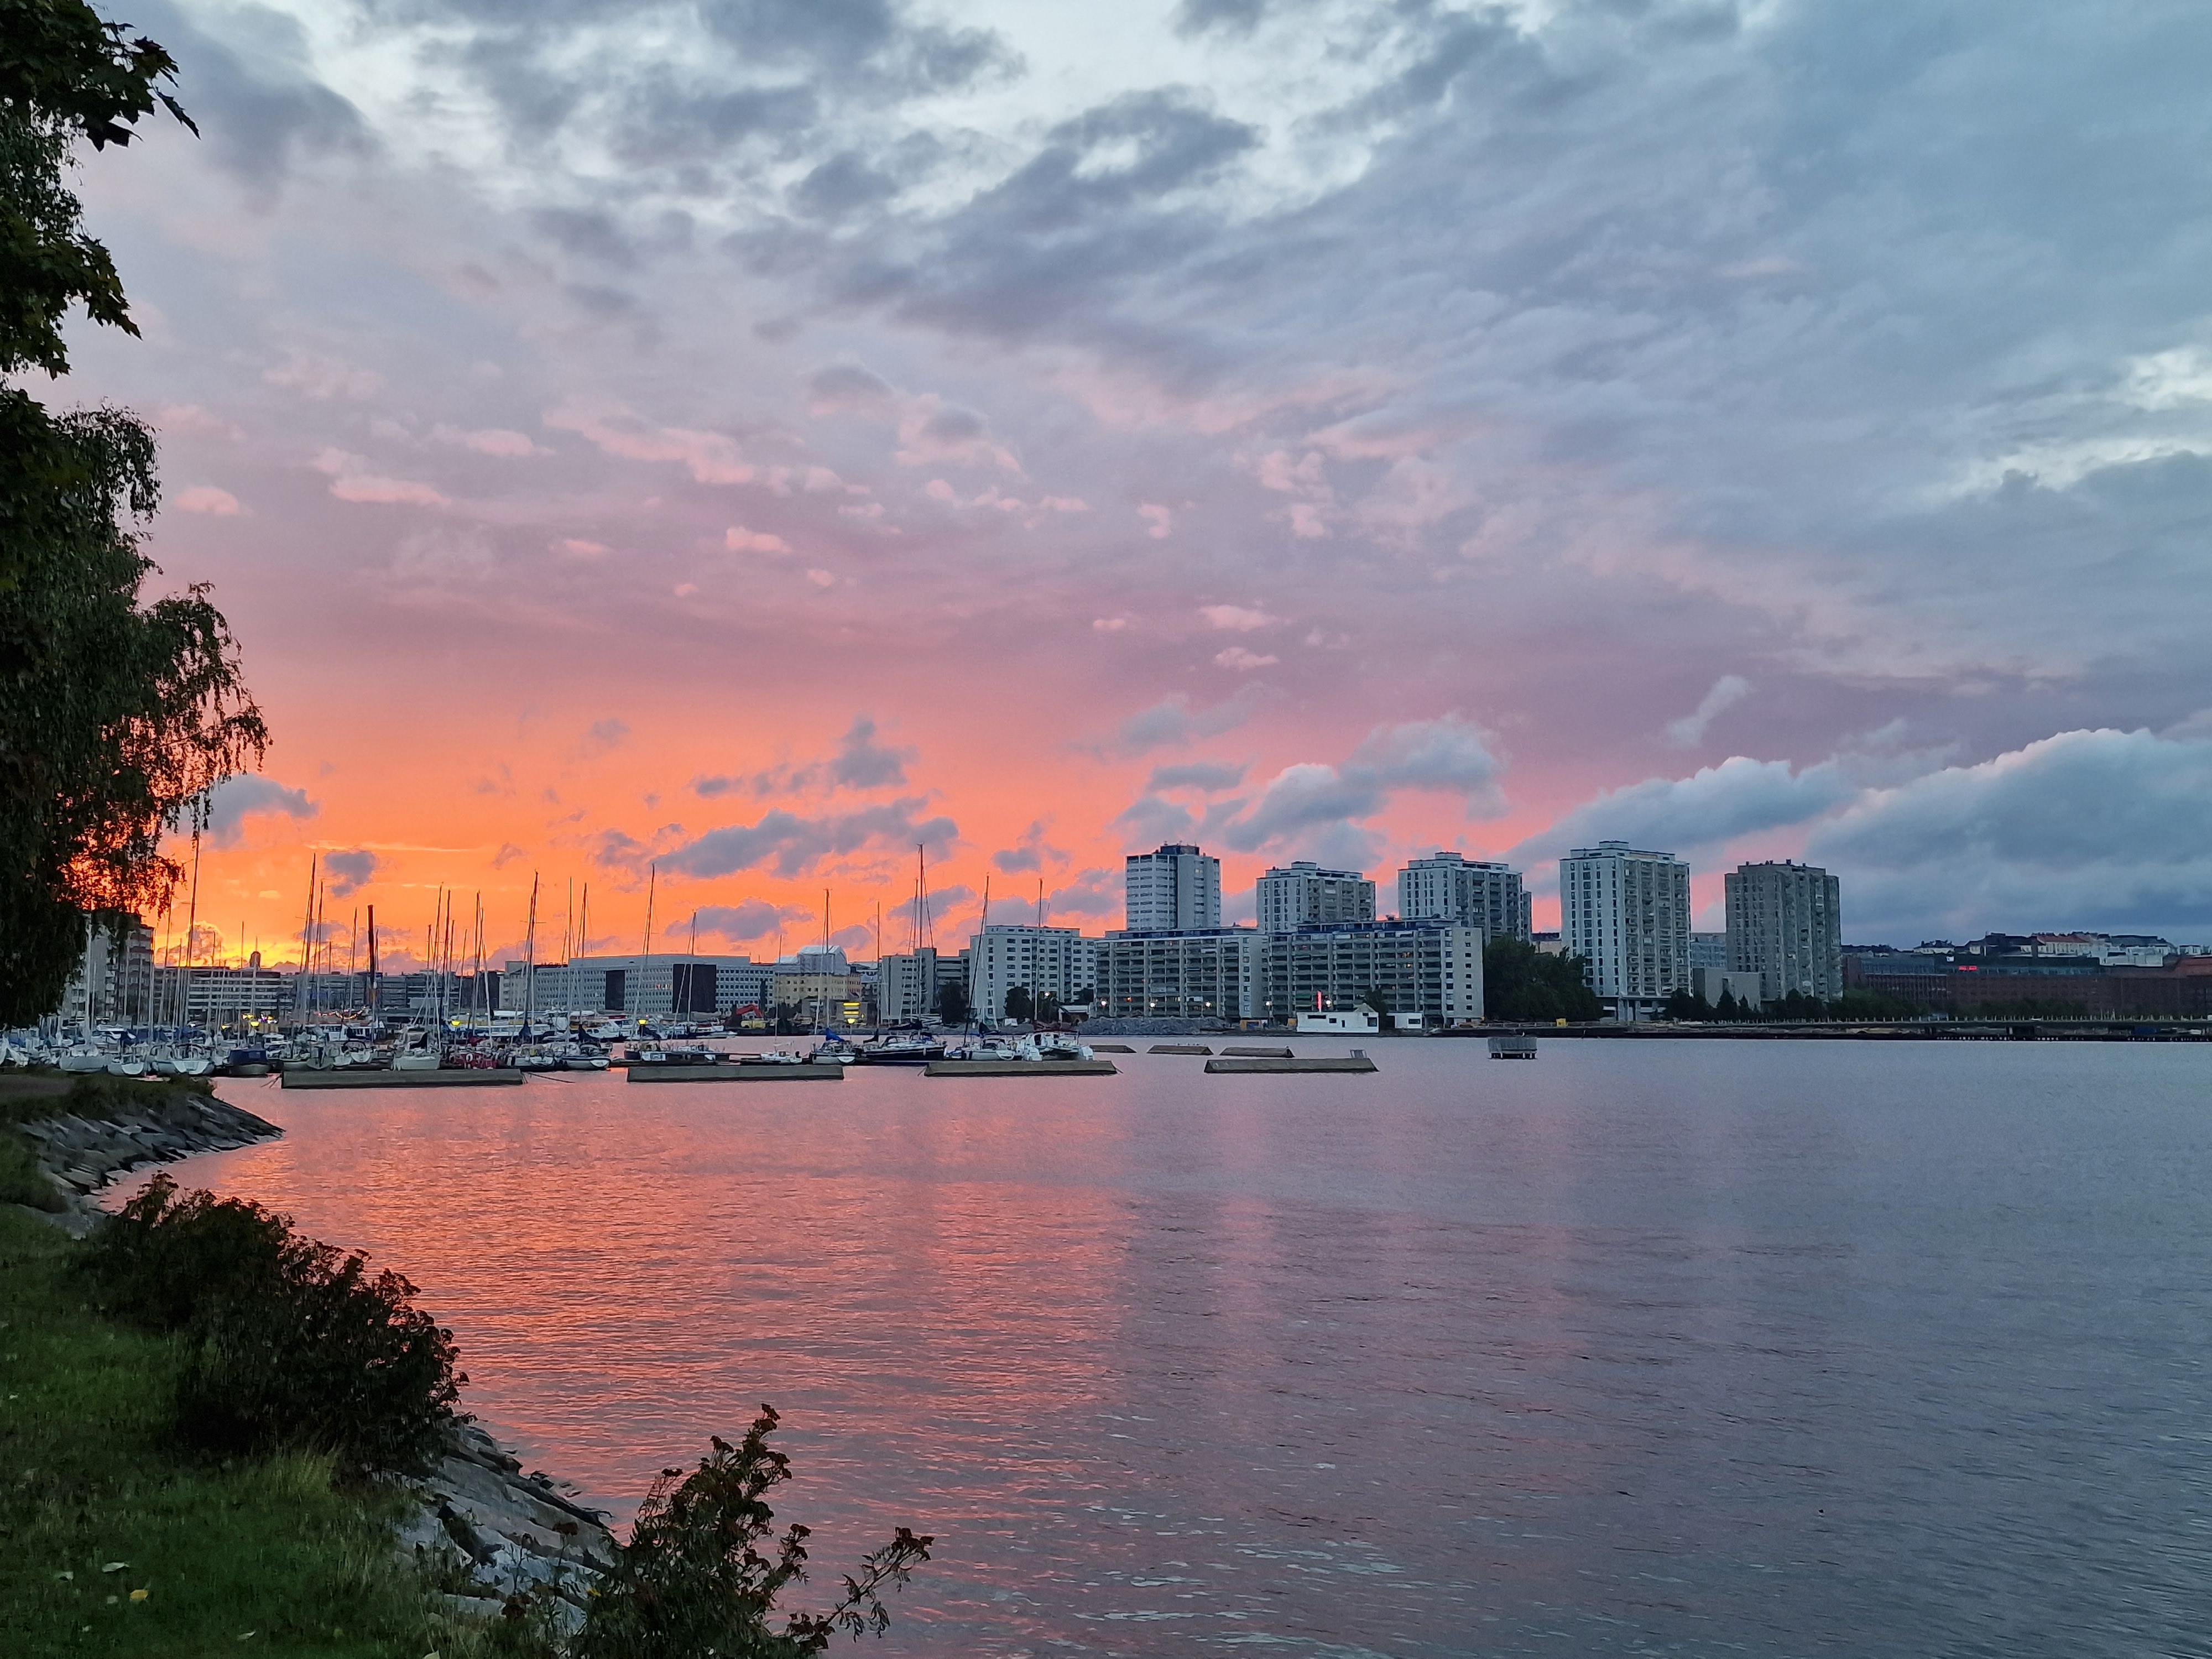
The city of Helsinki was the perfect backdrop for a week of science and networking
Data, data, data!
The flow of microclimate data shows no signs of slowing down, either. We’re gathering bigger datasets, from more remote areas, and compiling them more efficiently (thank you, SoilTemp!). Smarter survey designs are helping us understand the globe’s microclimate in greater detail. I’m particularly happy to see increased standardization (thank you, TOMST!), but at the same time, creativity is flourishing. Take, for example, the fiber optic cable that measures temperature every 5 centimeters or so along its 50-meter length—such innovation is amazing to see.
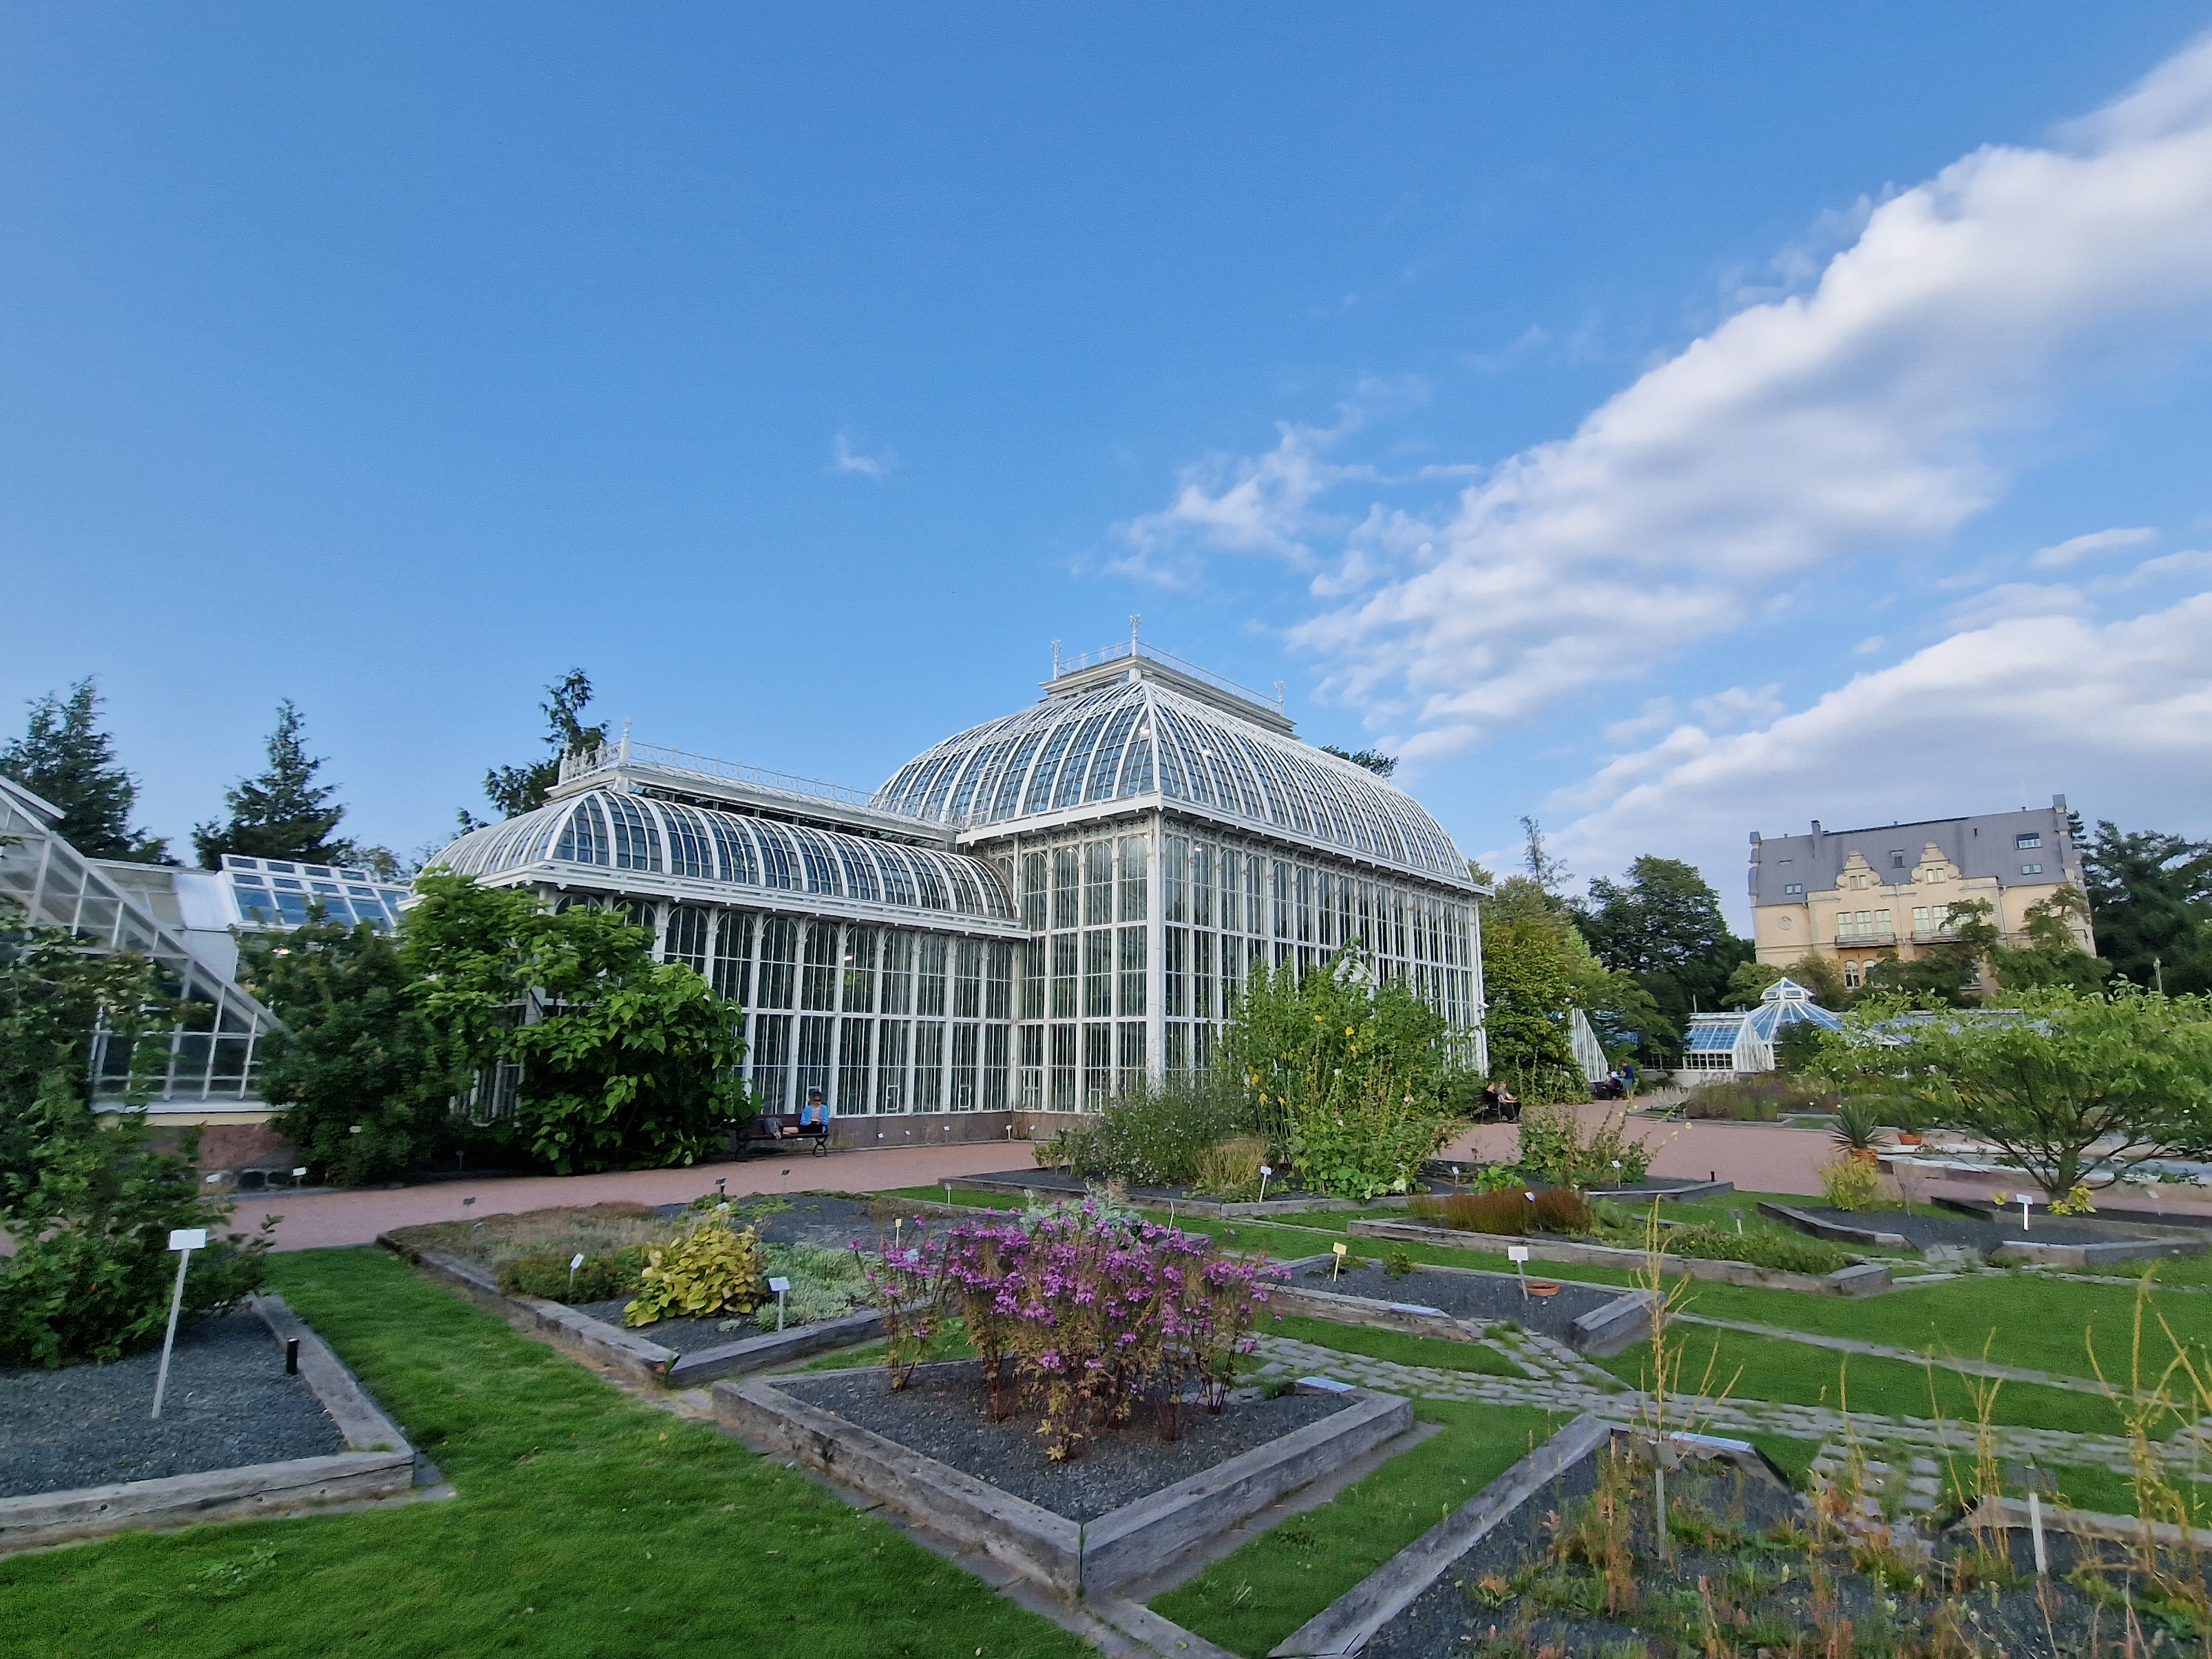
The cute botanical garden of Helsinki, a must-see for any self-respecting plant ecologist, of course!
We’re also becoming more careful with our sensor data, engaging in important discussions about what we’re actually measuring with a particular sensor, and how to make those measurements more relevant to the organisms we’re studying. We’re moving beyond simply acknowledging that things are complicated; we’re working on solutions and standardization.
From European forests to the globe
Global microclimate community? Absolutely. While European forest research clearly still leads the way, other regions and ecosystems are catching up. Tropical forests, for example, are gaining more in-situ sensors, fostering an increasingly vibrant research community and – as a result – a deepening understanding of those ecosystems.
But we went far beyond that at ME&B. The conference also saw the launch of a new Arctic, Antarctic, and Alpine subsection, uniting cold-climate enthusiasts to bring our knowledge of these regions up to par with that of forests. We also witnessed perhaps the very first freshwater microclimate presentations, tentatively bridging the gap between terrestrial and aquatic microclimate research—fields with many parallels but just as many divergences. Drylands, urban areas, peatlands and more were represented, showcasing that each ecosystem needs its own perspective to tackle microclimate issues.
Of course, SoilTemp oversees all of this with a smile, and in the next two years, we’ll work on strengthening these diverse subfields and their interactions even further.
A growing community
Lastly, and perhaps the most heartening development: the microclimate community is coming together like never before. Collaborations are springing up everywhere, and endless enthusiastic conversations about research—over coffee, beer, blueberry juice, or vegetarian curry—fuel the spirit of the conference. Let’s keep those conversations going, as they are what keep us going!
Thanks, team Helsinki, for a fabulous conference!
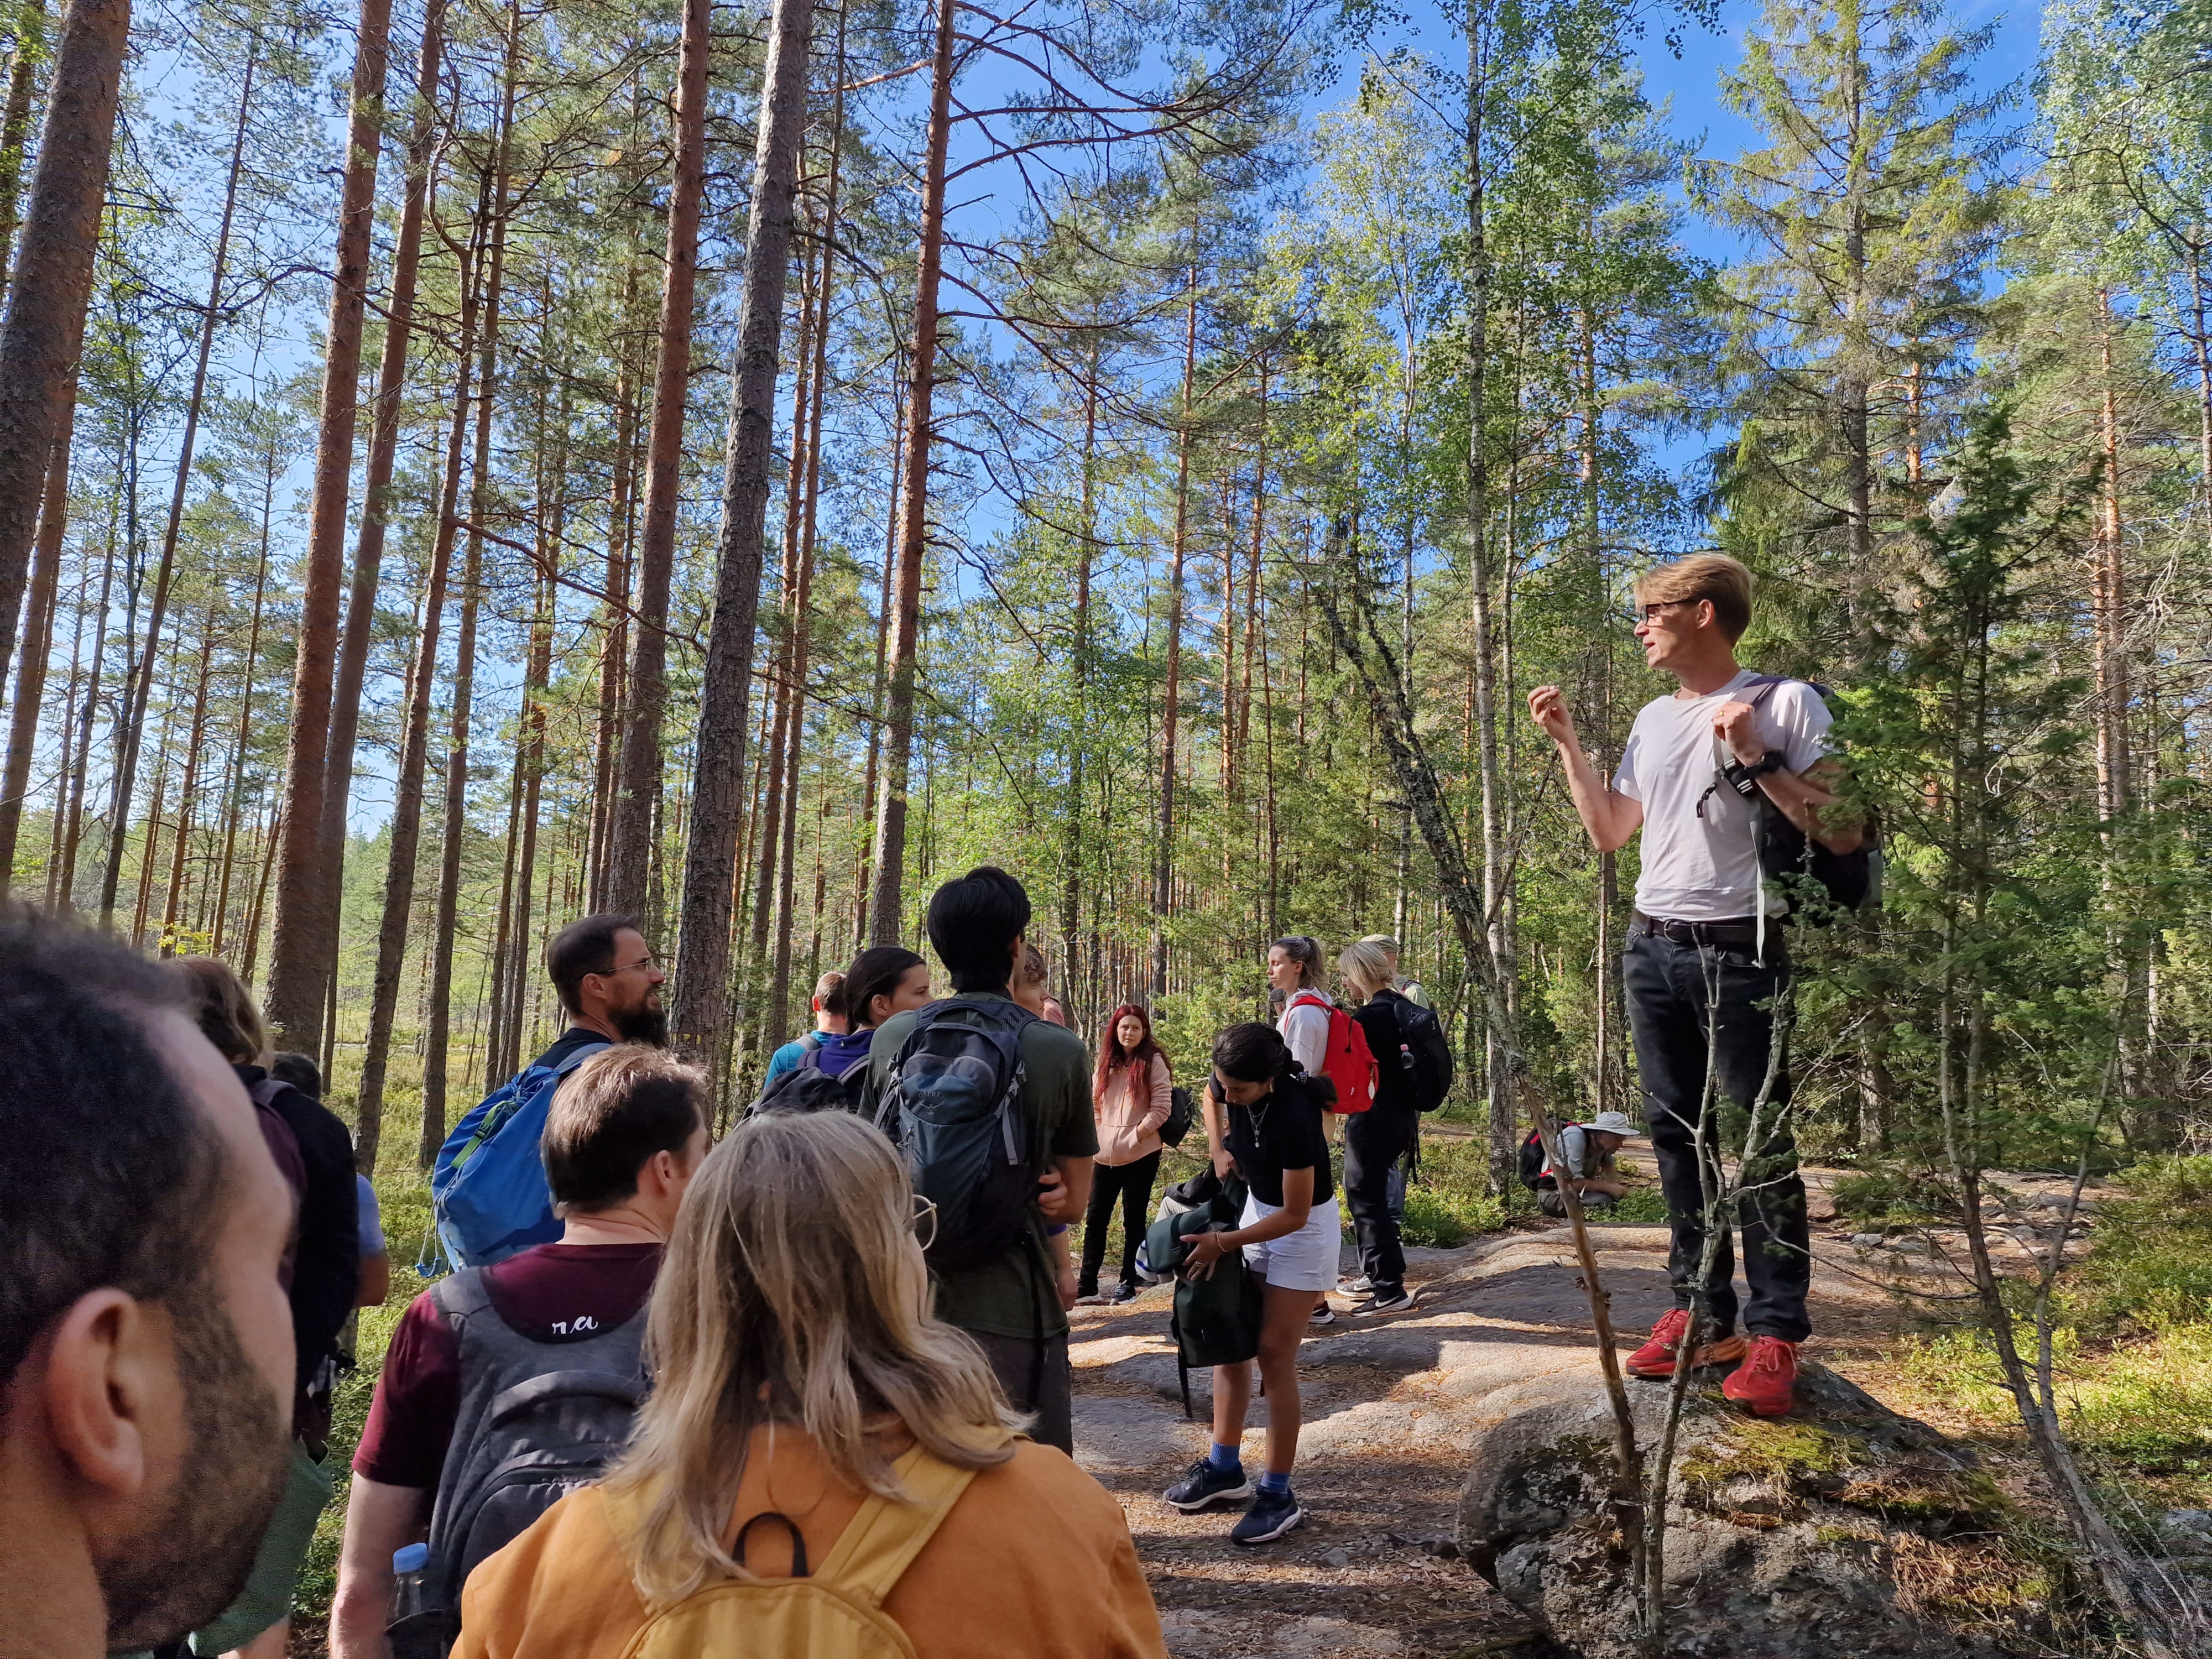
Miska Luoto, one of the Finnish organizers, showing us his beloved Finland
With MEB2024 just around the corner, it’s the perfect moment to shine a light on a hidden gem that holds a special place in my heart.
But first, what exactly is MEB2024? The second ‘Microclimate Ecology & Biogeography’ conference is the fulfillment of one of our founding dreams at the SoilTemp network: to create a global community of microclimate researchers, all learning from each other. The inaugural conference in 2022 brought over a hundred brilliant minds to Antwerp, Belgium. Now, as we prepare for the second edition in Helsinki, with a similarly strong turnout, this conference has already established itself as a cornerstone event in our field – if I may say so myself.
The beautiful University of Antwerp-venue that hosted MEB2022
For those who joined us at MEB2022 in Antwerp, you’ll surely agree that it was a week brimming with excitement and groundbreaking ideas for the future of microclimate science. It felt like we were on the brink of something transformative—a pivotal moment in the global rise of microclimate ecology and biogeography.
Inspired by that vibrant atmosphere, we decided to capture the essence of the conference in writing. That’s how the idea for a keystone paper on microclimate was born. But we didn’t stop there; we took a perhaps slightly unconventional approach: inviting every single conference participant to co-author the piece. It might sound crazy—writing a perspective paper with over a hundred authors—but it felt as the right thing to do. The concept was undeniably born from the collective energy of the conference, and the ideas we aimed to distill into the paper were shaped by the presentations, conversations, and debates we shared over coffee and lunch with all participants. It was simply not possible to draw a line!
Figure 1 of ‘Kemppinen et al.’: Microclimate investigations in ecology and biogeography. The conceptual figure highlights that microclimate is the link between macroclimate and the ecophysiology of organisms.
This ambitious project was guided by the incredible Julia Kemppinen, whose leadership turned our vision into reality. Her expertise ensured that, while – of course – not everyone could contribute equally, many if not most co-authors played significant roles in shaping the manuscript, making each contributor feel that their input was valuable.
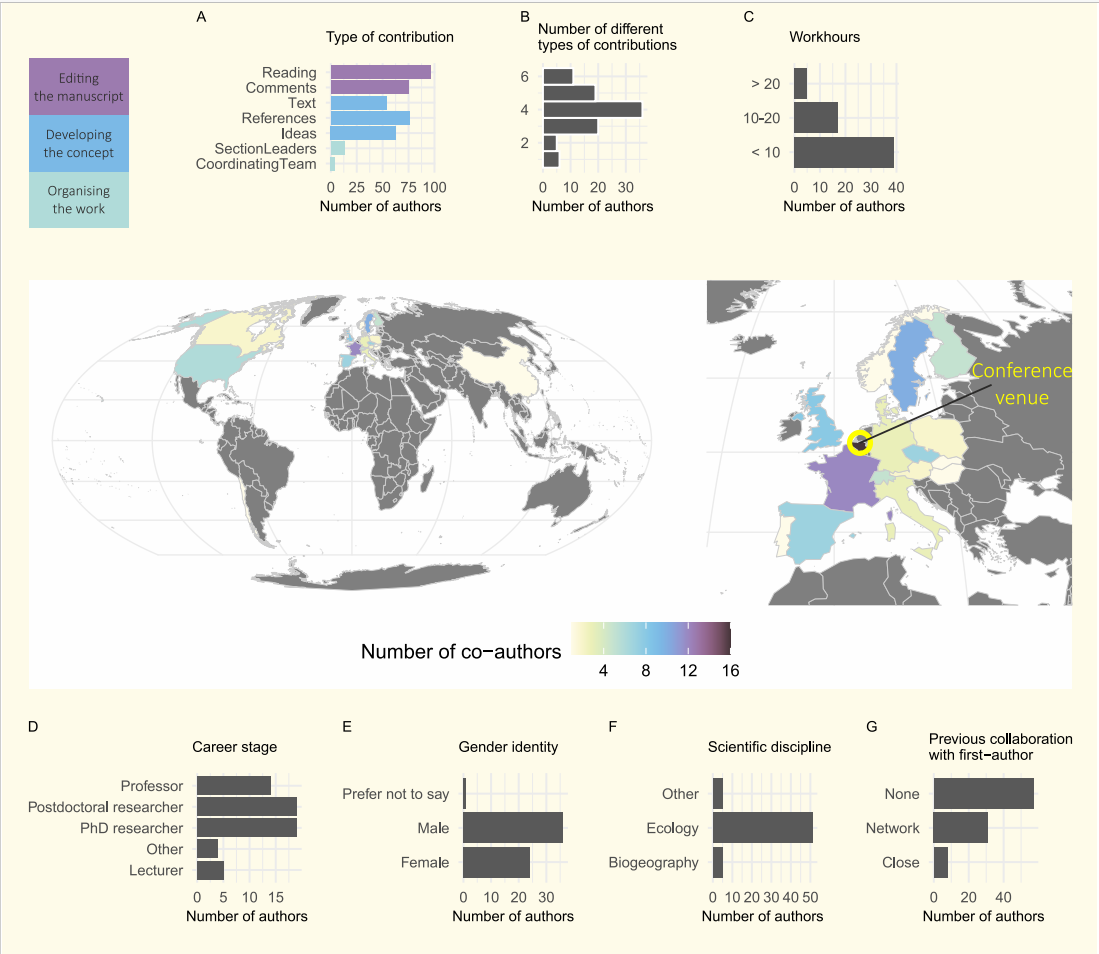
Author demographics of our collaborative mastodont
Beyond its importance to the field of microclimate research, this collaborative effort stands as a testament to what can be achieved when a community comes together. Because this process was so rewarding, we wanted to share our experience as a model for others embarking on collaborative (perspective) papers. That’s why we detailed our workflow in the supplementary material—a hidden gem for those curious about our approach. These supplementary figures offer a glimpse into the collaborative journey that brought our paper to life.
First part of the route we took to make this paper a success. More information in the supplement!
So, as you dive into your next collaborative project, let our experience be your guide and inspiration!
Some outcomes of a questionnaire to the co-authors, inquiring about their experience with the paper writing process
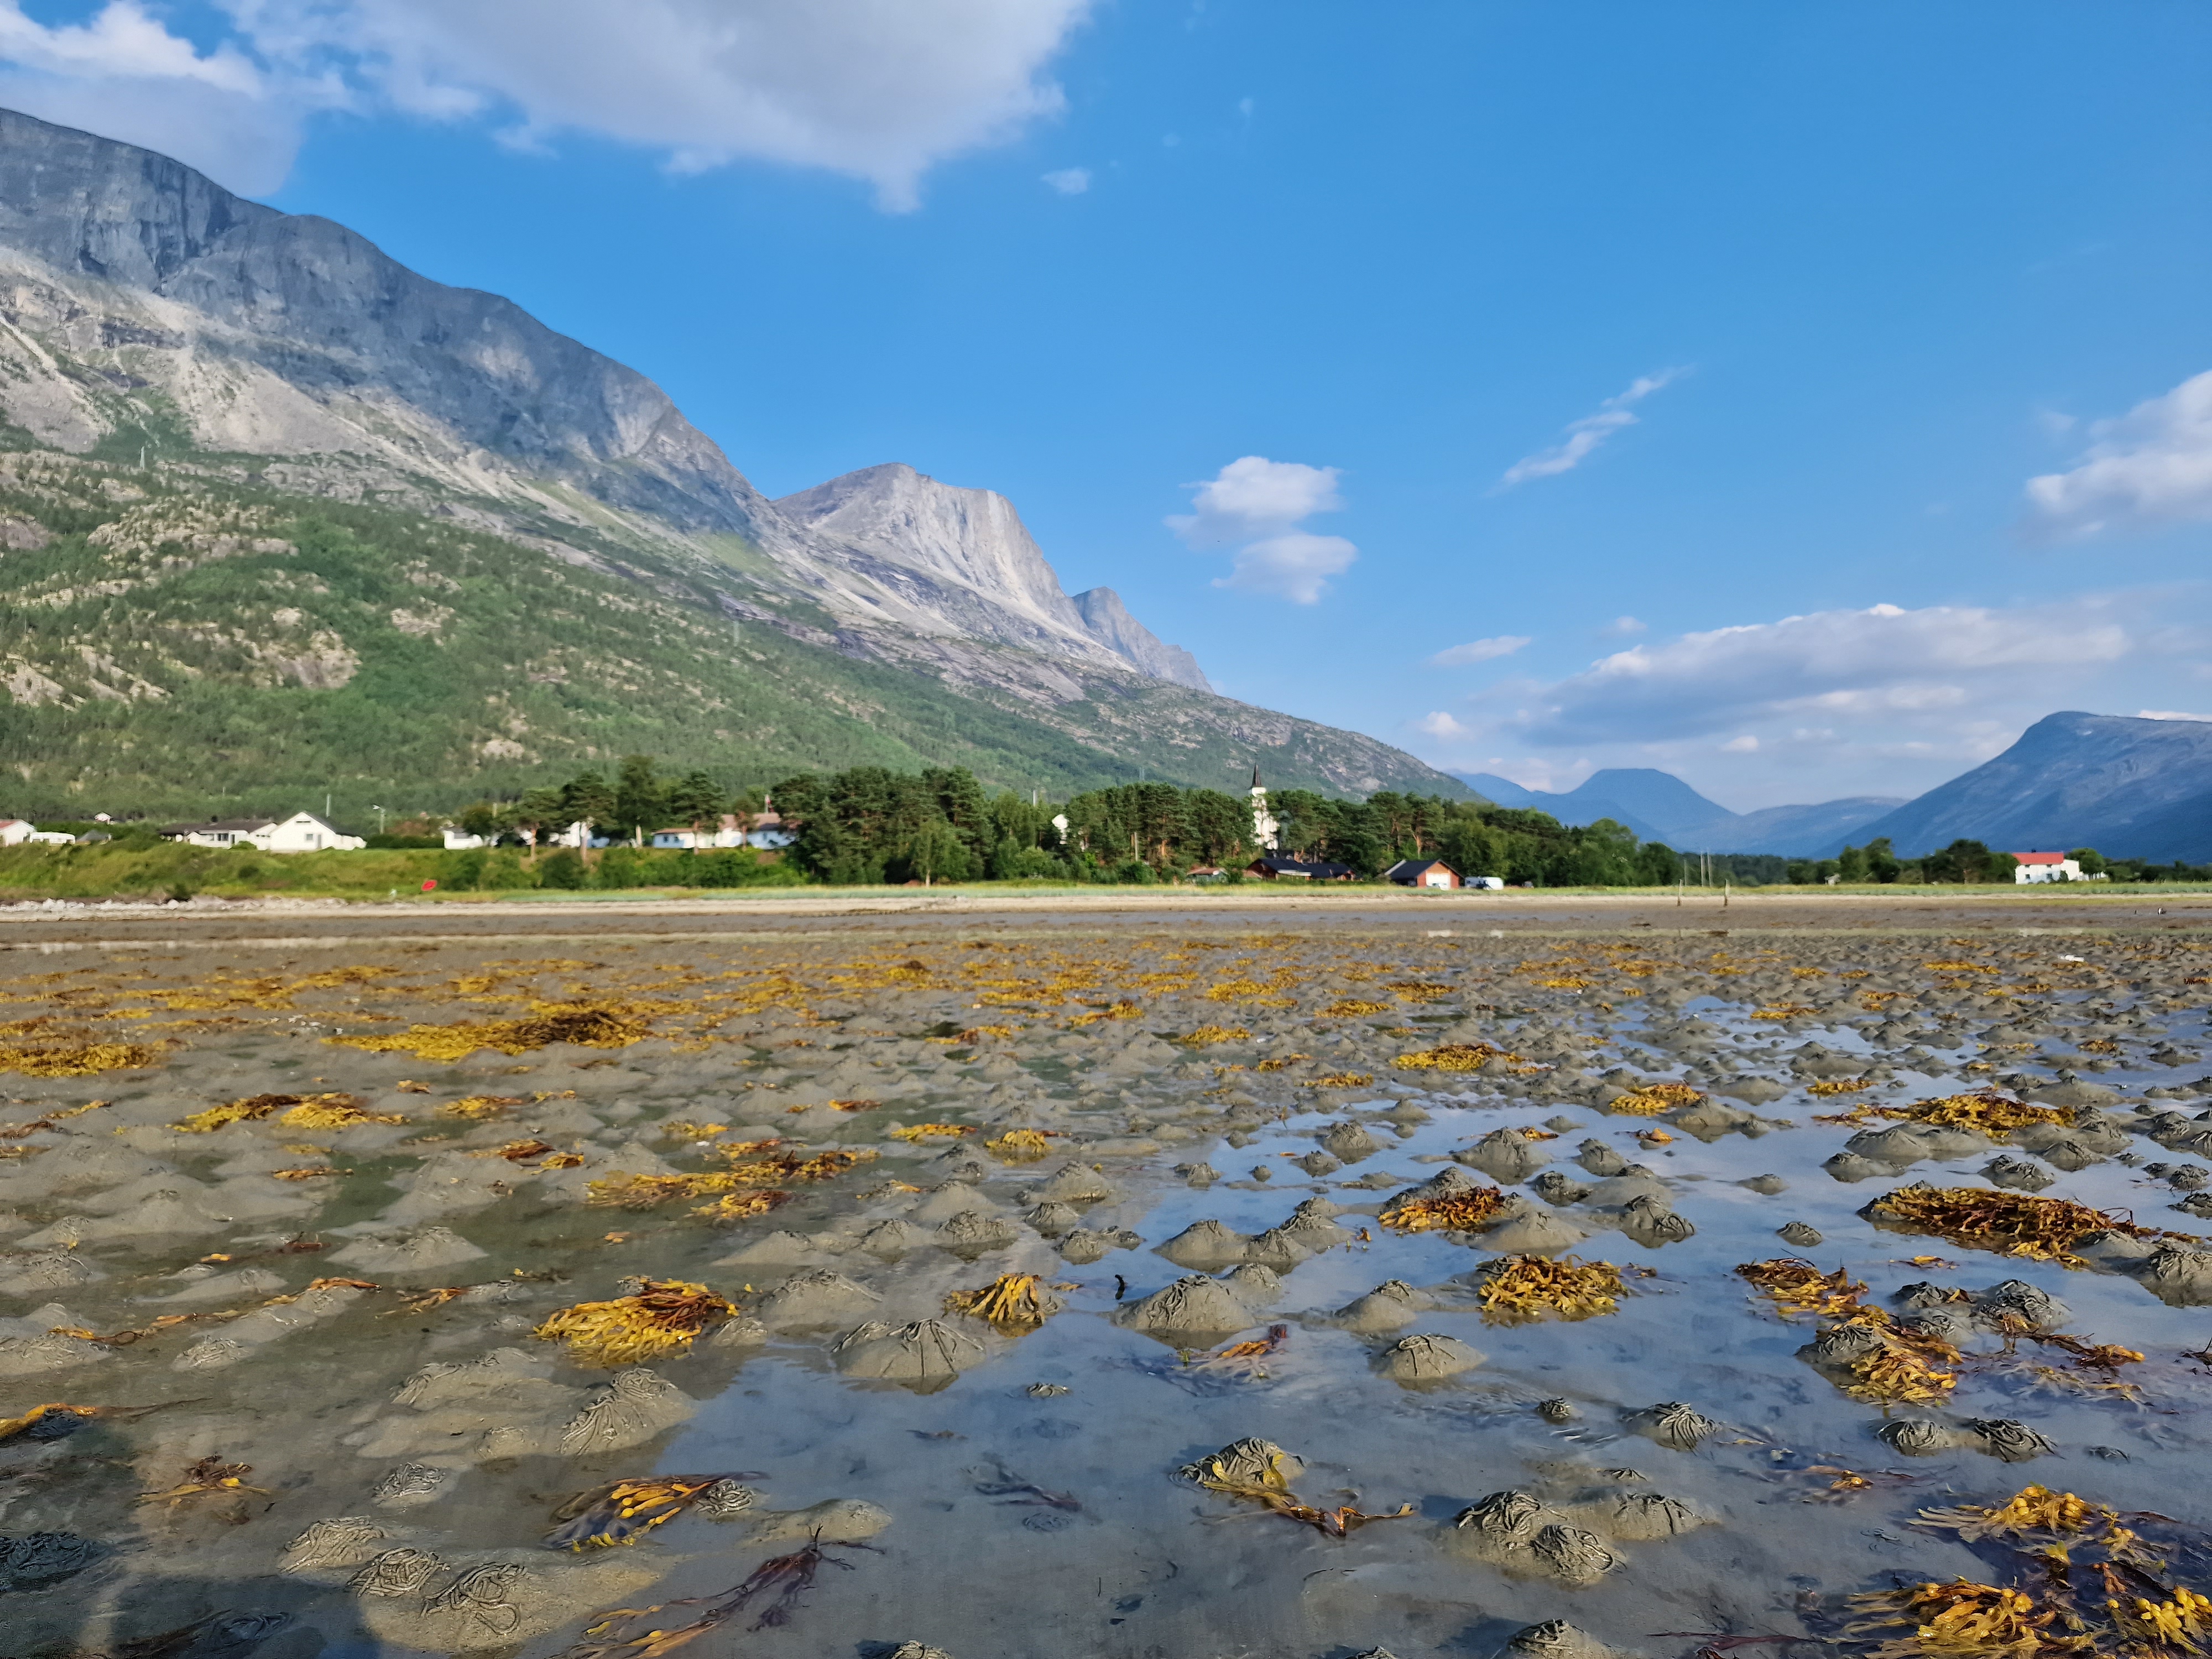
I will never get used to the absolute beauty of this place.
Where are we? The ‘Skjomdal’, a long valley cutting through Norway, just south of Narvik. A stream, a river and a fjord, all surrounded by stunning mountains.
It is here that it all started for me. This valley is home to two of our Norwegian MIREN roads, which we started monitoring back in 2012. It also hosted some of the first microclimate sensors back in 2016, for a project that later grew into SoilTemp.
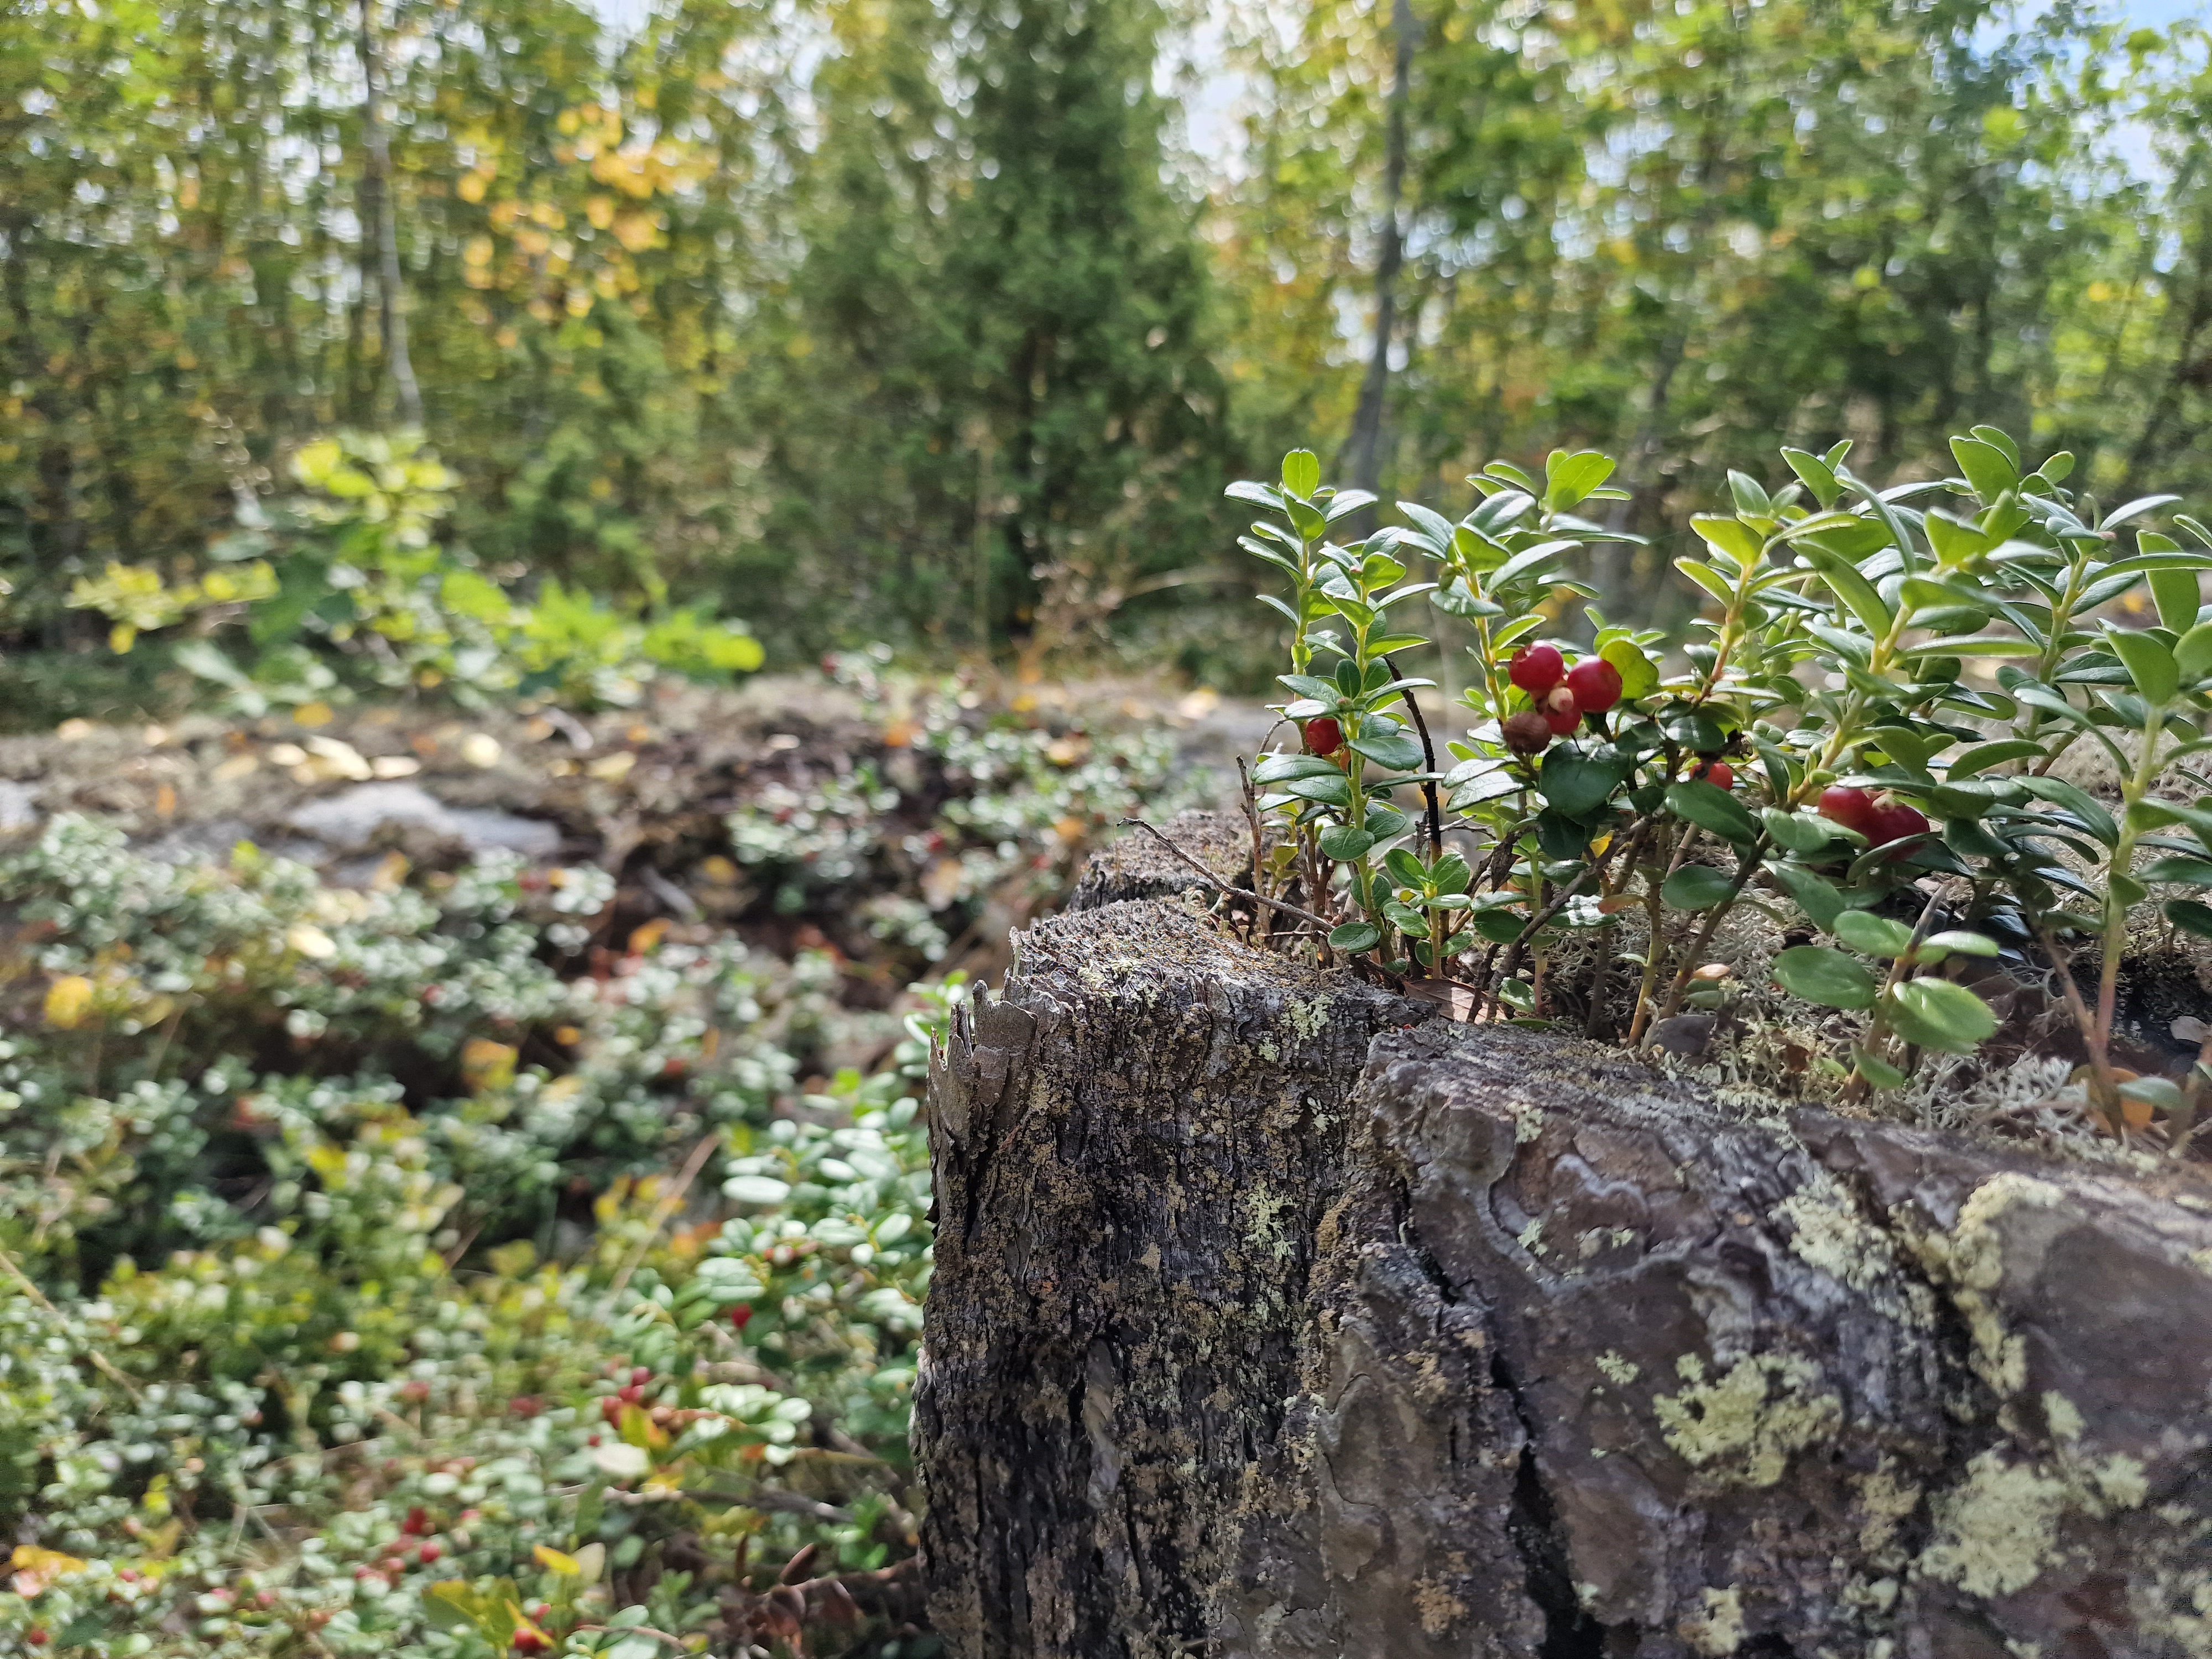
Autumn vibes in our MIREN plots, thanks to the very red berries of Cornus suecica
Now, it is mostly in charge of bringing us two days of happiness each year, as we enjoy its beautiful sites while reading out microclimate sensors and collecting vegetation data.
The road affectionately called ‘NO’, one of the cornerstones of our research since 2012Our home for the night in the Skjomdal. Upgraded with a solar panel this year, the homely light inside for the first time didn’t have to come from candles.
On our way to Abisko, northern Sweden, a massive early-morning thunderstorm in Brussels was the start of a 28-hour travel delay: we missed our next flight with a margin of just 10 minutes, and as such ended up too late for the last flight of the day to the little airport of Kiruna. Most of that delay was spent at Stockholm Arlanda, the giant travel hub just north of Swedish capital. There, we had to put up quite the fight to keep the delay at 28 hours only, as the initial proposition was closer to 72…
Now, students and I were not there to sit around and do nothing, we were travelling north for plants and nature! So, after the airline put is in the very agreeable ‘Comfort Hotel’ on the airport grounds to bridge the gap, we brought up a map of the airport and looked for an escape into the Swedish countryside. Now, Arlanda turned out to be remarkably suitable for such a plan. In less than half an hour of improvised hiking, we had left the concrete nothingness of the airport and wandered into increasingly amazing nature.
And so it happened that our layover at Stockholm Arlanda was used learning Swedish plants, chasing insects and discovering wildlife. In the end, the perfect start for the students for their month of botanizing in Abisko. The mood was set. The trip was going to be epic.
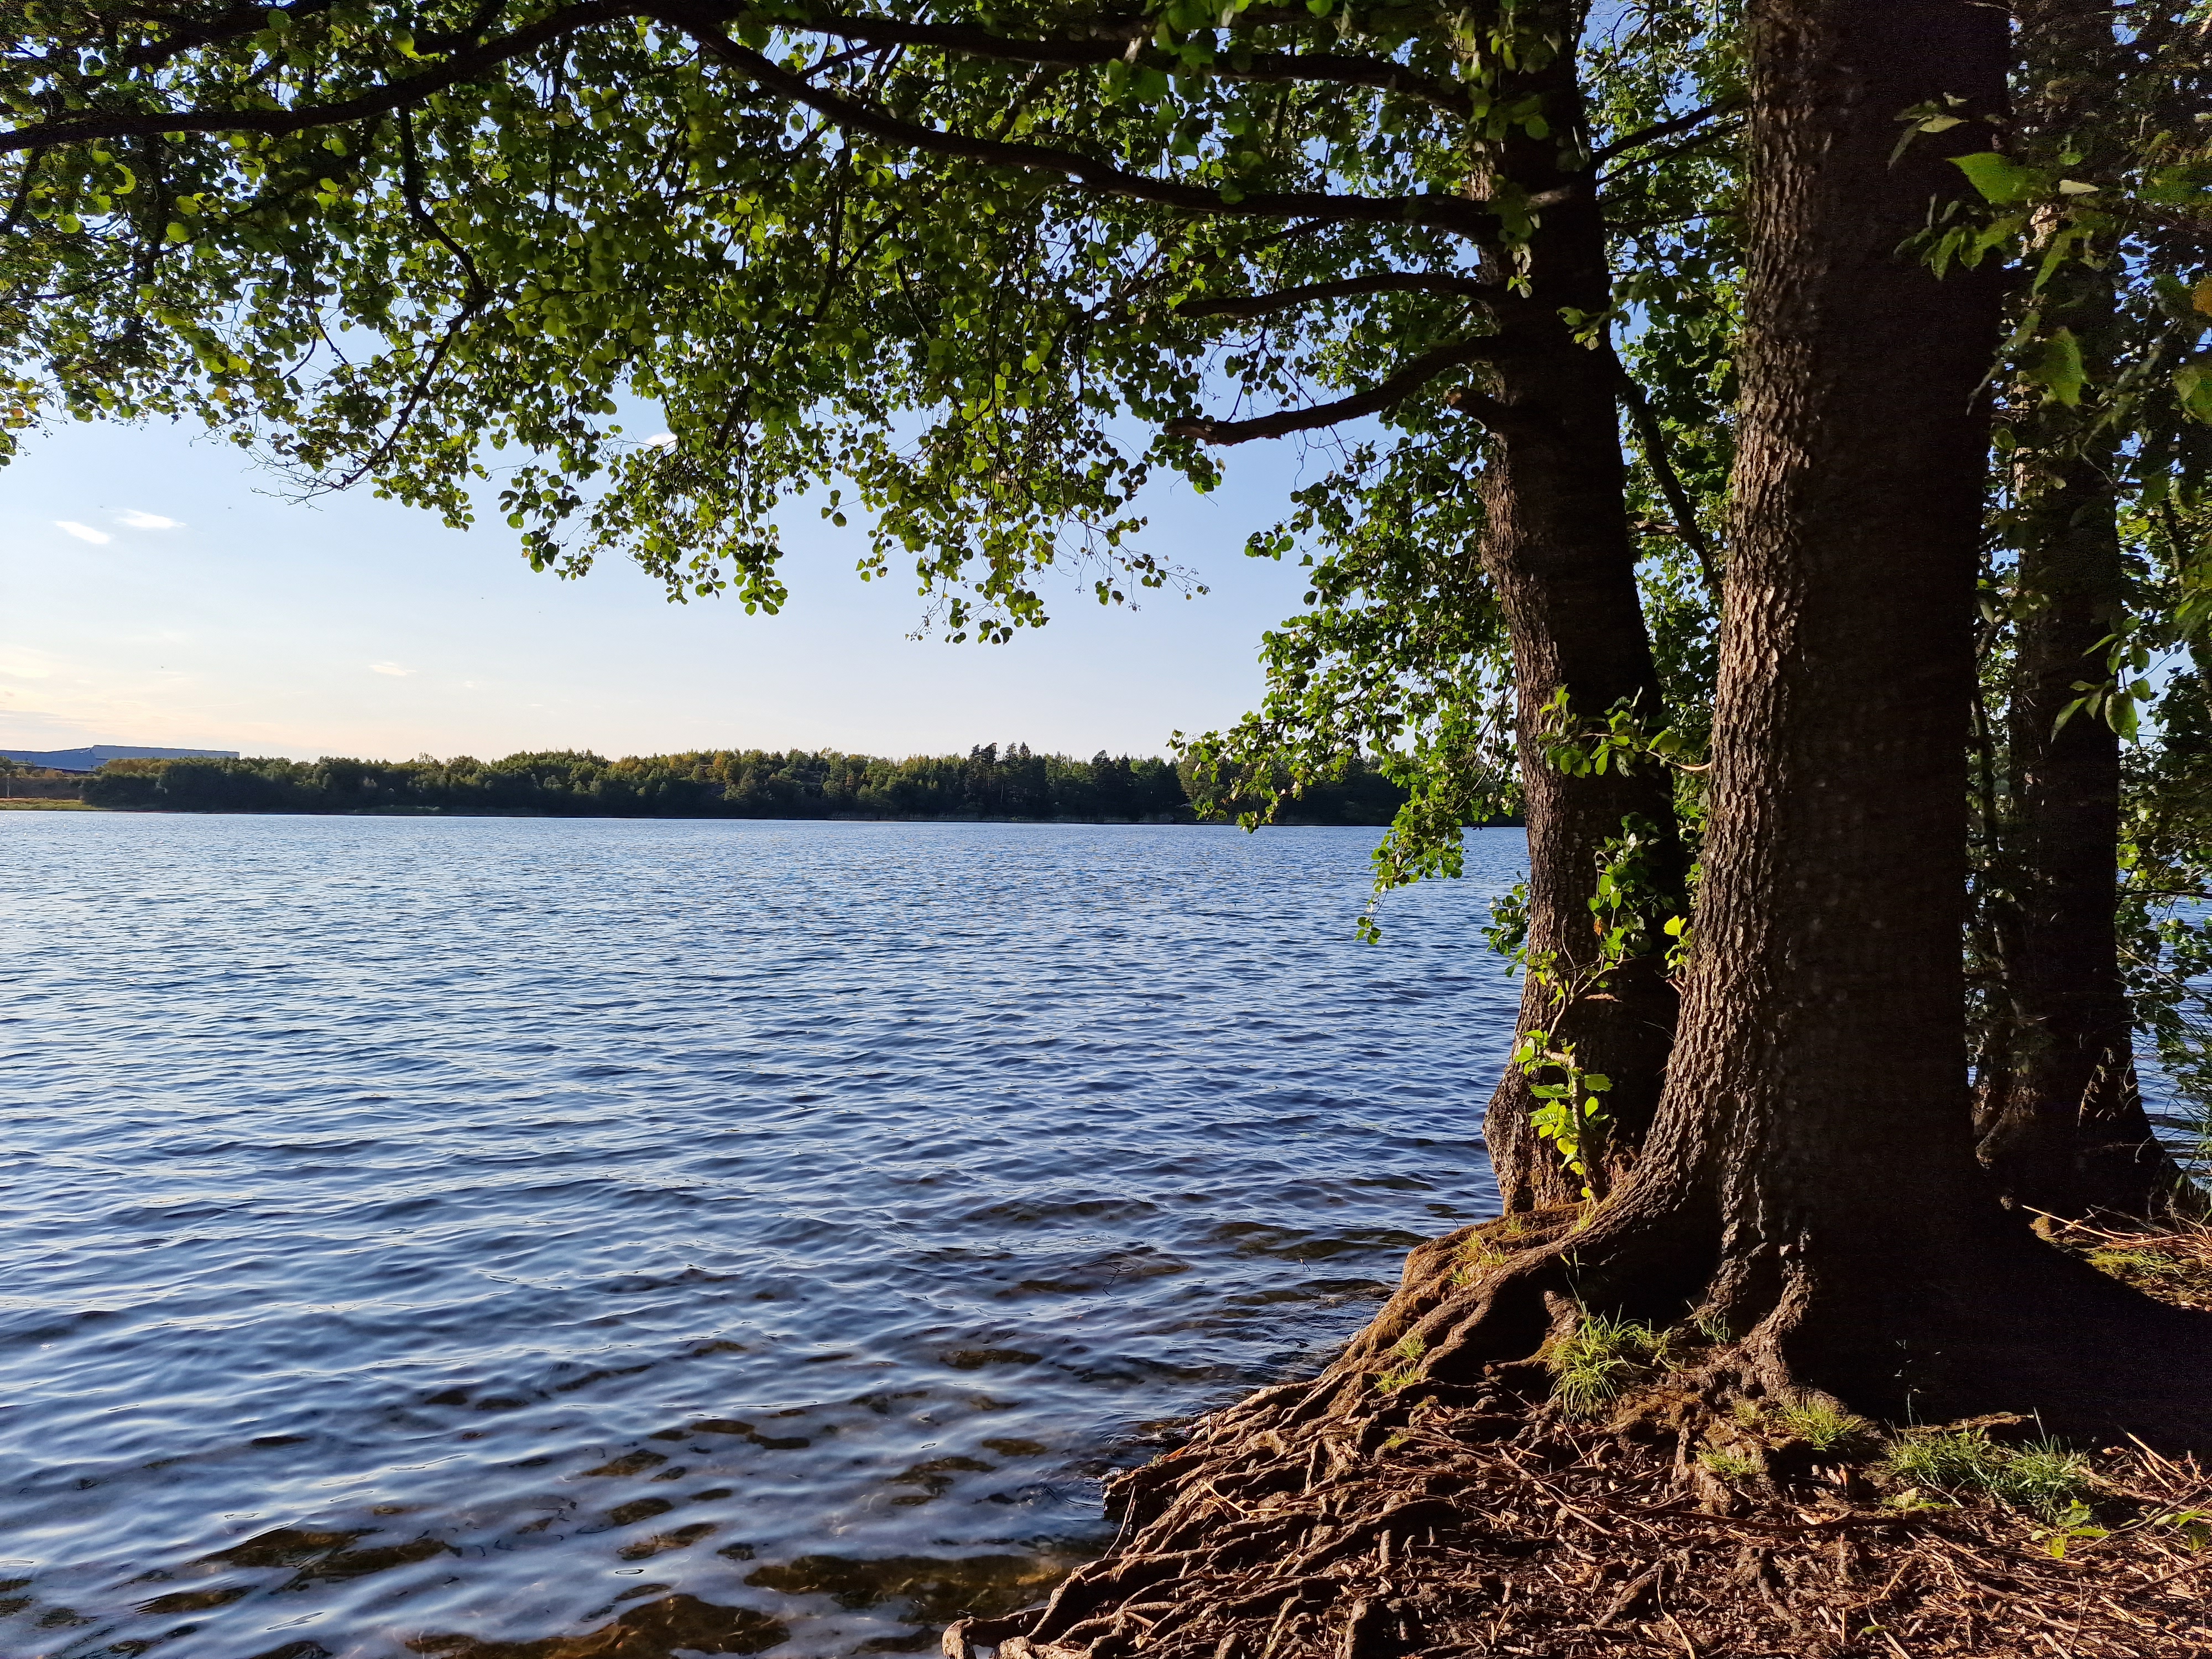
Top row: picturesque Swedish countryside house, some ‘true’ Swedish heathland, and a remarkably biodiverse lake.
Second row: relatively epic forest landscapes – Swedish strongsuit.
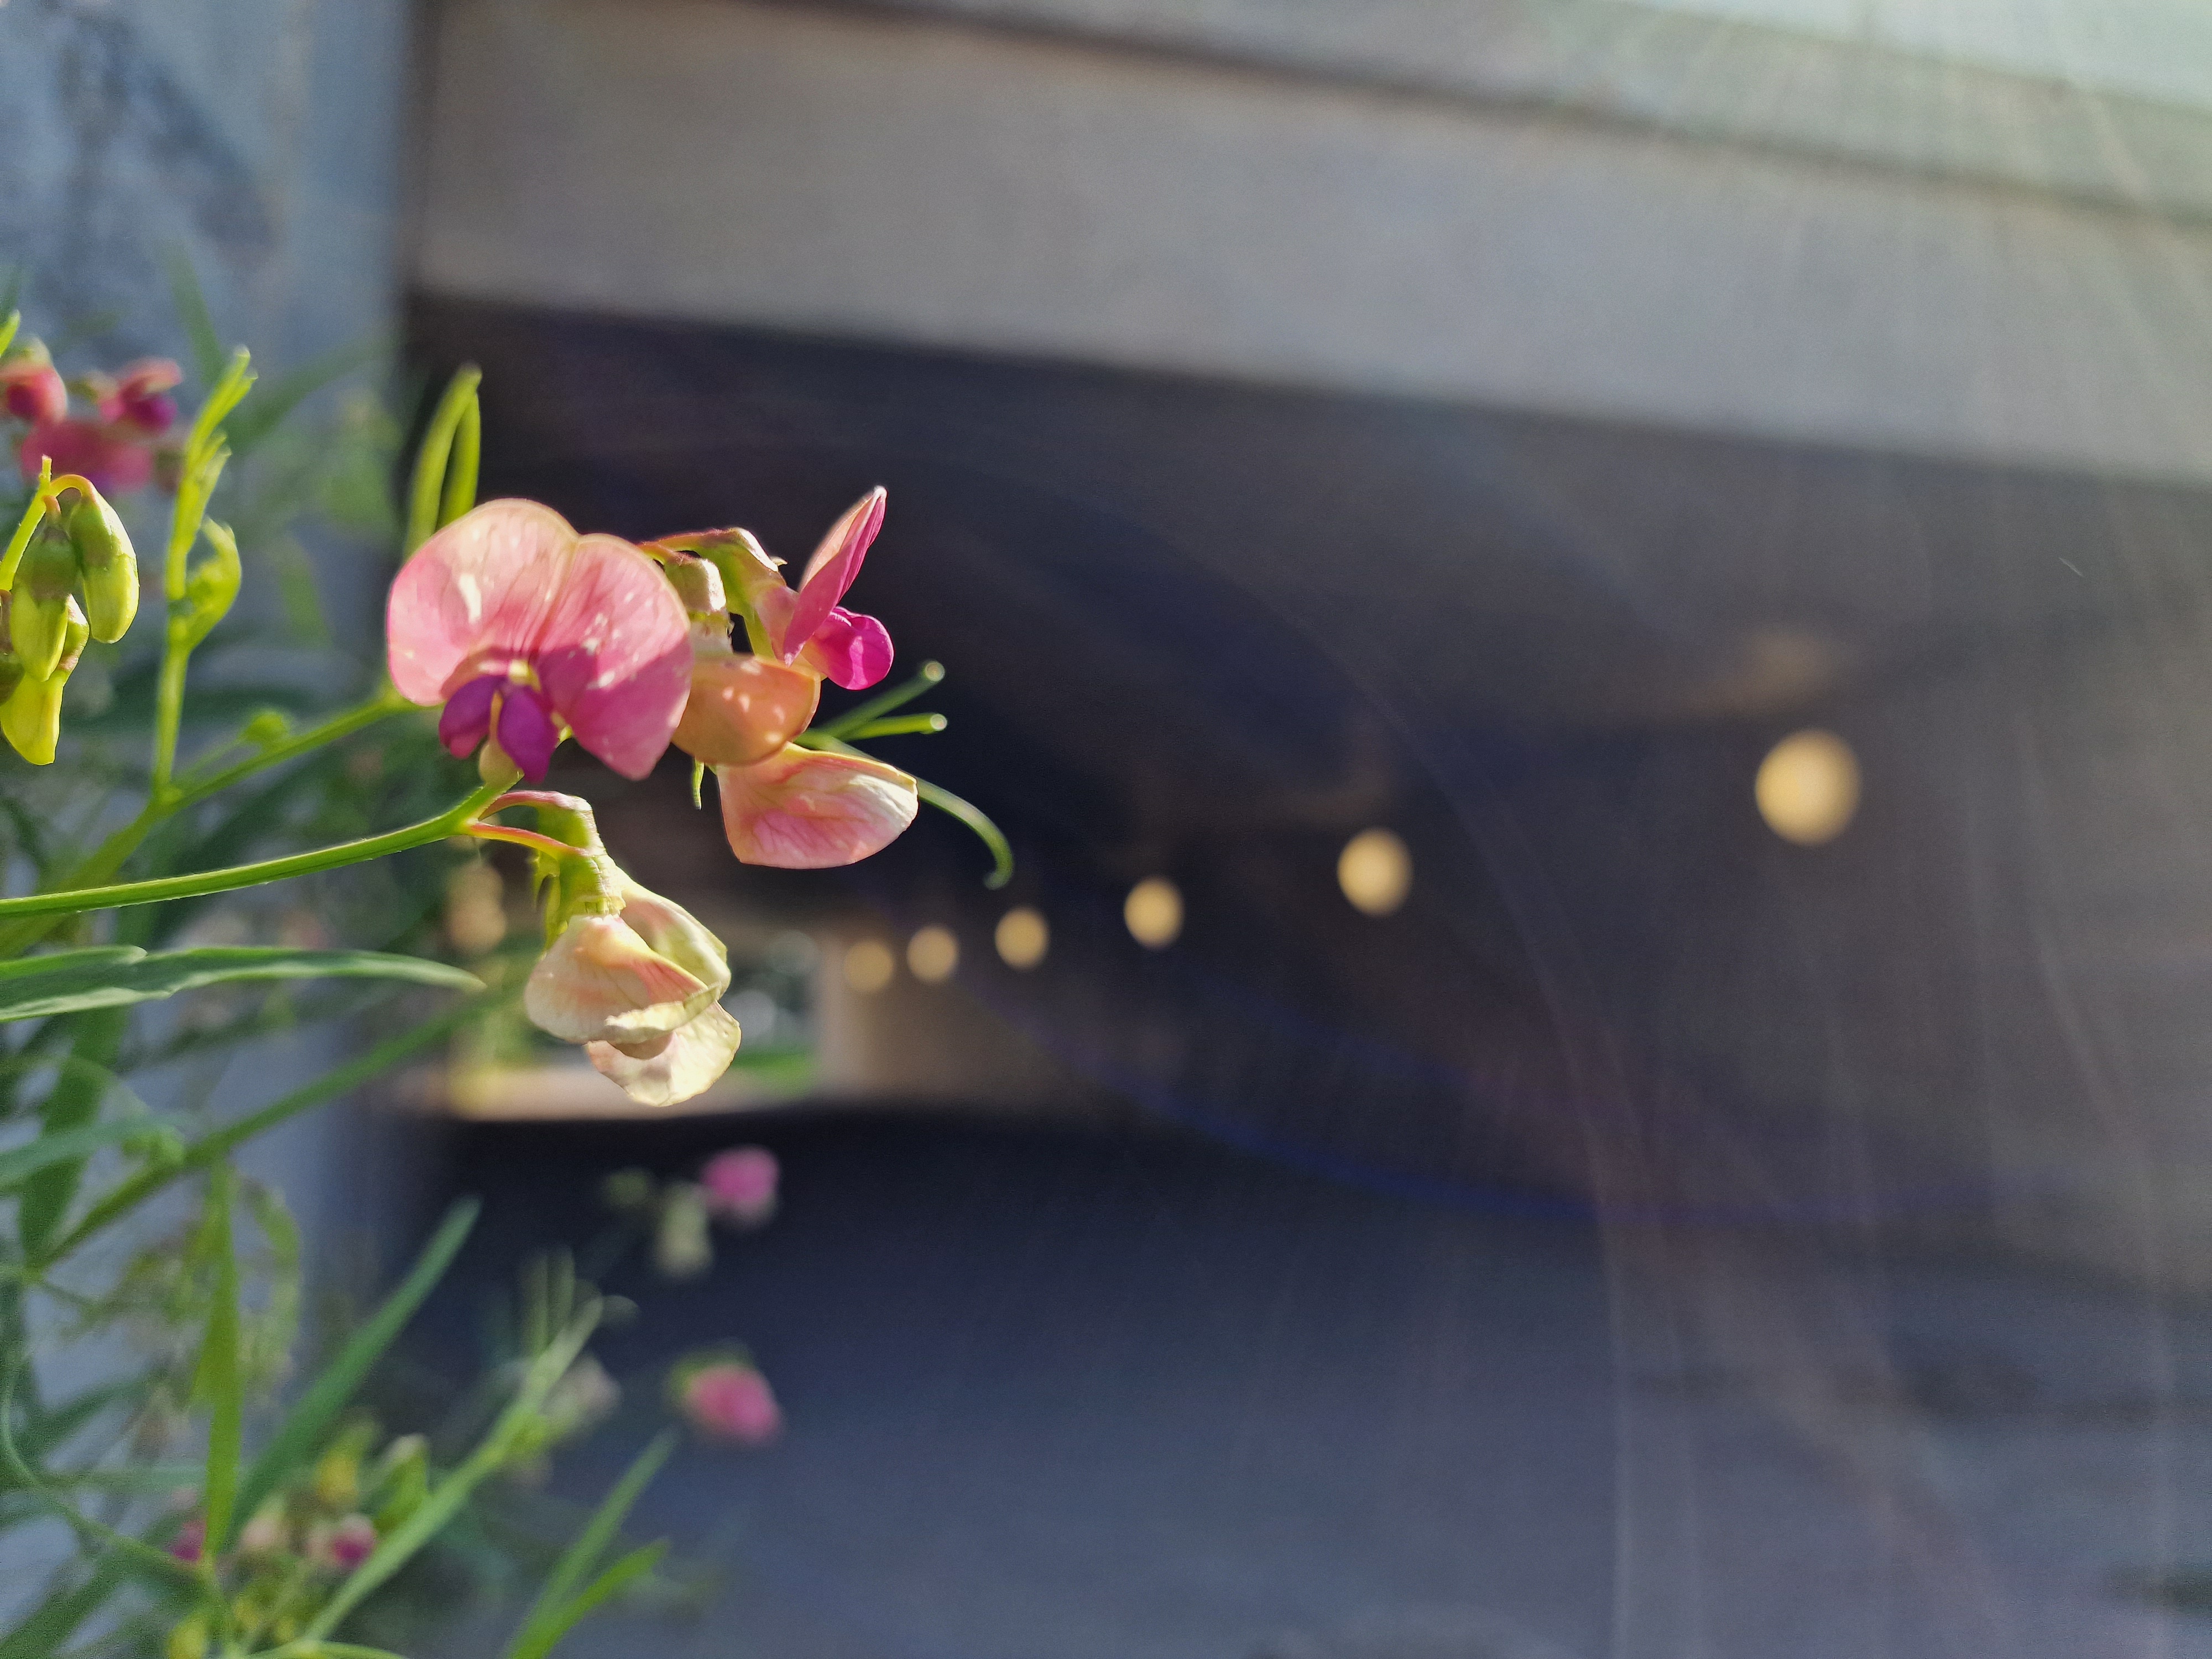
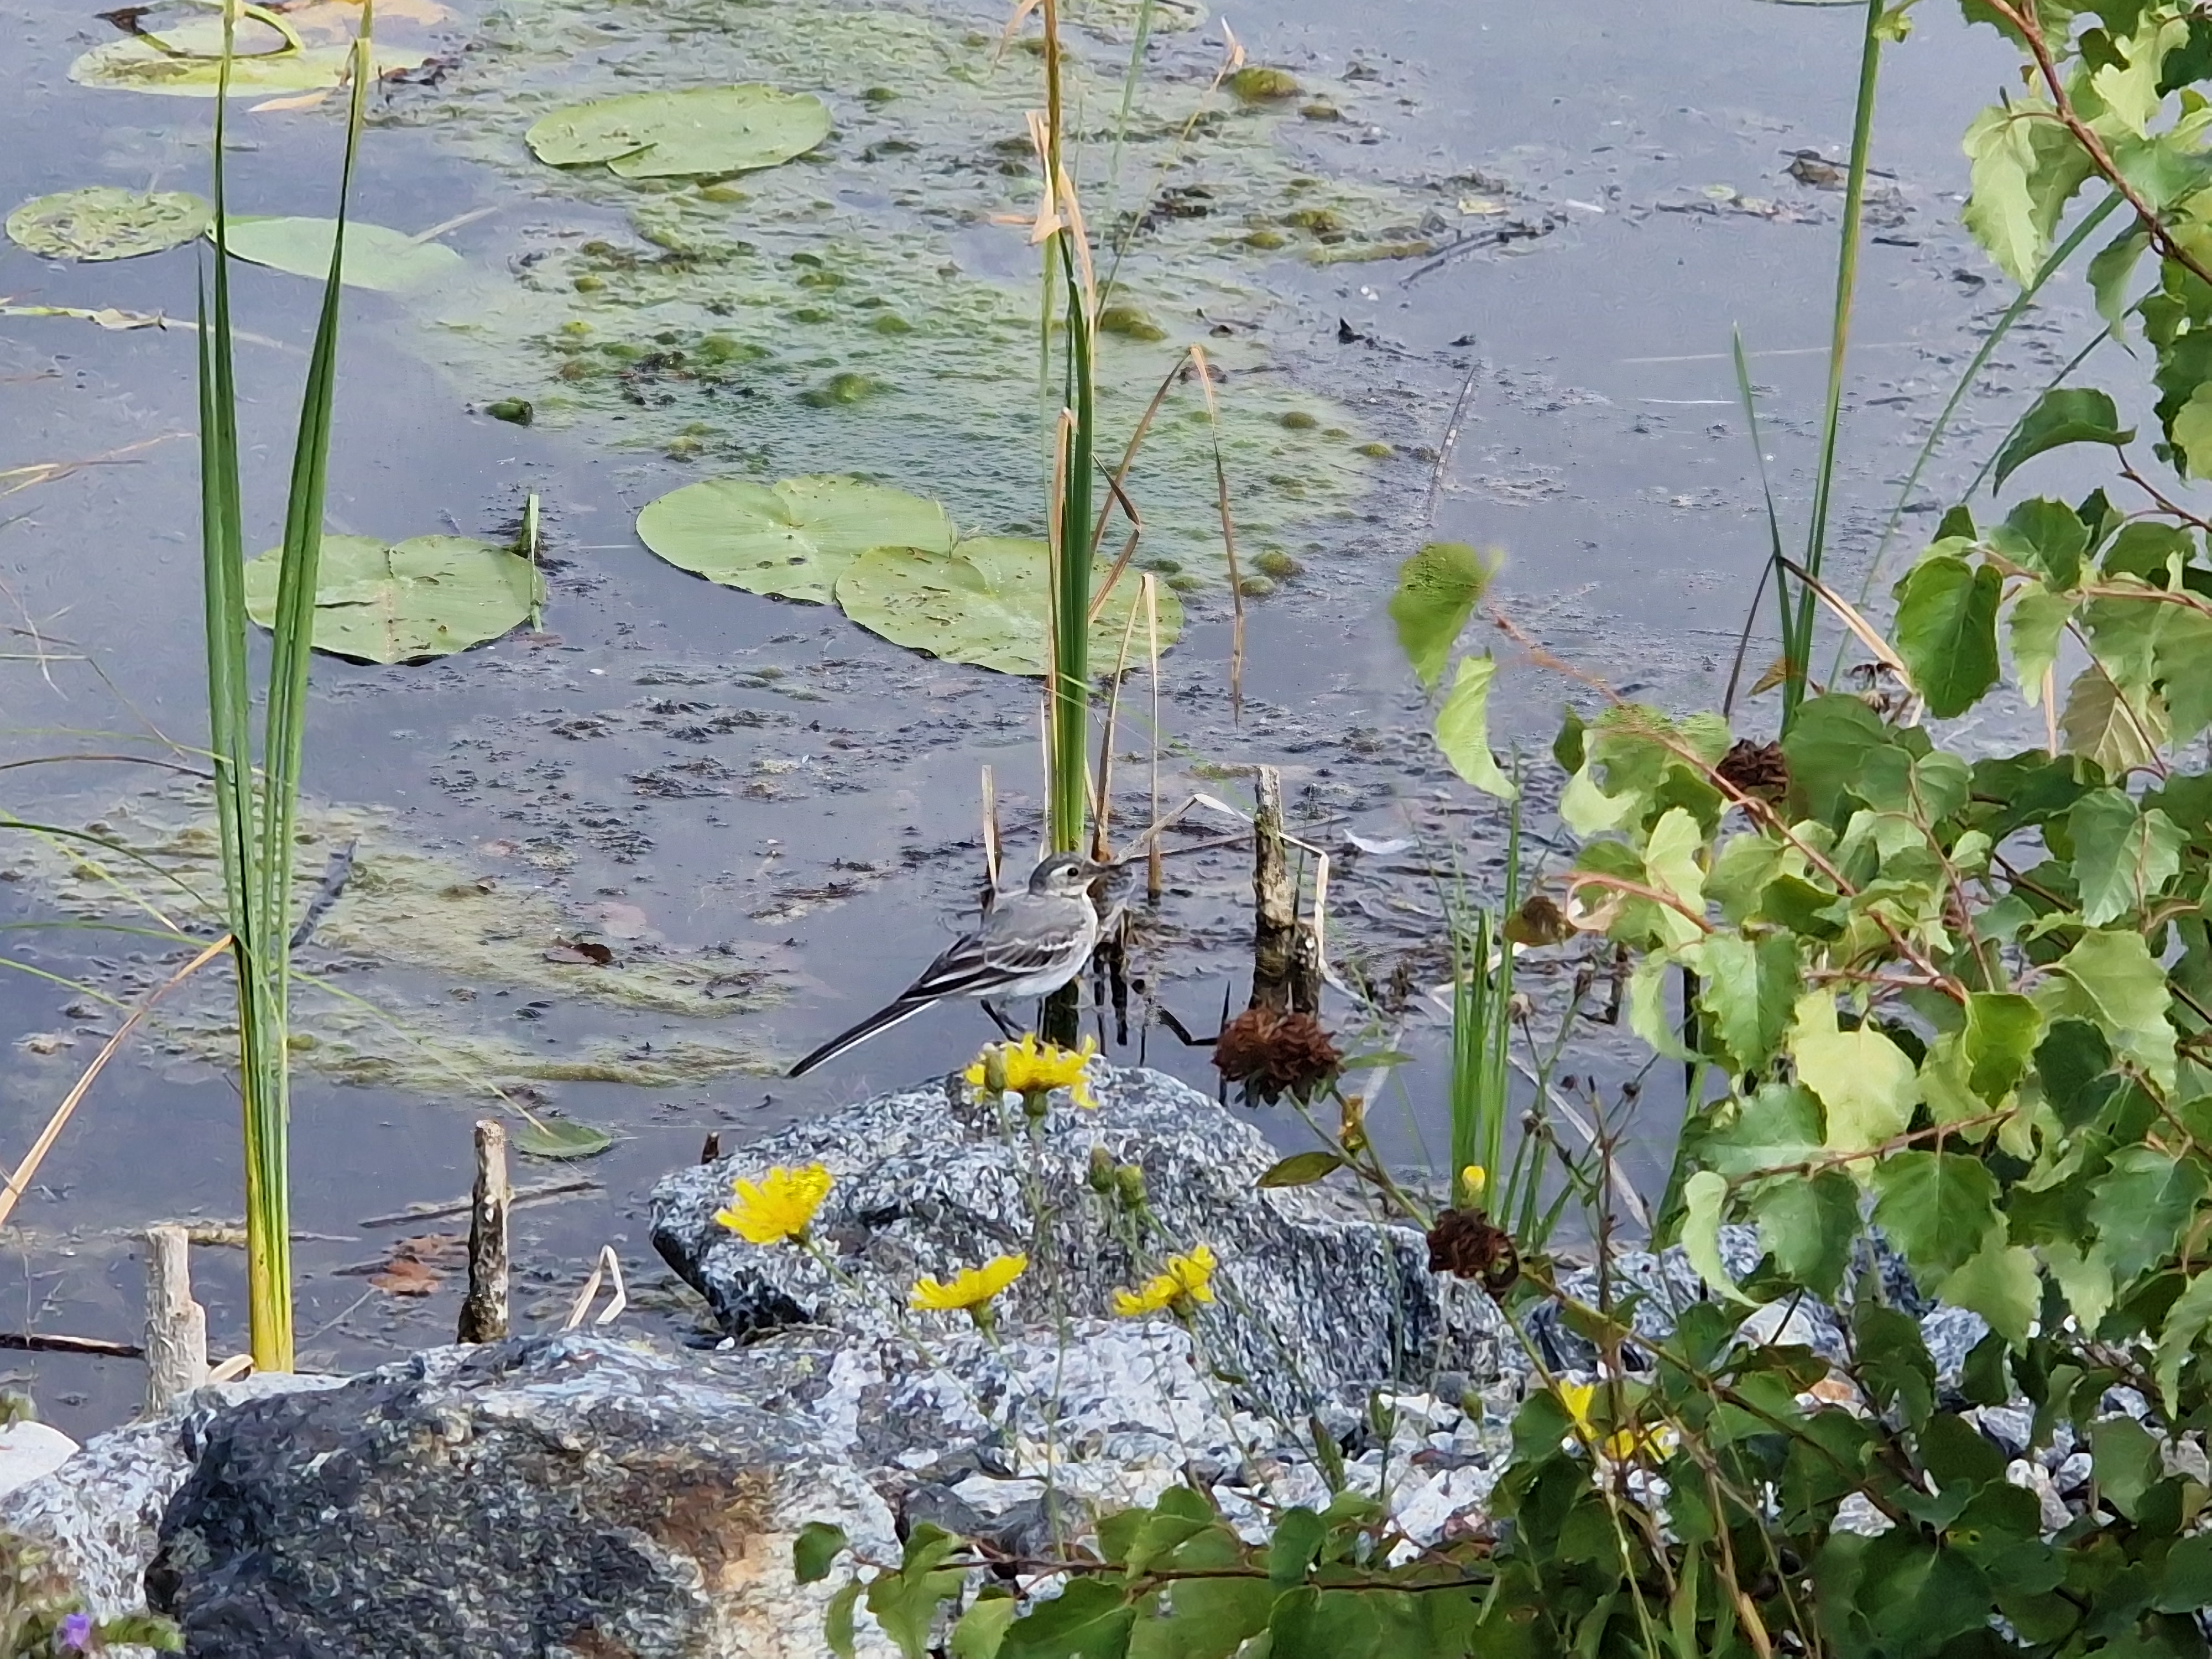
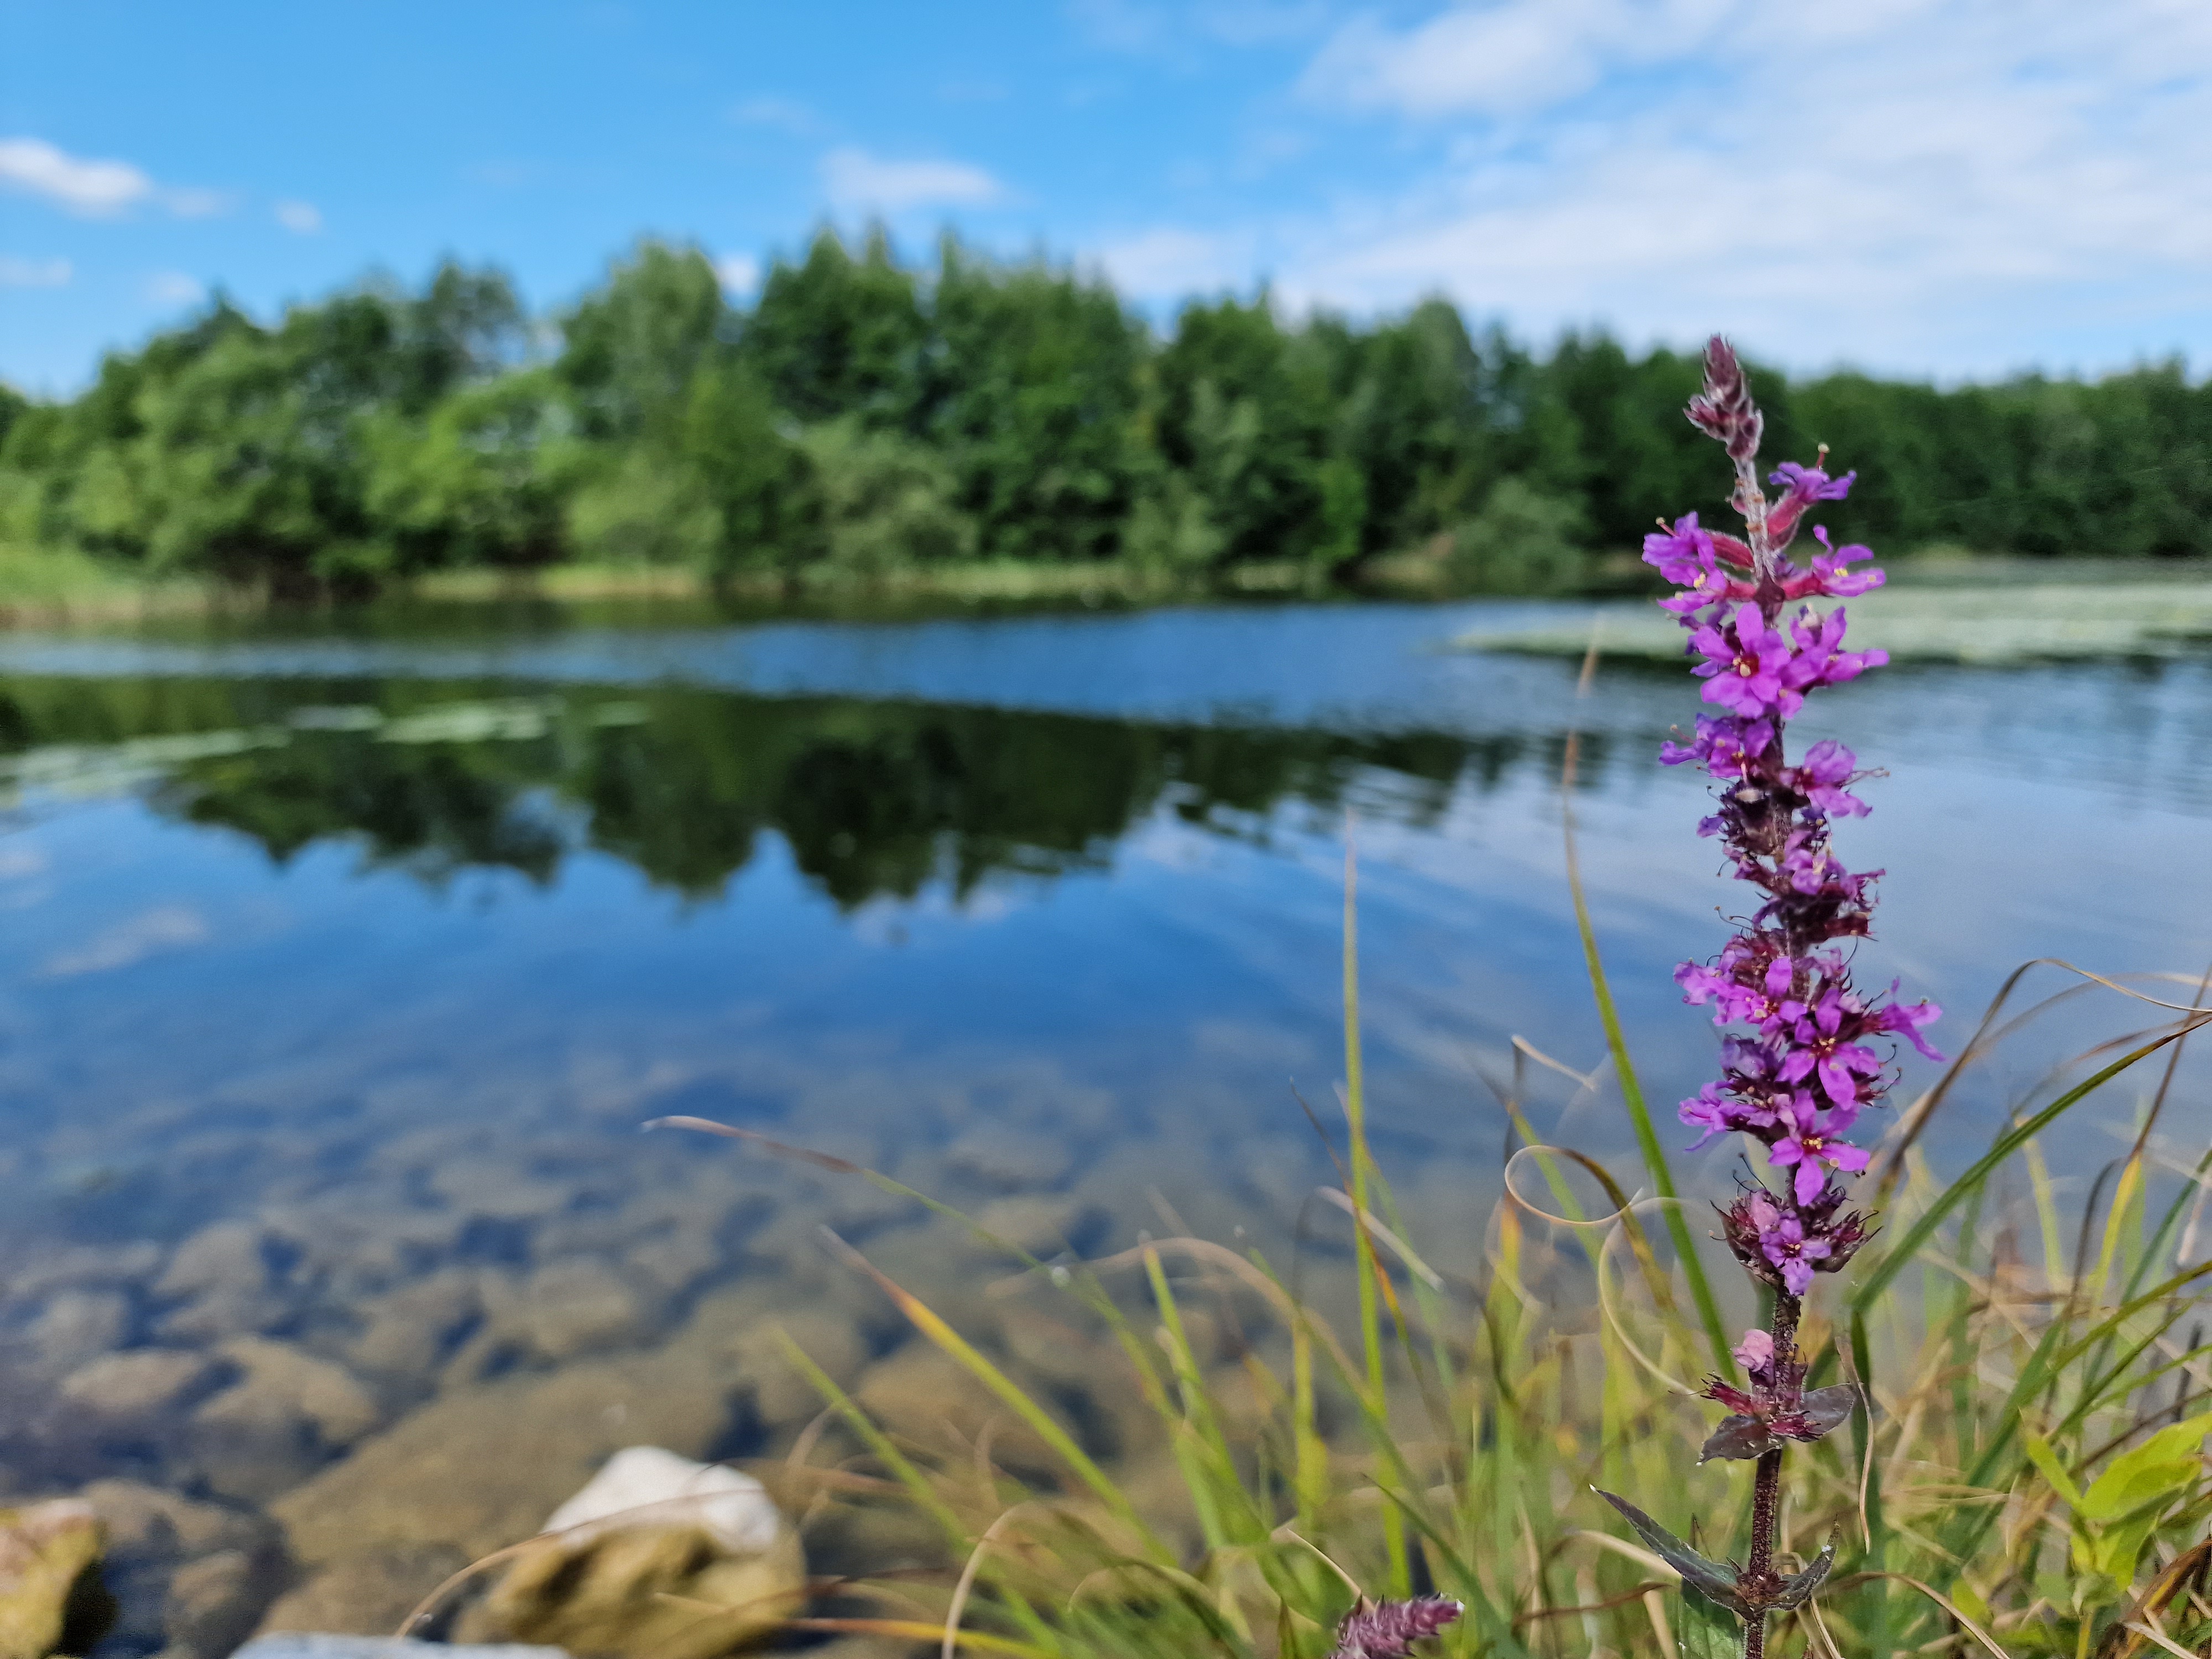
Third row: flowers on the airport concrete, a wagtail and Lythrum salicaria at the lake side.
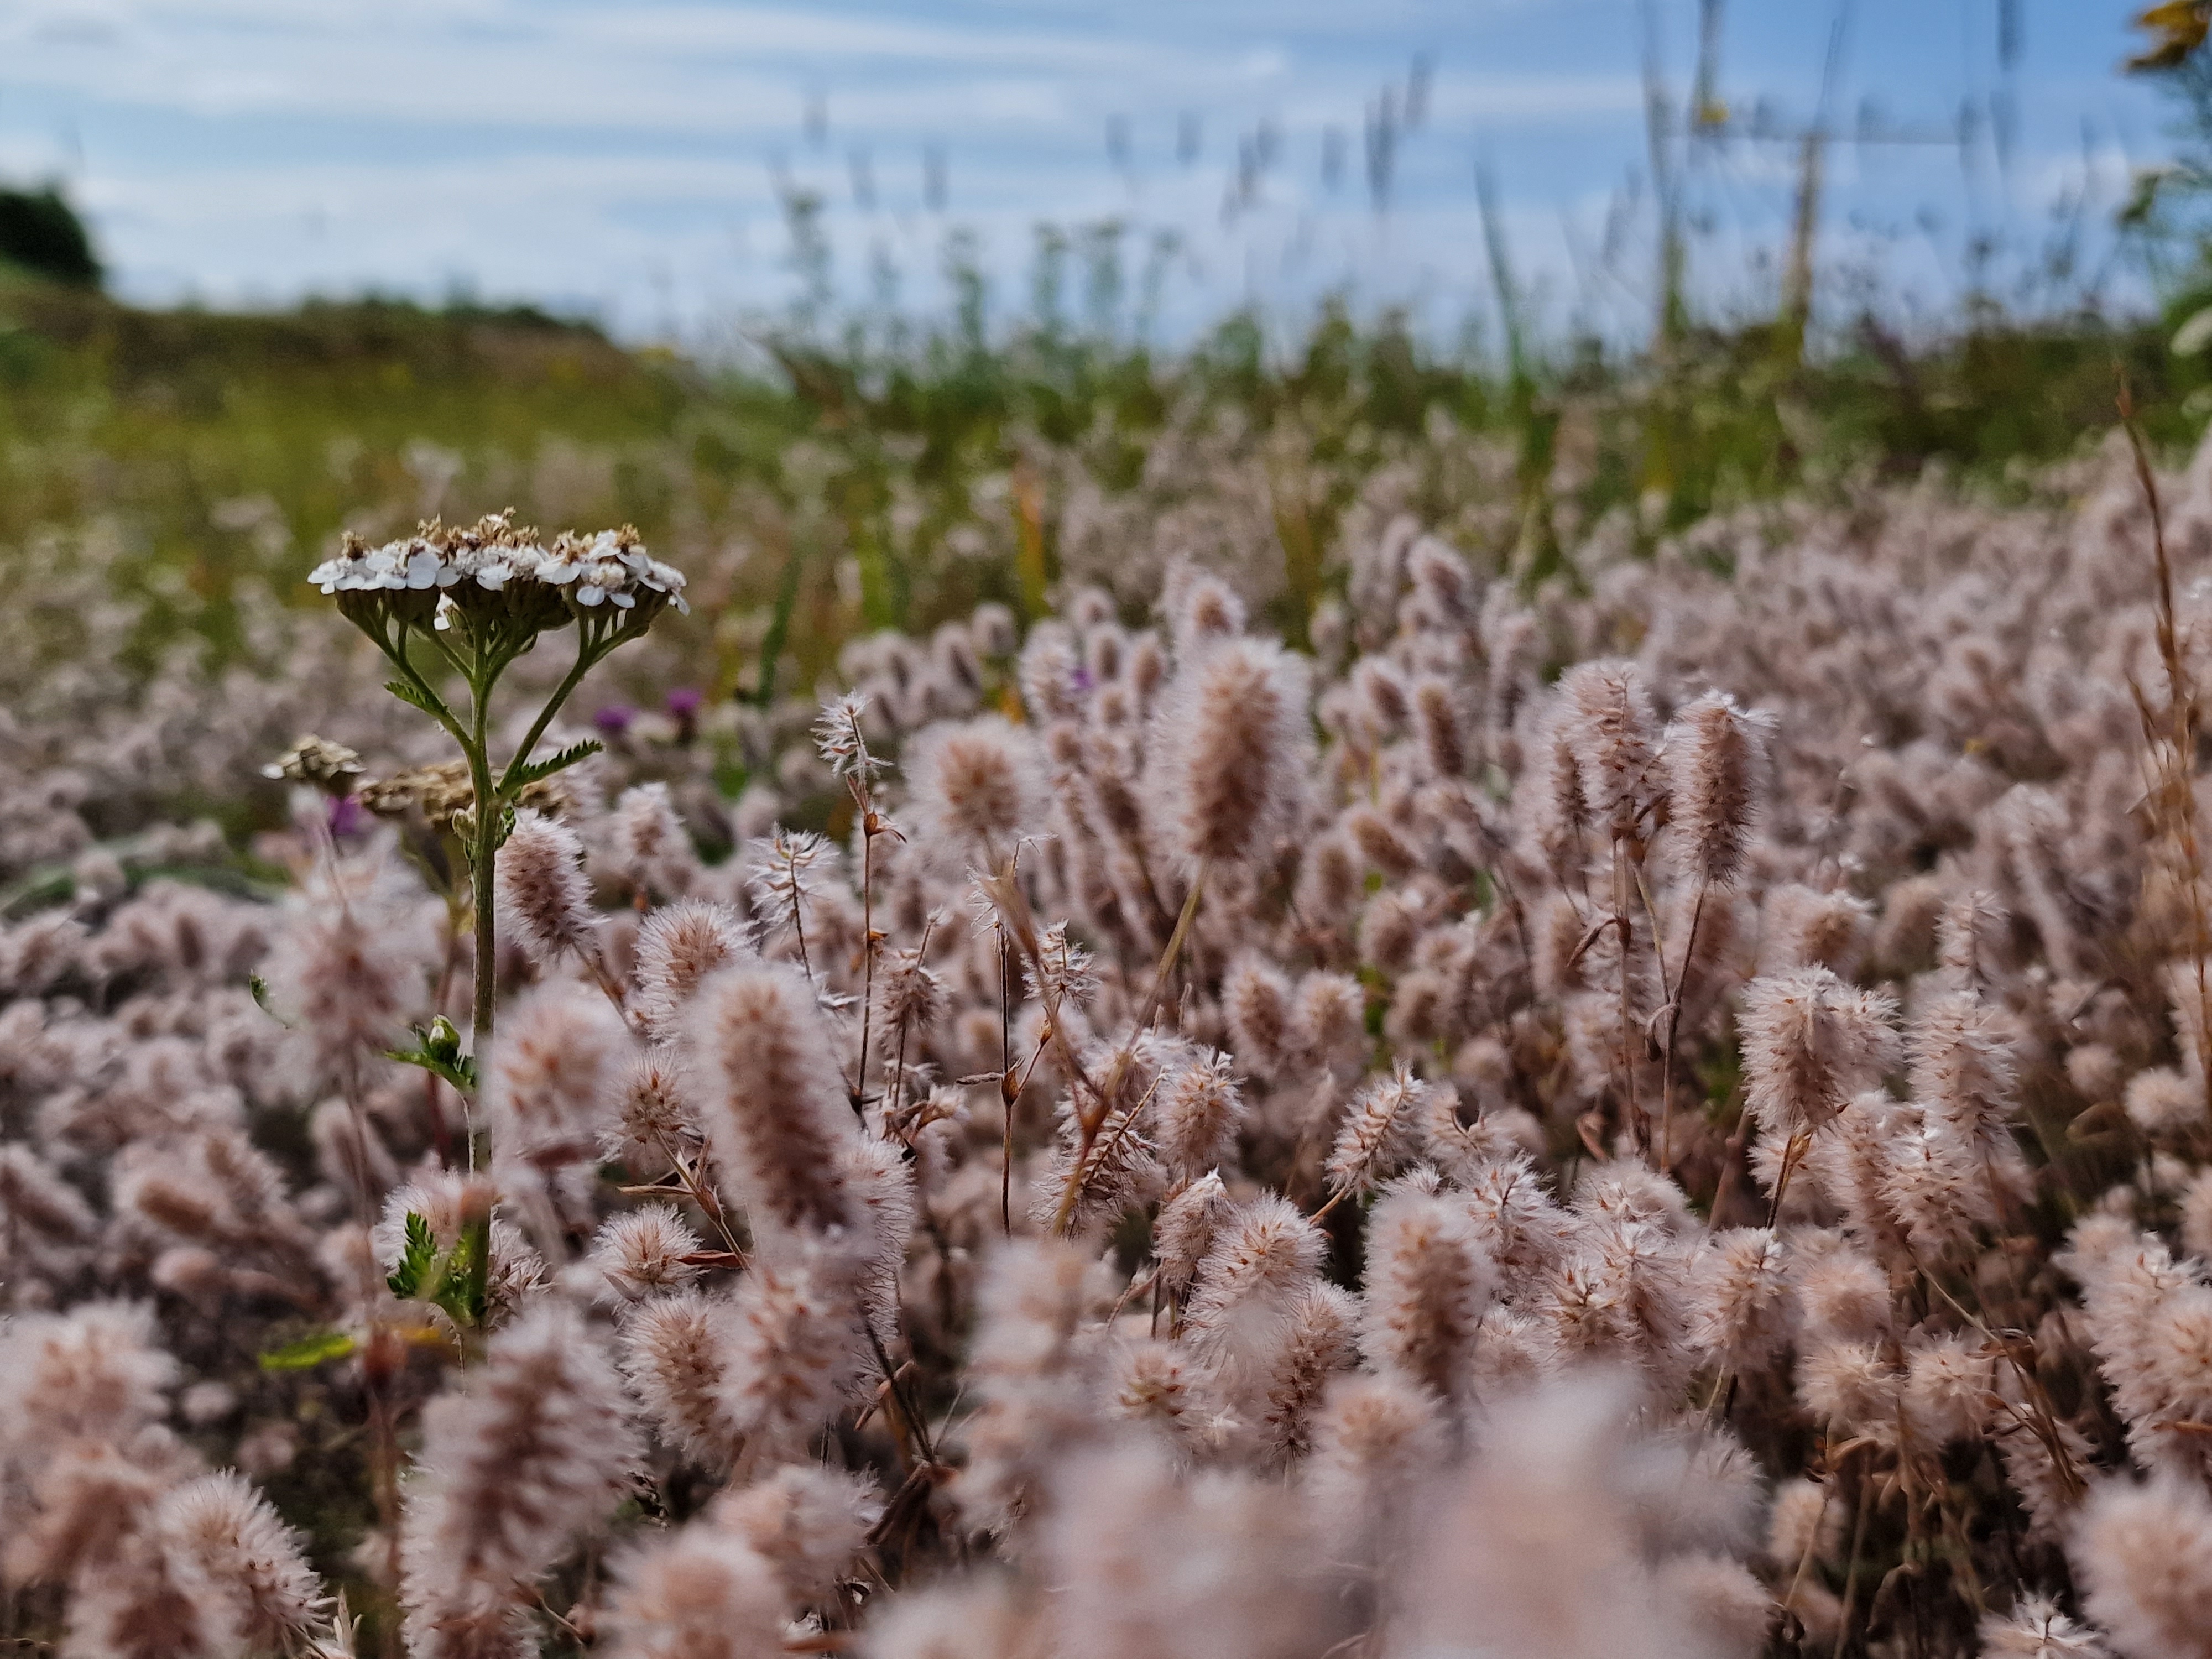
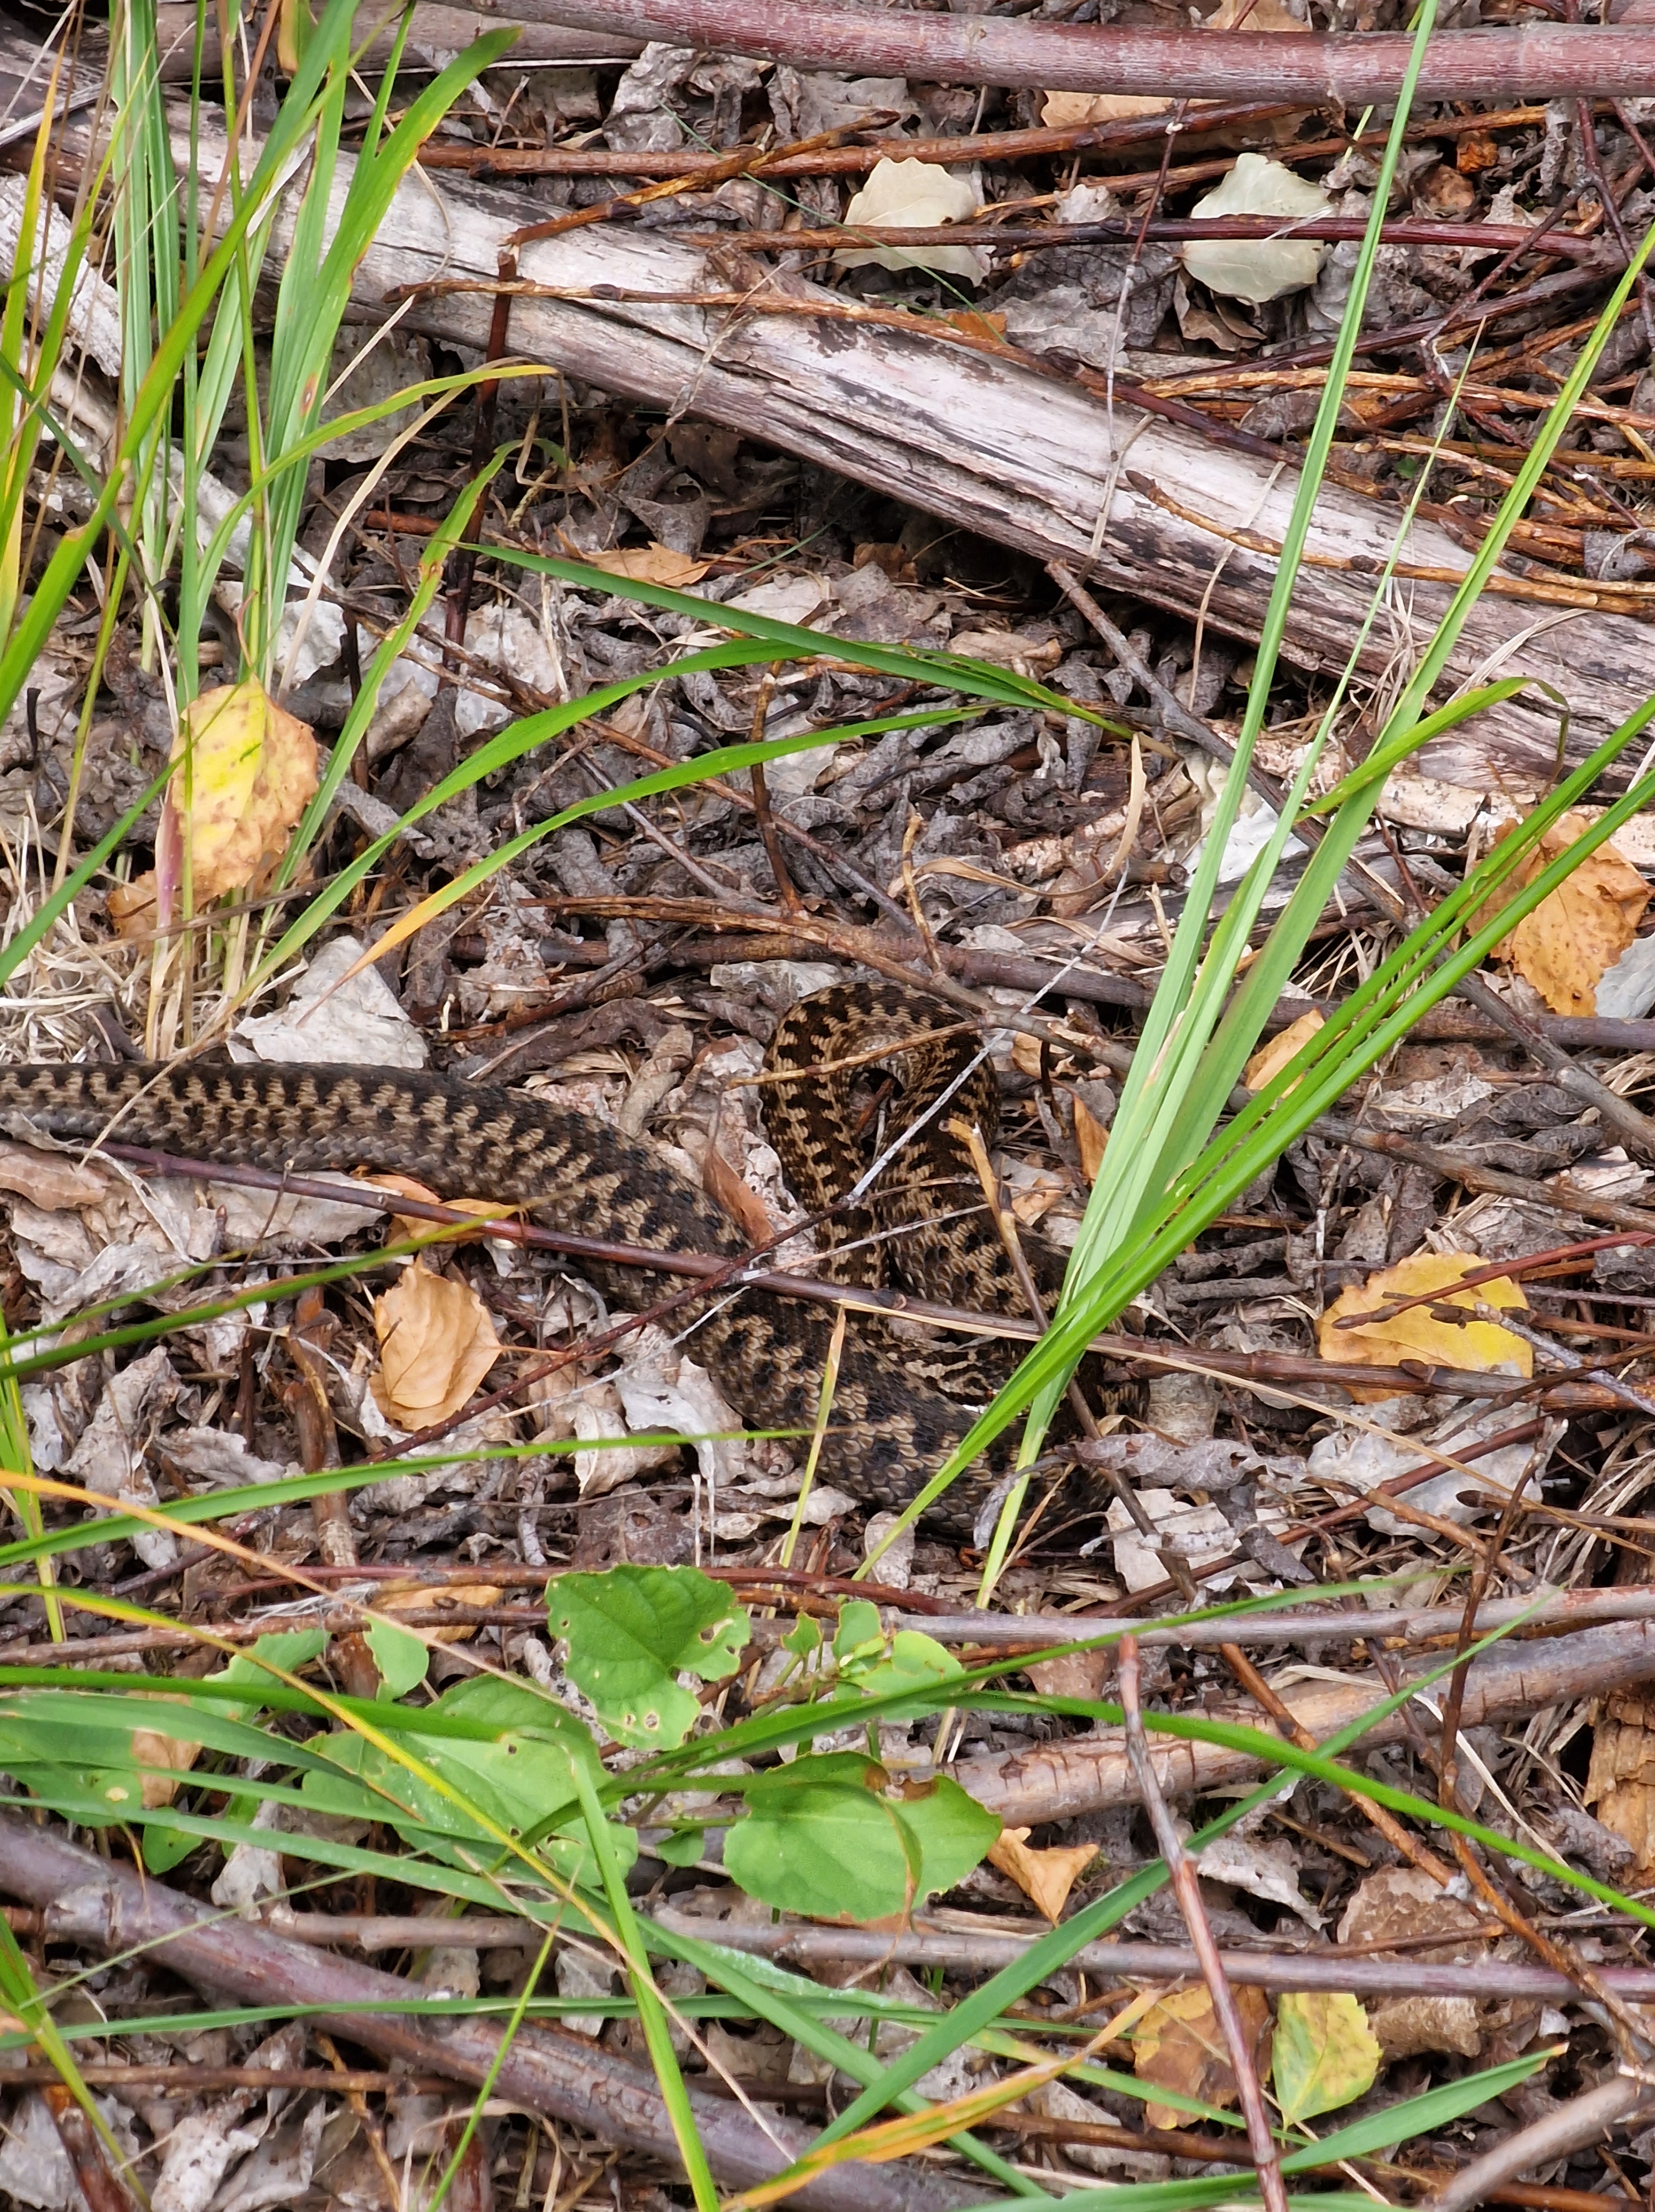
Bottom row: very fluffy fields of Trifolium arvense, more Swedish heathland, and the cherry on top: an adder!
Lake Törnetrask, Abisko Research Station, Abisko, Sweden
Saxifraga aizoides, Narvik, Norway
Laktatjakka valley
Pinus sylvestris, Narvik, Norway
Oenanthe oenanthe, alpine tundra Abisko, Sweden
Seen from Nuolja, Abisko
Norway
Trifolium repens
Laktatjakka valley
Skjomen valley, northern Norway
Narvik, Northern Scandes, Norway
Phyllodoce caerulea
Norway
Lake Törnetrask, Abisko Research Station, Abisko, Sweden
Hair’s tail cotton grass
Norway, Narvik
Narvik, Norway
Diapensia lapponica in one of our plots
Narvik, Norway
Lake Torneträsk, Abisko, Sweden
Luscinia svecica, Abisko, Sweden
Little red-and-white lighthouse
Narvik, Norway
Narvik, Norway
Common heather
Angelica archangelica
Lake Torneträsk, Abisko, Sweden
Luscinia svecica
Narvik, Norway
Sweden
Lake Torneträsk, Abisko, Sweden
Angelica archangelica along mountain road in the northern Scandes, Norway
Abisko, Sweden
Hallerbos 2017
Young bluebell (Hyacinthoides non-scripta) surrounded by flowers of yellow archangel (Lamium galeobdolon)
The common bluebell (Hyacinthoides non-scripta), the signature flower of the Hallerbos
Single bluebell flower surviving on a wetter spot, as indicated by the field of wild garlic (Allium ursinum)
A really wet patch of forest, with giant horsetail (Equisetum telmateia) in a field of wild garlic (Allium ursinum)
Wild garlic (Allium ursinum) in the Hallerbos flowers a bit later than the bluebells, yet this one was already in full bloom
A bumblebee visiting yellow archangel (Lamium galeobdolon)
A bumblebee visiting yellow archangel (Lamium galeobdolon)
Wild garlic (Allium ursinum)
Wild garlic (Allium ursinum)
Weirdly beautiful, the inflorescence of pendulous sedge (Carex pendula), typical for the wettest spots in the forest
Weirdly beautiful, the inflorescence of pendulous sedge (Carex pendula), typical for the wettest spots in the forest
A little stream in the Hallerbos, surrounded by endless fields of wild garlic (Allium ursinum)
The herb-paris (Paris quadrifolia), less common in the forest
Wild garlic (Allium ursinum)
Bluebells (Hyacinthoides non-scripta)
Weirdly beautiful, the inflorescence of pendulous sedge (Carex pendula), typical for the wettest spots in the forest
Another one from the wet plots: large bitter-cress (Cardamine amara)
Another one from the wet plots: large bitter-cress (Cardamine amara)
Young beech leaves, as soon as they are fully grown, spring in the understory is over
A beech forest without understory, most likely too dry and too acid for any survivors
A young beech seedling (Fagus sylvatica), looking nothing like a beech, yet everything like a tiny dancer
Young beech seedling (Fagus sylvatica)
Bluebells (Hyacinthoides non-scripta)
Bluebells (Hyacinthoides non-scripta)
Bluebells (Hyacinthoides non-scripta)
Mountain melick (Melica nutans), a grass in the most amazing green
Bluebells (Hyacinthoides non-scripta) in a rare patch of mountain melick (Melica nutans), a grass in the most amazing green
Bluebells (Hyacinthoides non-scripta)
Bluebells (Hyacinthoides non-scripta)
Montpellier 2017
The entrance to the cathedral of Montpellier
The cathedral of Montpellier
The entrance to the cathedral of Montpellier
The cathedral of Montpellier
Narcissus poetics
The cathedral of Montpellier
The botanical garden of Montpellier
The botanical garden of Montpellier
The botanical garden of Montpellier
Brackish Camargue vegetation
Brackish Camargue vegetation
Brackish Camargue vegetation
A typical lagune
Brackish Camargue vegetation
Camargue horses
Camargue horses
Camargue horses
Brackish Camargue vegetation
Brackish Camargue vegetation
Brackish Camargue vegetation
Camargue horses
Brackish Camargue vegetation
Little egret in the evening sun
Flamingo’s in the evening sun
A typical lagune
Dandelion fuzz
Grass lily
Grass lily
Dandelion fuzz
Veronica in a sea of poplar fluff
Euphorbia in a sea of poplar fluff
Poplar
Gare du Midi, Brussels
Gare du Midi, Brussels
Gare du Midi, Brussels
Gare du Midi, Brussels
Sweden autumn 2016
Autumn in Abisko
Yellow leaves of mountain birch, with lake Torneträsk in the background.
Lapporten, the gate to Lapland, in Abisko
Rain blowing over the Abisko National Park
The colours of the north: red fireweed and yellow mountain birches, with lake Torneträsk on the background
Yellow leaves of mountain birch, with lake Torneträsk in the background.
Rain on the background, the ski lift in Abisko on the foreground
The steep slope of mount Nuolja on a dramatic looking morning
The beautiful colors of lake Torneträsk in Abisko
A little stream on top of the mountain, with a view on Lapporten, the gate to Lapland
Well, that is a beautiful table with a nice view on lake Torneträsk in Abisko
Our little experiment on top of the mountain in Abisko, with a view on Lapporten
Autumn in Abisko is extremely colorfull
The ski lift with a view on Abisko National Park and Lapporten
Hiking dowhill towards lake Torneträsk
This green is greener than the greenest green: moss on top of mount Nuolja
Well, that is a beautiful table with a nice view on lake Torneträsk in Abisko
The ski lift with a view on Abisko National Park and Lapporten
The ski lift with a view on Abisko National Park and Lapporten
The most beautiful hiking trail of the world: Nuolja in Abisko
Angelica archangelica, often the biggest plant of the Arctic
The most beautiful hiking trail of the world: Nuolja in Abisko
Cirsium helenioides, the melancholy thistle
Hiking down mount Nuolja
The steep slope of mount Nuolja on a dramatic looking morning
The colours of the north: red fireweed and yellow mountain birches, with lake Torneträsk on the background
The prettiest yellow and blue: autumn in Abisko
Fireweed, Epilobium angustifolium
Campanula or bellflower, I think ‘uniflora’
Vaccinium myrtillus
Cornus suecica, the prettiest red of the world
Hieracium alpinum, alpine hawkweed
Carex atrata, one of my favourite sedges
Alpine clubmoss, Diphasiastrum alpinum
Agrostis capillaris, bentgrass
Common yarrow (Achillea millefolium)
Anthoxanthum odoratum, sweet vernal grass, fully grown and mature
Snow scooter trail
Our plot in the mids of a field of horsetails (Equisetum pratense)
Equisetum pratense
Cliff overlooking the valley with the road to Norway
Seedling of Taraxacum officinale, the dandelion, after two years of growing in bad conditions
Poa alpina, the alpine meadow-grass, with its viviparous seeds
Massive flowerhead of Angelica archangelica
Angelica archangelica
Blueberry (Vaccinium myrtillus) in autumn
A lowland marsh in Abisko in autumn
Installing the plots of our trail observations on top of mount Nuolja
Installing the plots of our trail observations on top of mount Nuolja
Tanacetum vulgare (Tansy), non-native for the high north
Autumn forest down in the valley
The valley of Nuolja to Björkliden
Summer on the Nuolja-side
A full rainbow behind mount Nuolja in Abisko
It’s raining in the west, clouds trapped behind the mountains
A strong wind blowing rain from behind the mountains to our side
A strong wind blowing rain from behind the mountains to our side
Betula nana, the dwarf birch, mini autumn forest
Betula nana, the dwarf birch, mini autumn forest
The valley of Björkliden in autumn
The valley of Björkliden in autumn
The valley of Björkliden in autumn
The valley of Björkliden in autumn
Sweden spring 2016
Melting snowpatch on a lake
Ranunculus glacialis
Eriophorum vaginatum
Salix reticulata
Dryas octopetala
Trifolium pratense
Trifolium repens
Ranunculus glacialis
Bartsia alpina
Rubus arcticus
Silene suecica
Although the alpine zone has been harder for invasives to access than most places, human structures like trails are often an easy gateway for the invaders to get up there. Picture from Abisko, Swedish Lapland.
Oxyria digyna
Western European species like the red clover (Trifolium pratense) here are often listed as non-native species in mountain regions.
A rainy hike
Overlooking the valley of Laktajakka
Silene acaulis
Cornus suecica
The valley of the lakes
Amiens
Sunny but cold, the Quai Bélu
Le Club d’Aviron in winter weather
Cathedral with a glimpse of spring
Cathedral seen from the frozen Parc Saint-Pierre
Frozen to the bone
Almost cold enough for ice-skating
Maria without a shirt
Cathedral at night
Sun rising above the water
Gargoyle planning to eat the cathedral
The southern side
Amiens is filled with cute little houses
Colourful mirror
Frozen mirror
Just outside of Amiens
View from my office window
View from my office window
Cathedral at night
Cathedral at night
Winter sun on the Place du Don
House on the square before the cathedral
Cold!
Nice architectural curve
Enjoying silence and the morning sun
Cathedral at night
Sunny but cold, the Quai Bélu
The museum behind the beautiful gates
Sweden autumn 2015
Lichen
Sweden summer 2015
View on the 1000 meter plots
Doing research on a cold Arctic morning
Plots flooded by the snowmelt
Flooded by the snowmelt
Meltwater river, racing down the mountain
After a hike, even the most basic house looks cosy. Little hut in the mountains, open for everybody
Snowbridge, maybe don’t cross…
Snowbridge
View from a cliff
Silene acaulis or cushion pink, cutest plant of the Arctic
Two seasons in one image
Steep slope
Hiking down
Narvik Kirche, church of the subarctic
Narvik Kirche
Reindeer on top of the mountain
Narvik Kirche
Summer at the church
Summer flowers
Massive waterfall
Young willow catkins
View from Narvik’s hospital, with lilac flowers
Building a bridge over the fjord will gain al drivers at least an hour
Norwegian fjord
Posing with the water, getting soaked
Minimalistic mountains
Insect investigating our reindeer antler
Catching mosquitoes with our license plate, harvest of the year!
Posing with the plot
Fieldwork on the most beautiful spot of the world
Fieldwork on the most beautiful spot of the world
Summer bridge – still next to the sadly impassable river
Rhinanthus flower in the mountains
Plateau in the valley, beautiful brown
Experimental view from my favourite plot
Salix catkins
Extremely old Betula tree
Waterfall from a cliff
Buttercup is the earliest in spring, here
Rocks!
Alpine views
Views!
Fieldwork
Jumping over rivers
Plot
Golden plover
Angry lemming
Green, the whole north is green!
Snow, so much snow left!
Minimalistic mountain moments
Fieldwork
The research center
Red clover – focal invader
Look at this tiny cute snail!
Massive floods of melting water
Bartsia alpina
Hooray, a toilet!
Dryas octopetala
Lowest elevation plots
Butterball!
That’s a lot of water
Midnight sun is the best
At the lakeside
Beautiful Bistorta vivipara
Don’t fall in the water
Midnight sun
Wild river
Art – made by ages of wild rivers
Baby firework for America’s independence day
Midnight sun at the lake
The Abisko canyon was wilder than ever
That’s a crazy amount of water!
The Abisko canyon was wilder than ever
The Abisko canyon was wilder than ever
Black and white
Stone-man overlooking Abisko
Nothing as soft as a willow catkin
Label and soil temperature sensor attached
I’d drive to the top every day
Reflections
Rocks and clouds
Brave little birch
Brewing our camping poison
Basic camping stuff
Camping in Norway
Home-made temperature houses
Roadside research at its best
Norway is crazy
Horsetail is so funny
Little creek in magical forest
Birches, birches everywhere
Beautiful rock, a gift from the river
Another roadside fellow
Lichen
Ready to rock the summer
Collecting mosses
That’s a crazy old lichen
Tiny tiny piny trees, but old, so old!
Ready to jump into the fjord?
Ready to jump into the fjord?
That’s a spiky stone!
Views on Norwegian fjords
Silene in the mountains
Cute little orchid
Skua
Attacking skua, mind your heads!
Watch out for the attack of the fierce skua!
Black snail
New plot!
Still a lot of snow to melt, but this spot was free for a new plot
Reindeer are better than people
Two seasons in one picture
Let’s see what is happening to the balance in mountains! Is this a starting avalanche, or will it last a bit longer?
Cute little hut
Climbing mountains by car
Softest moss in history
Drosera in the marsh
Hiking in no-man’s land
The clouds are coming
Abisko valley
‘Butterball’
Fieldwork in the tundra
Abisko valley
Little plot
Clouds and sun and mountains
Making soup on a campfire with a view
Little creek on high elevations
Skua on the look-out
Melting snow in a river
Rhodiola rosea and the Törnetrask lake
Beginning of spring
Flooded plots, melting snow, impassible wetness
Ferns and horsetails
Chile 2015
Lunch made by our local colleague, with funny bread (tasty as well!)
Trips to the field sites were sometimes a real adventure, especially right after snowmelt


")


")
")


")


")


")


")


")


