Monocultures

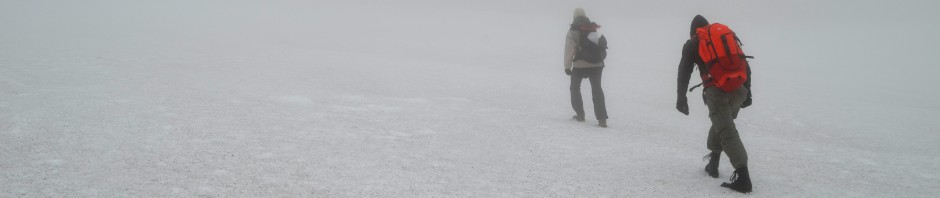
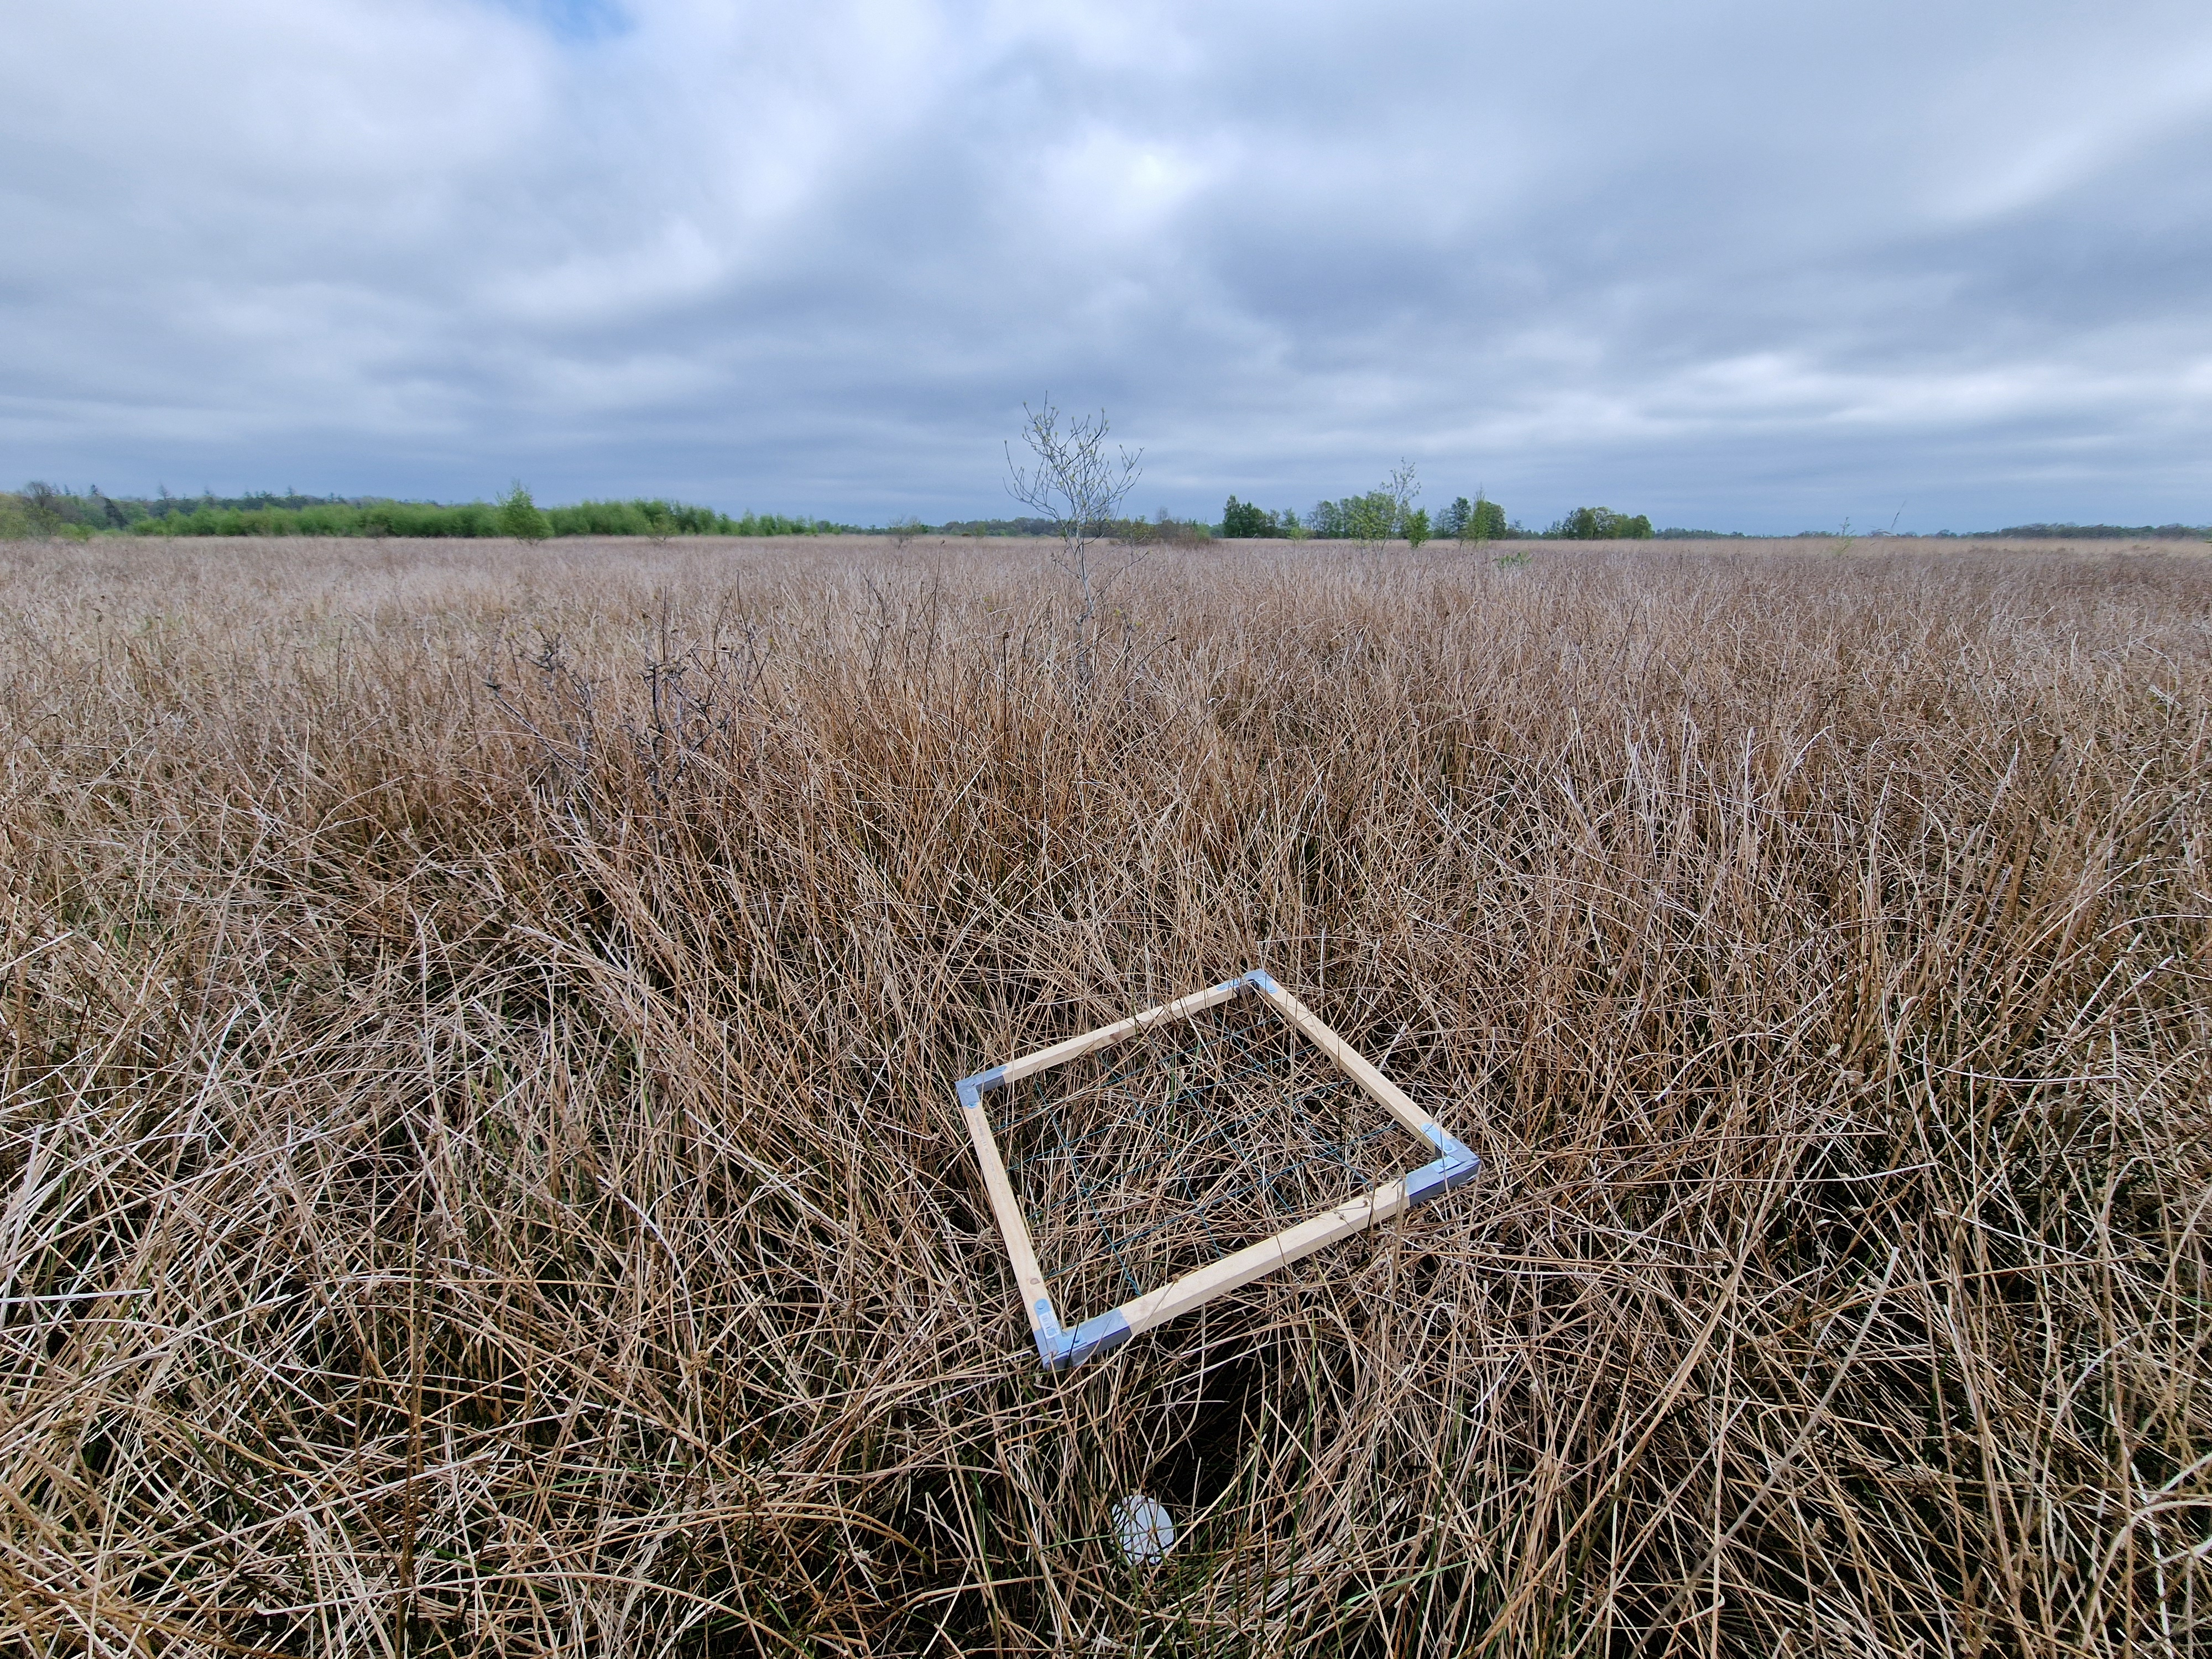
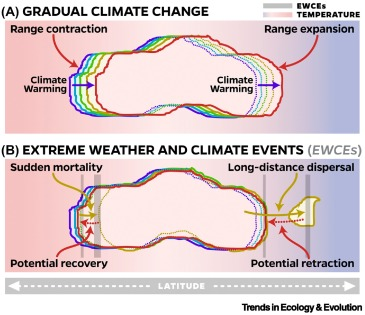
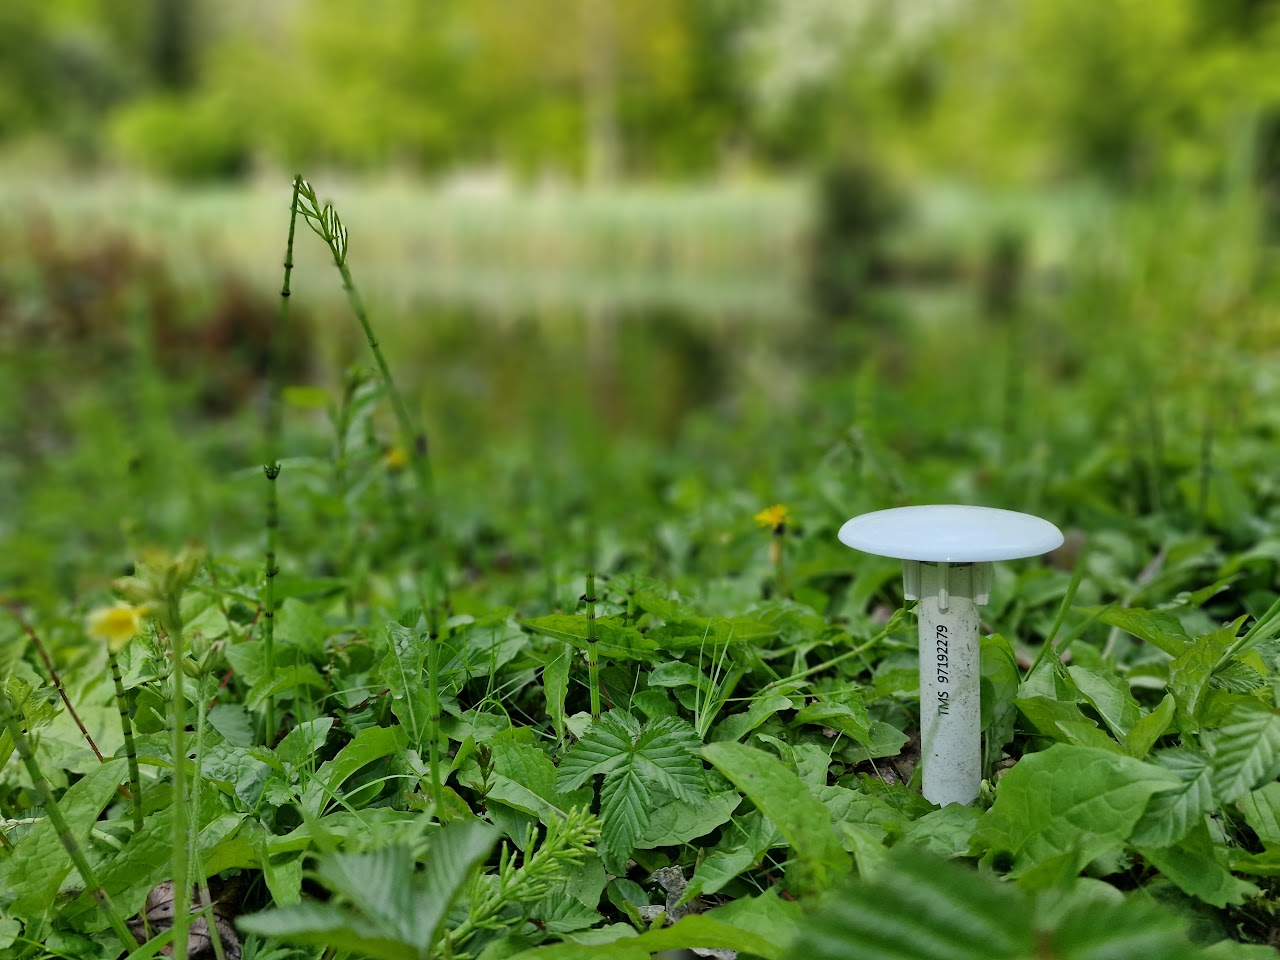
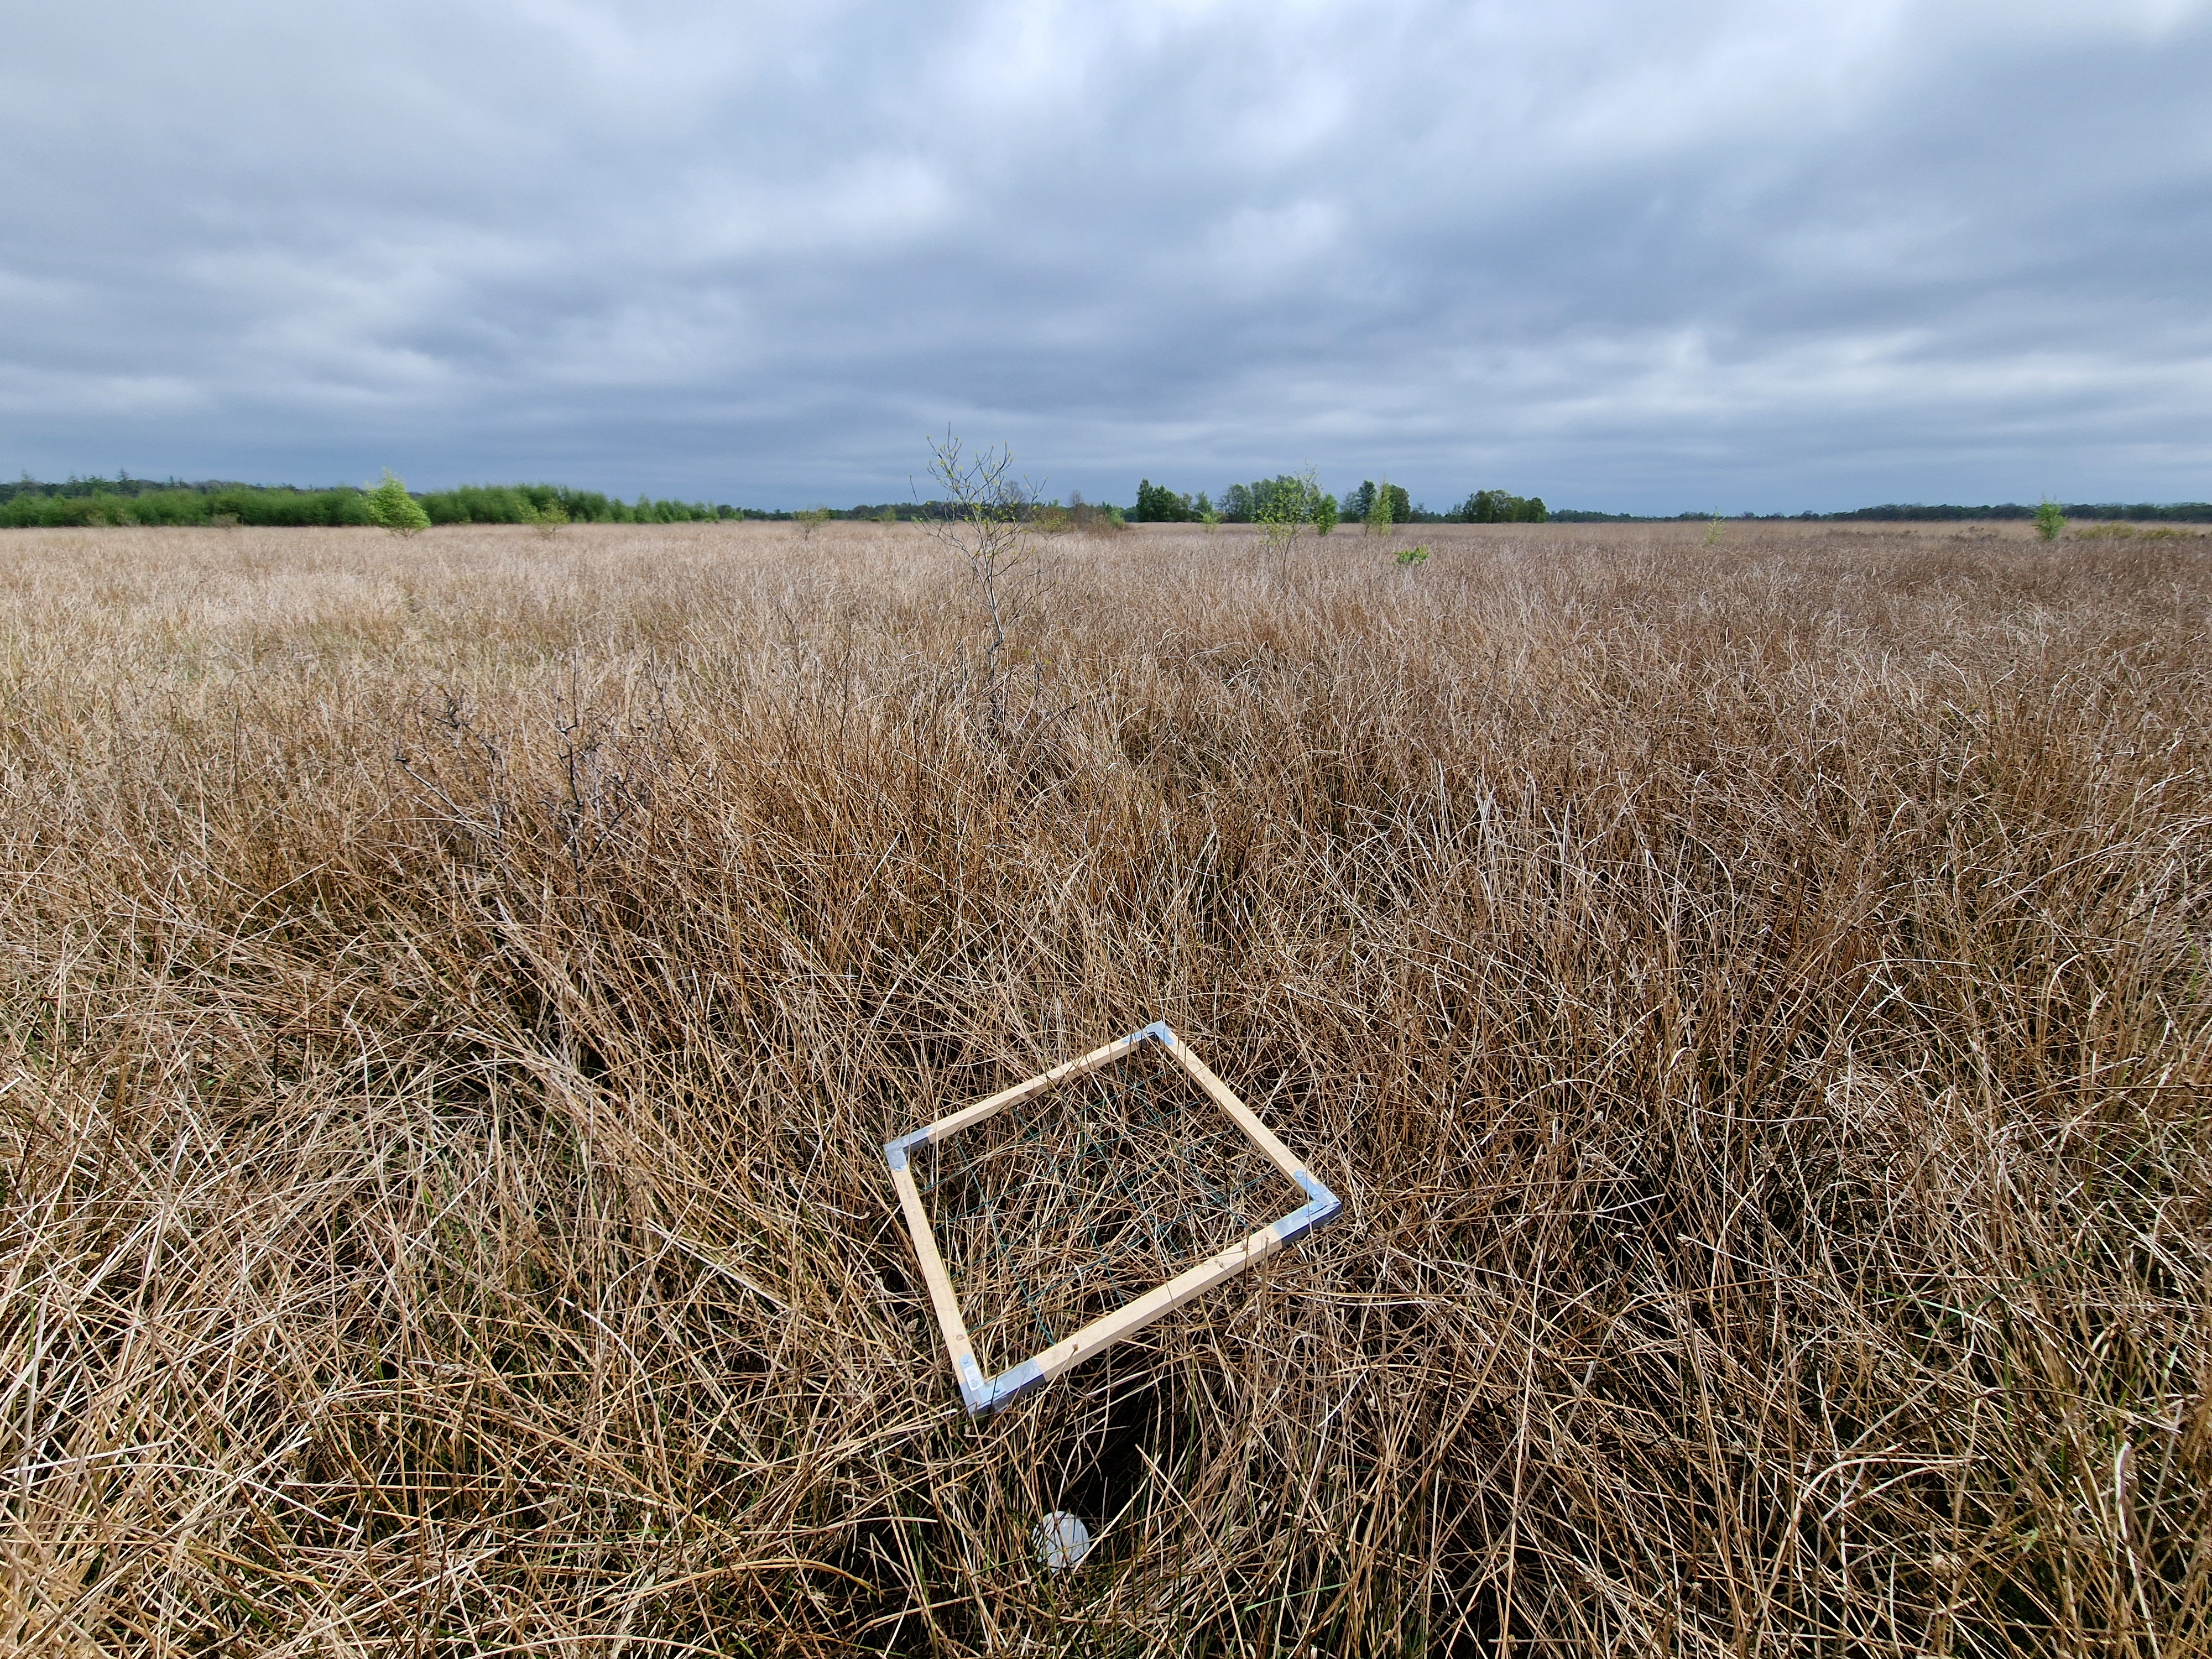
Our EcoFracNet biodiversity monitoring project is gathering momentum. Over the past months, we’ve been roaming the Netherlands, clipboards in hand, from endless heathlands to city parks, to record plant diversity in hundreds of 1 m² plots. With several hundred plots under our belt, we’re starting to get a sense of what’s out there.

And one thing is clear: we’ve met a lot of monocultures.

A monoculture of Lolium perenne (perennial ryegrass)

Sometimes it’s a square meter with just one or maybe two plant species in them. Sometimes those monocultures stretch as far as the eye can see. But even a monoculture isn’t always what it seems.

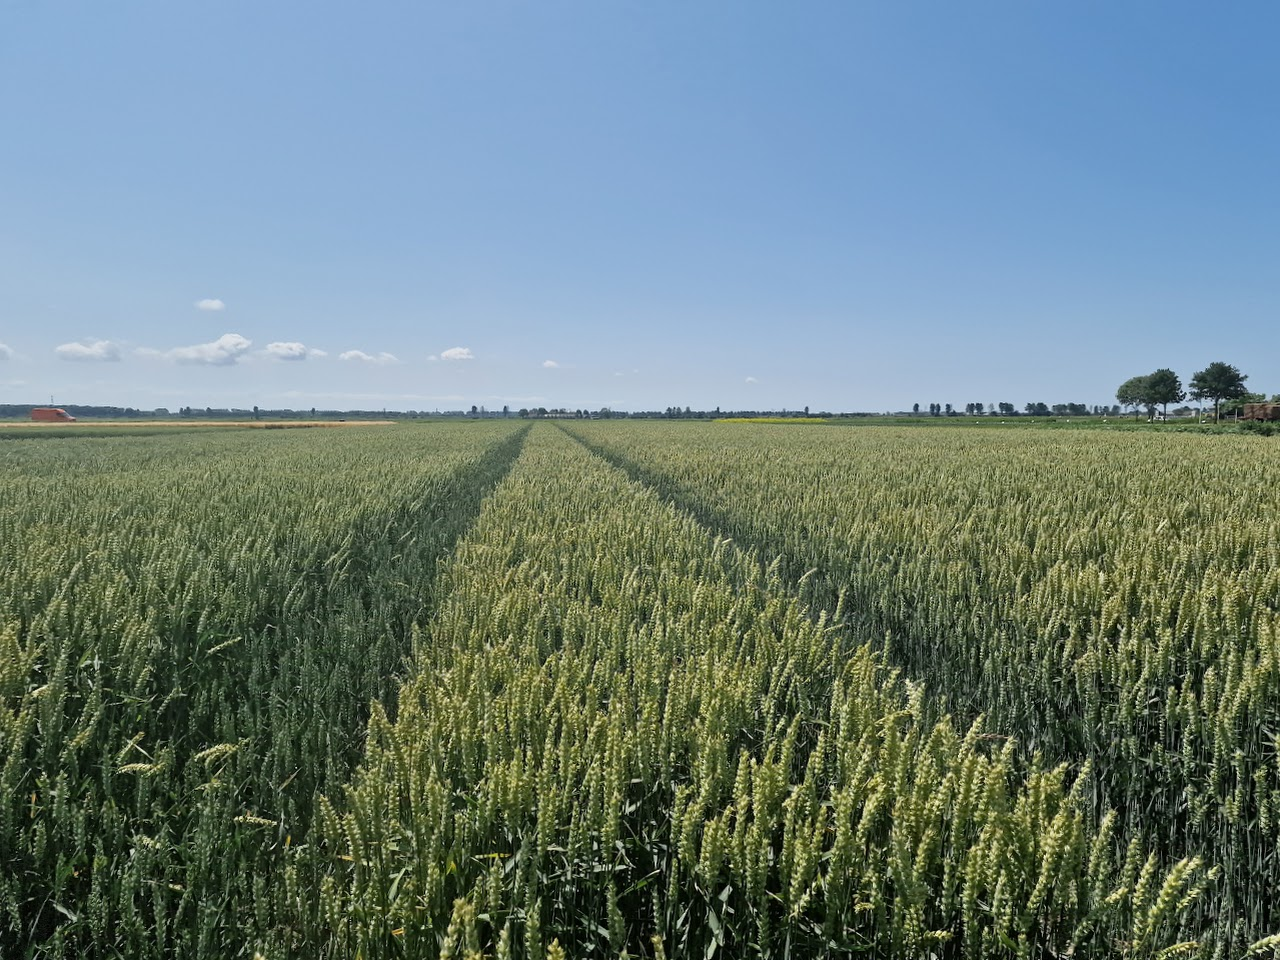
We’ve seen Lolium perenne carpets dominating farmland.
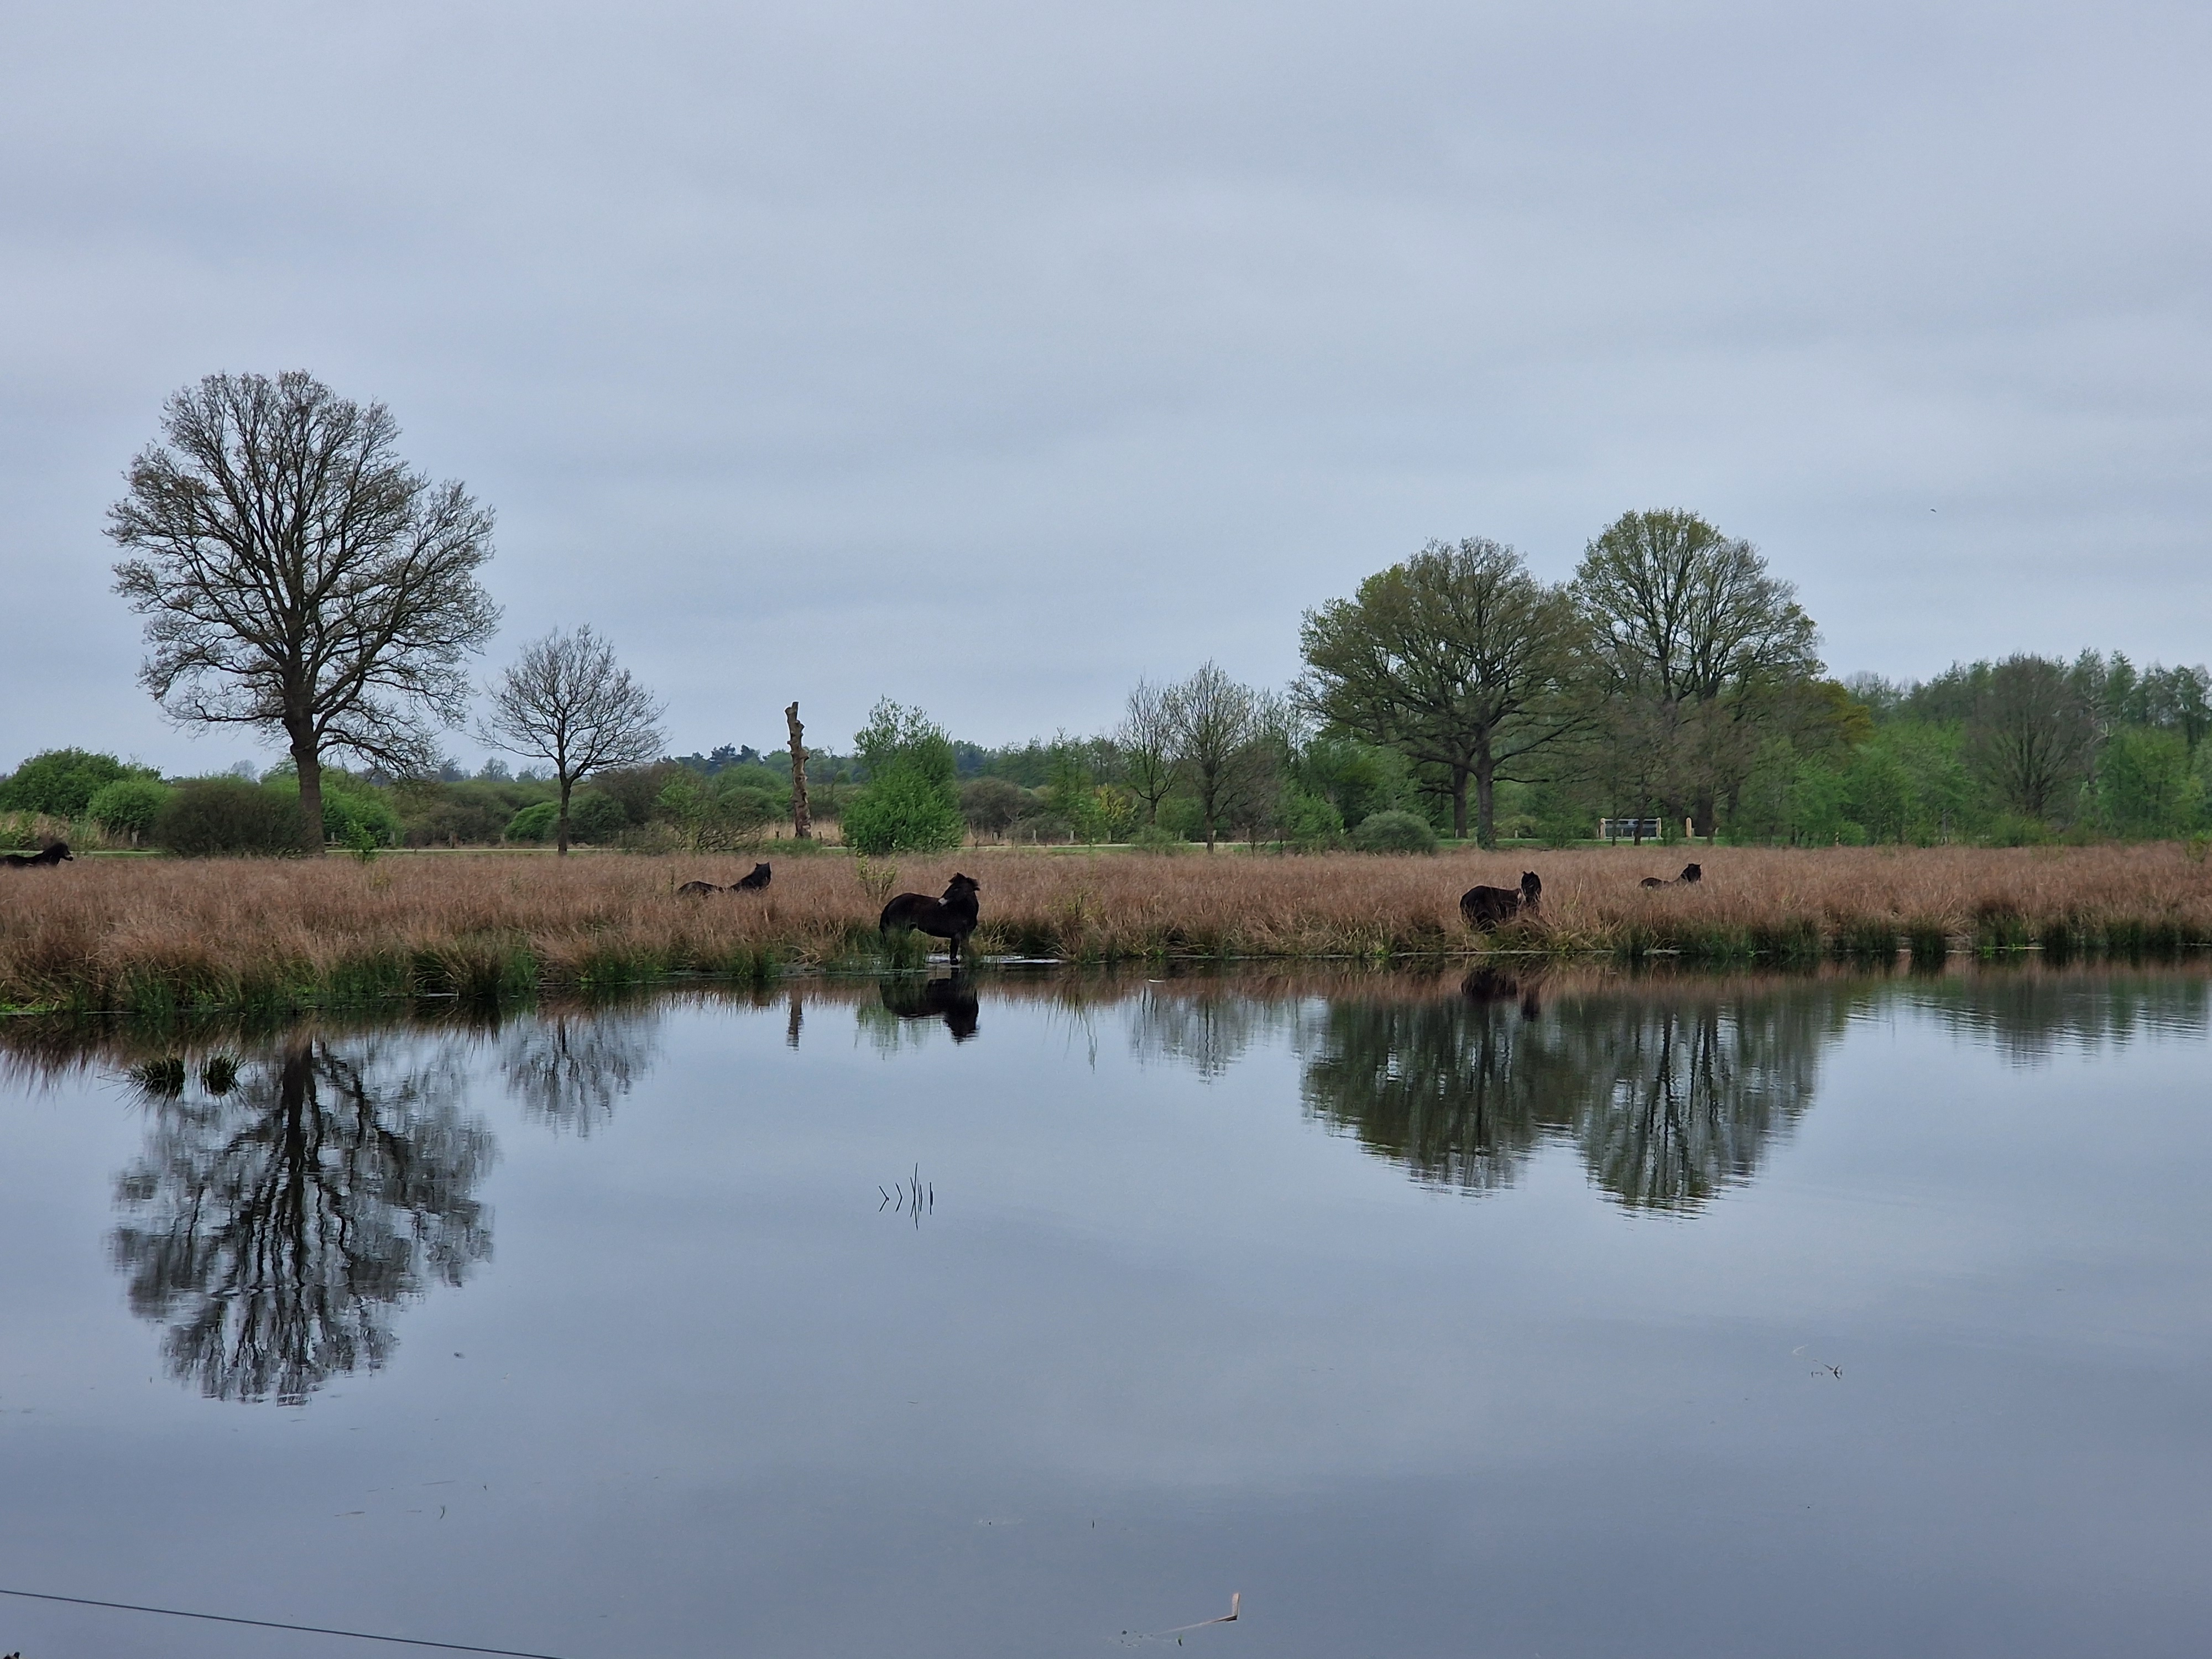
We’ve waded through dense stands of Juncus effusus in heathlands.
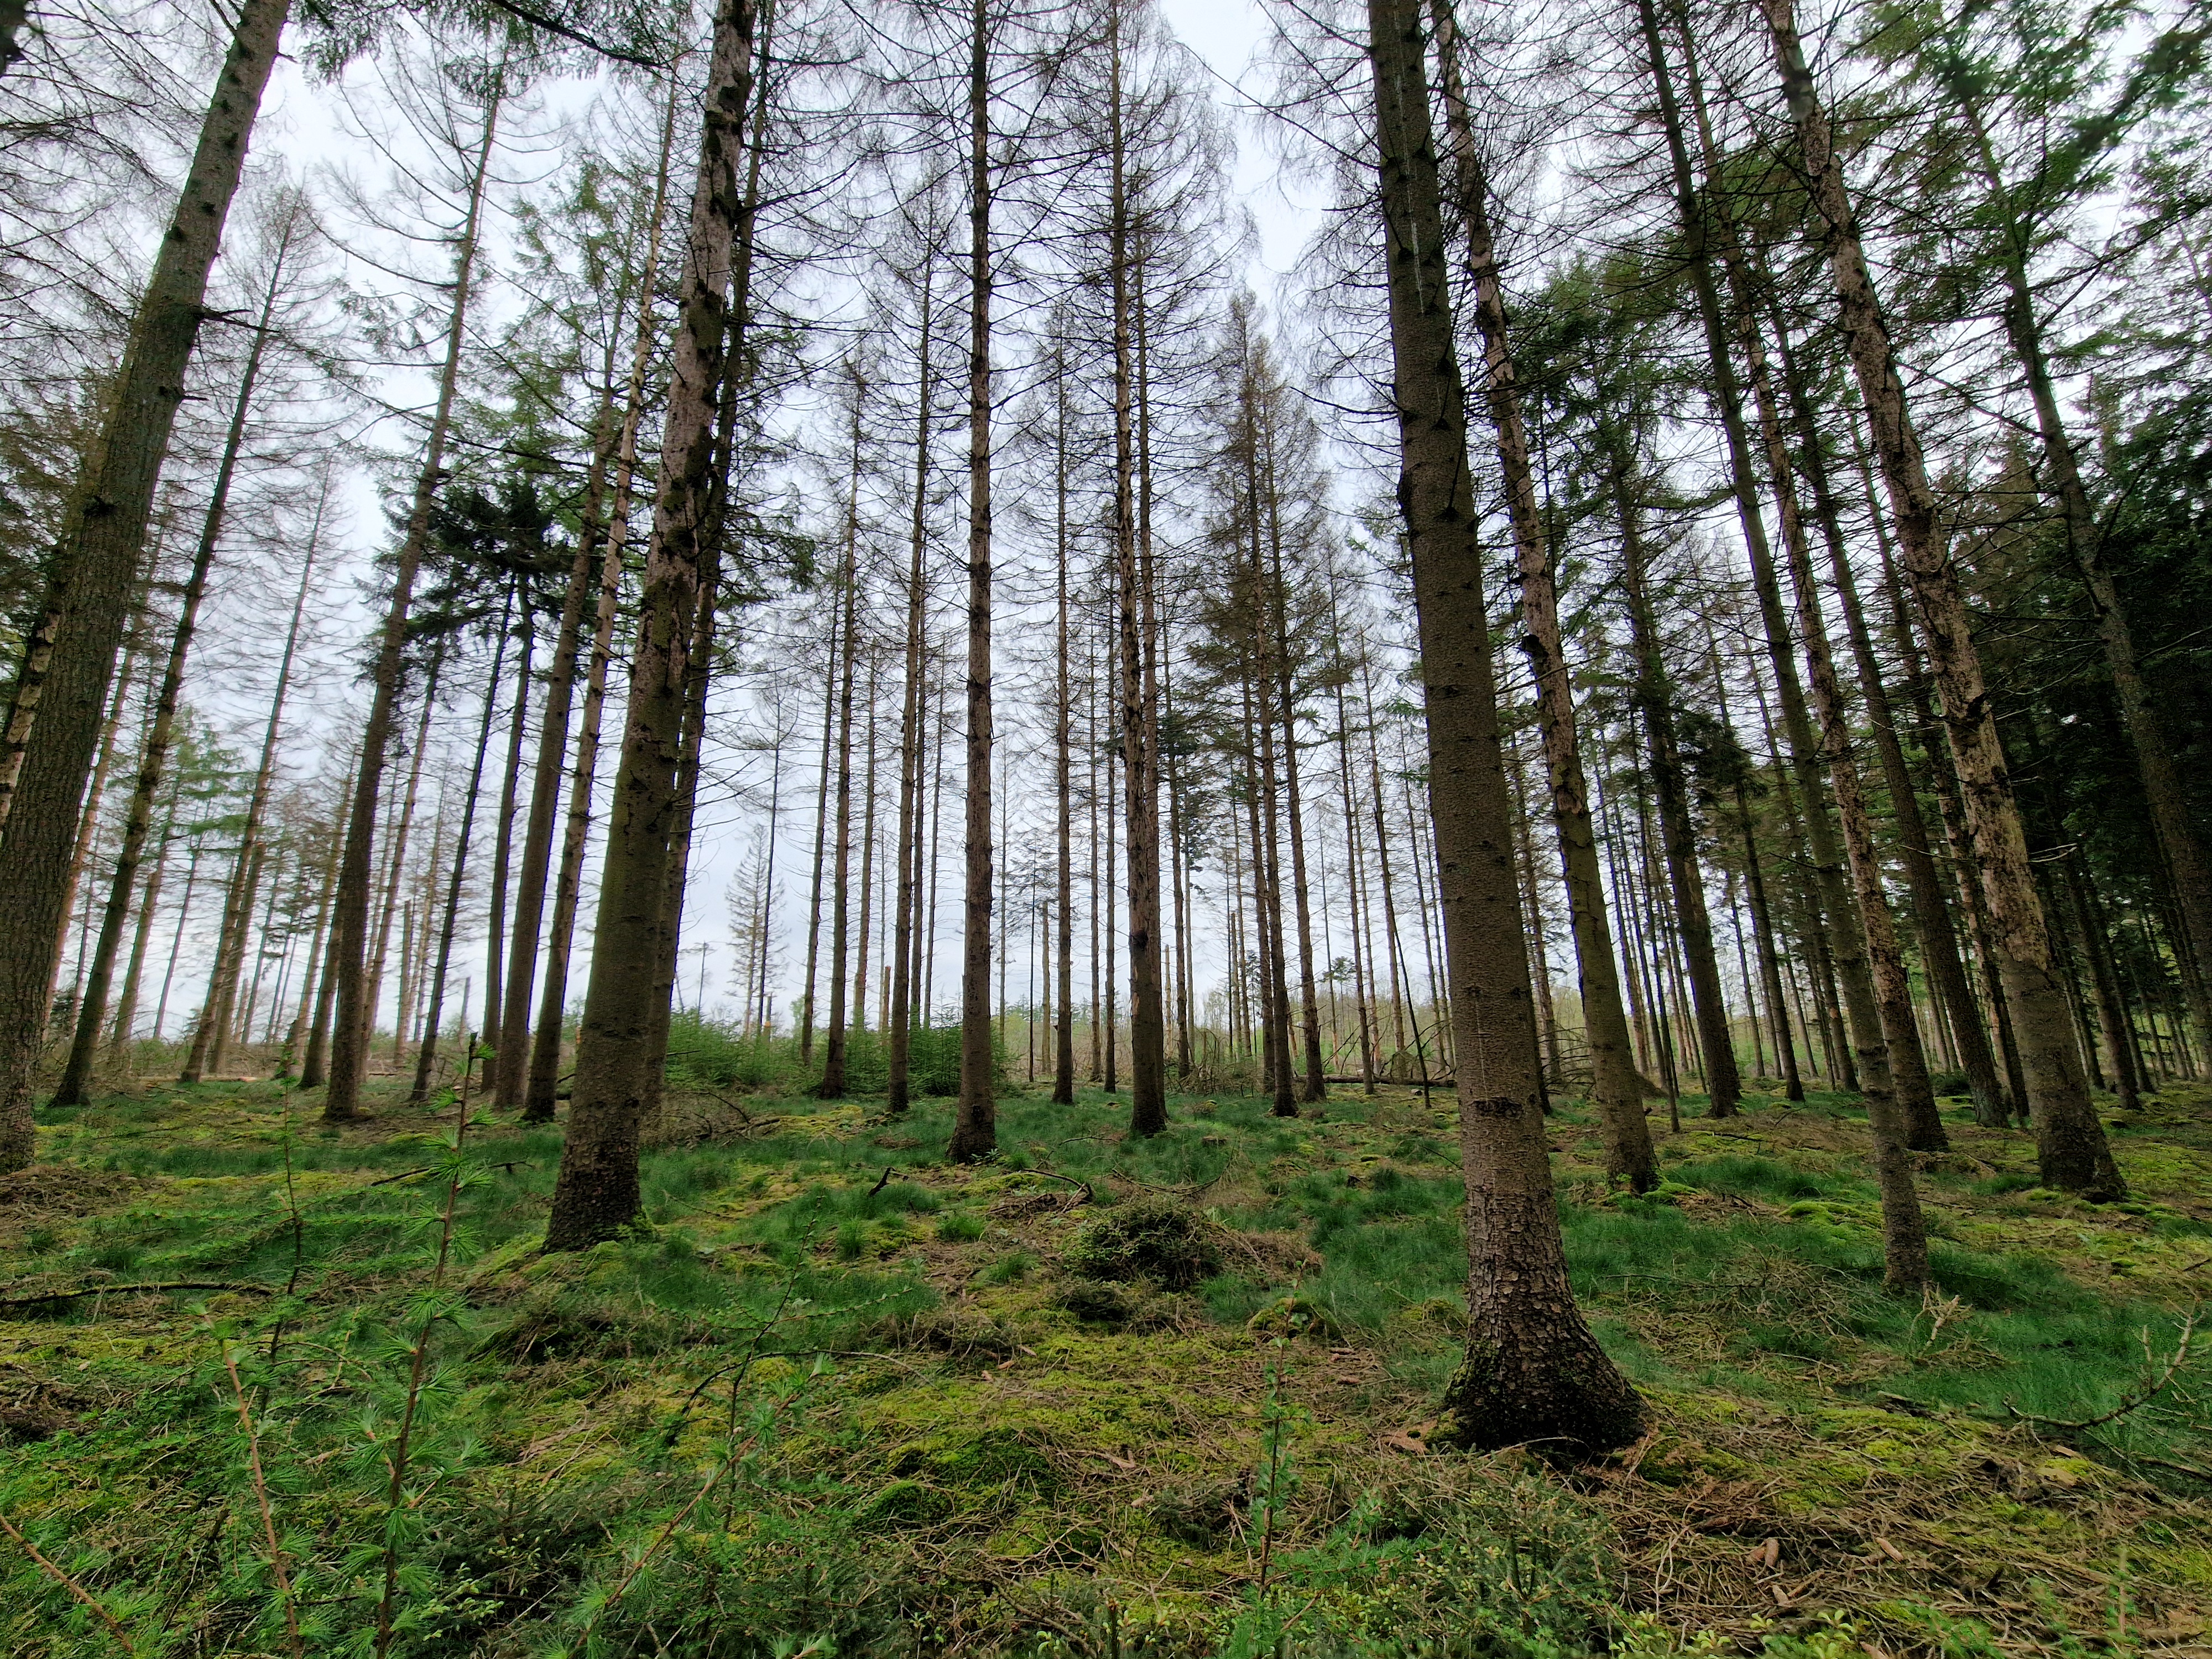
We’ve recorded forest floors so acidic that no understory species survives.
We’ve found stubborn patches of Poa annua pushing through cracks in concrete jungles.

EcoFracNet sample site in a sea of Juncus effusus (soft rush) in the Fochteloerveen.

When low diversity hides a surprise

However, not all monocultures tell the same ecological story.

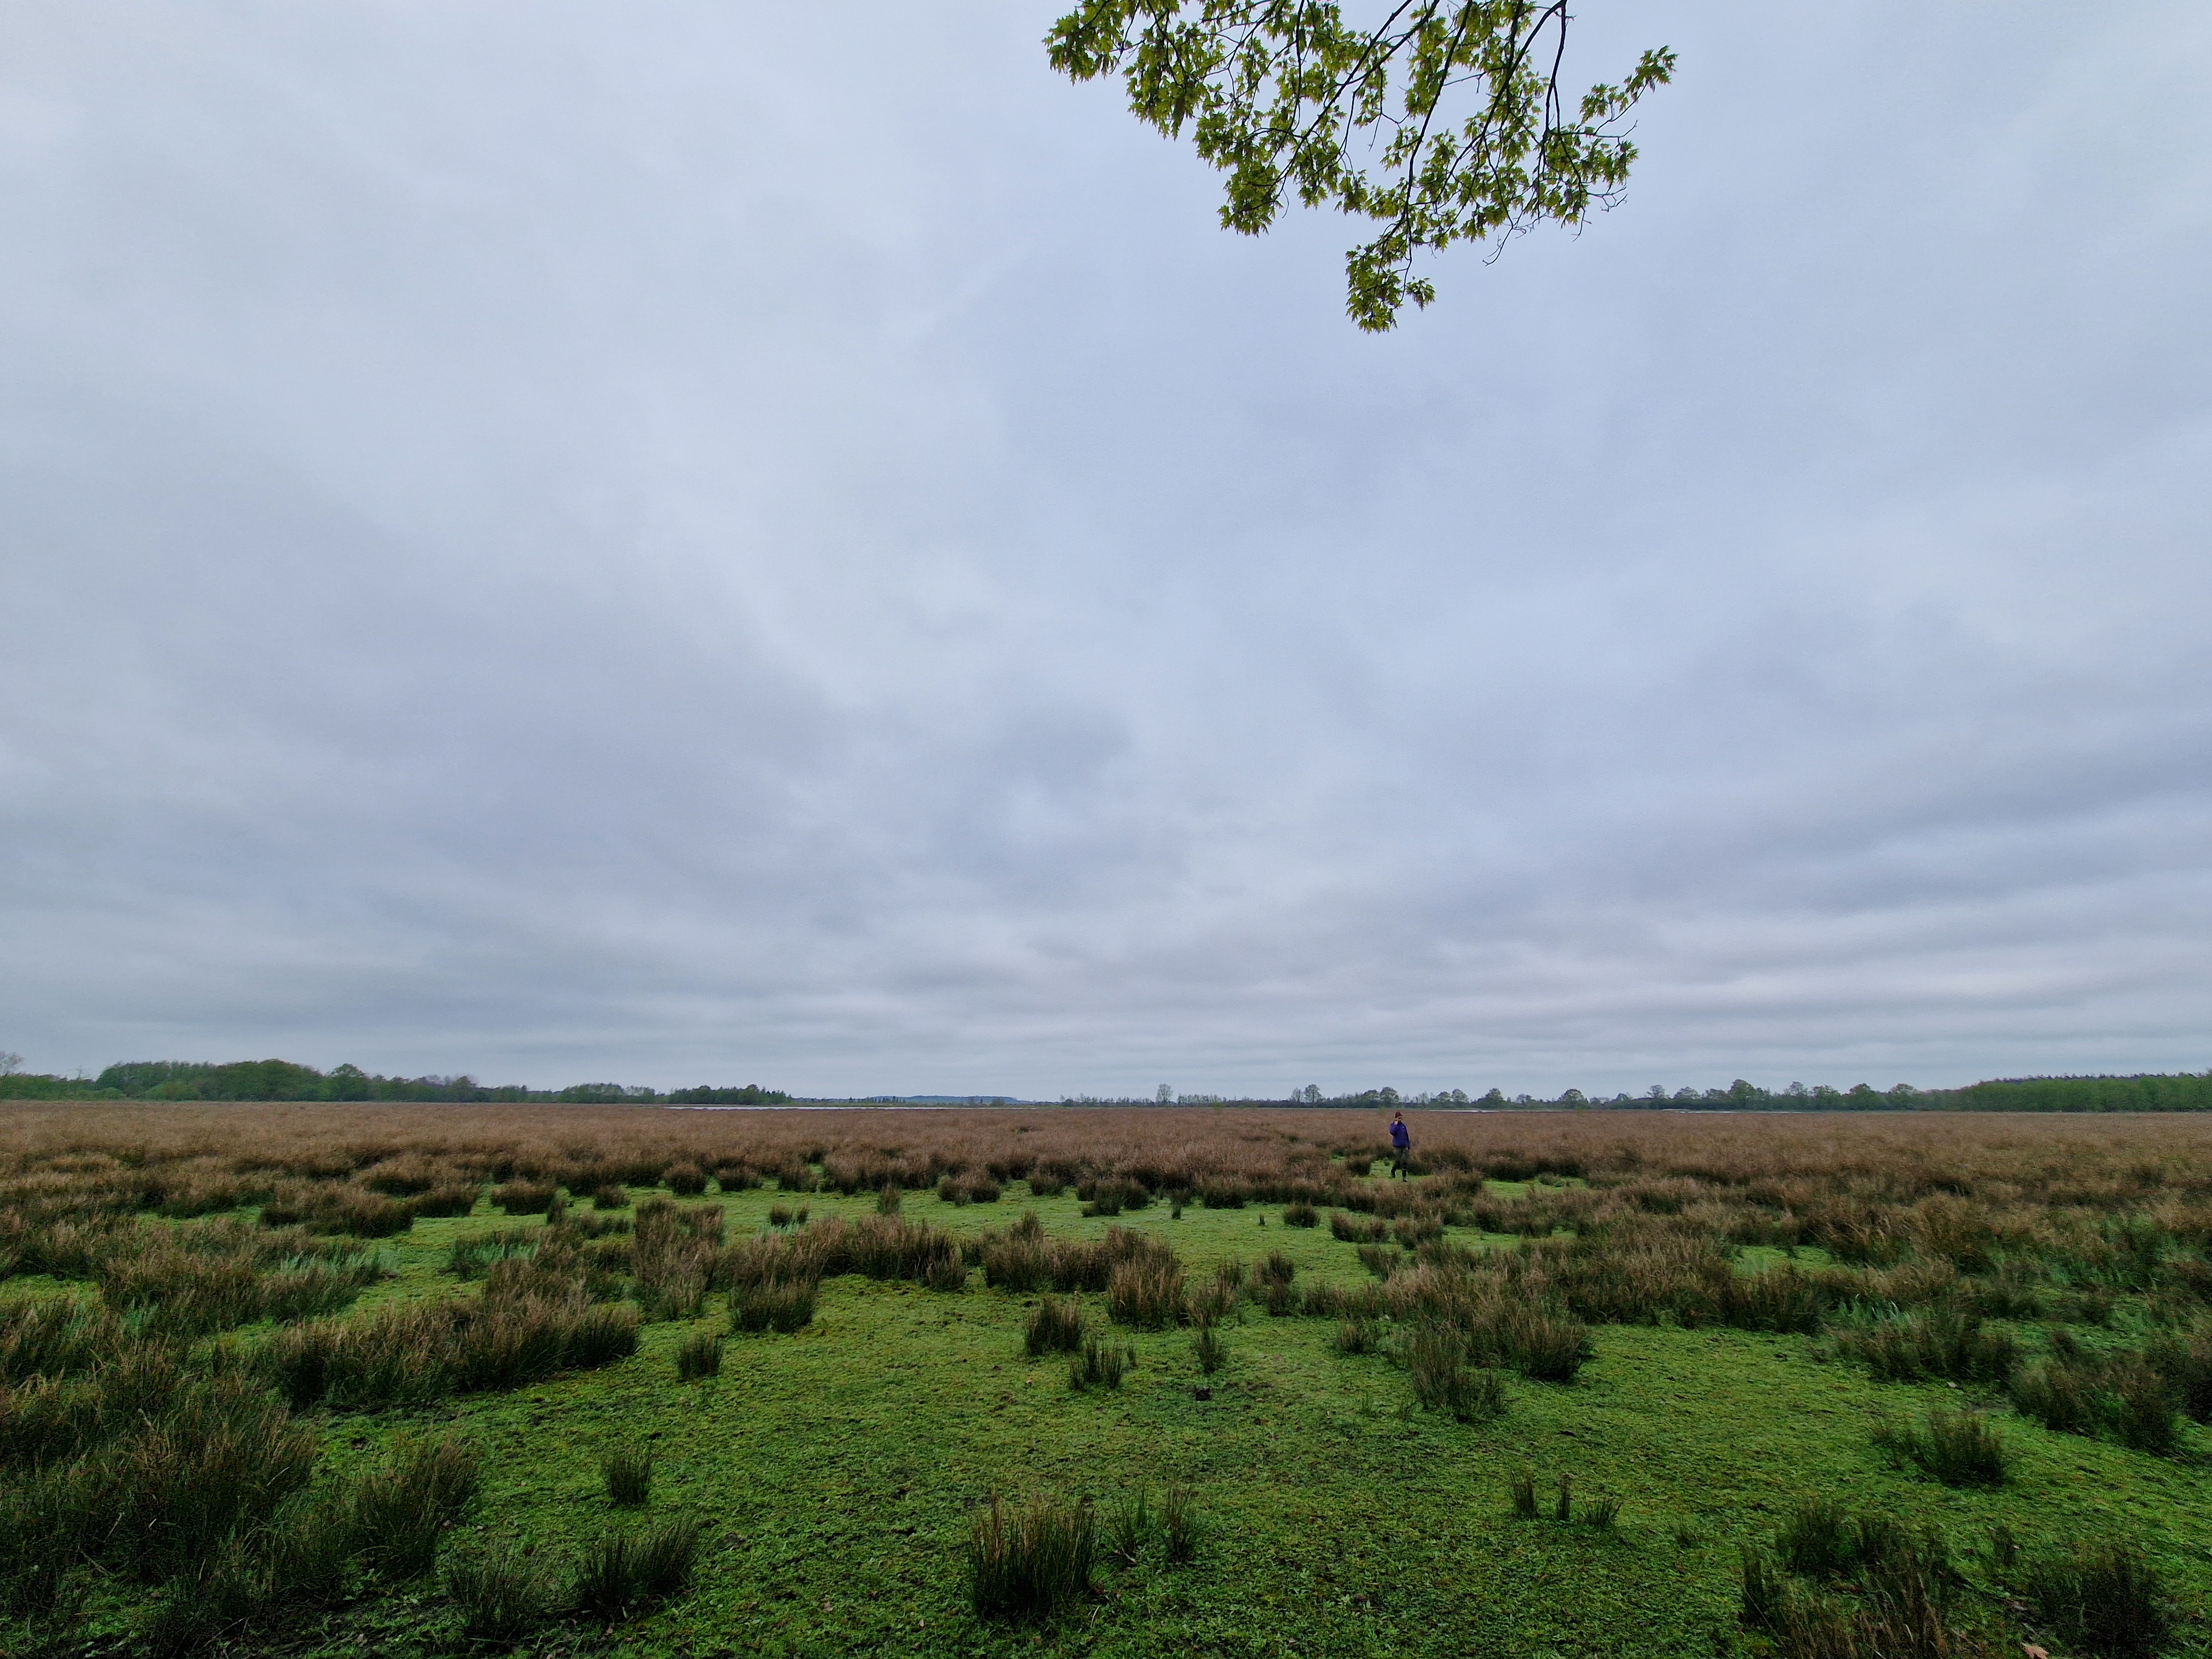
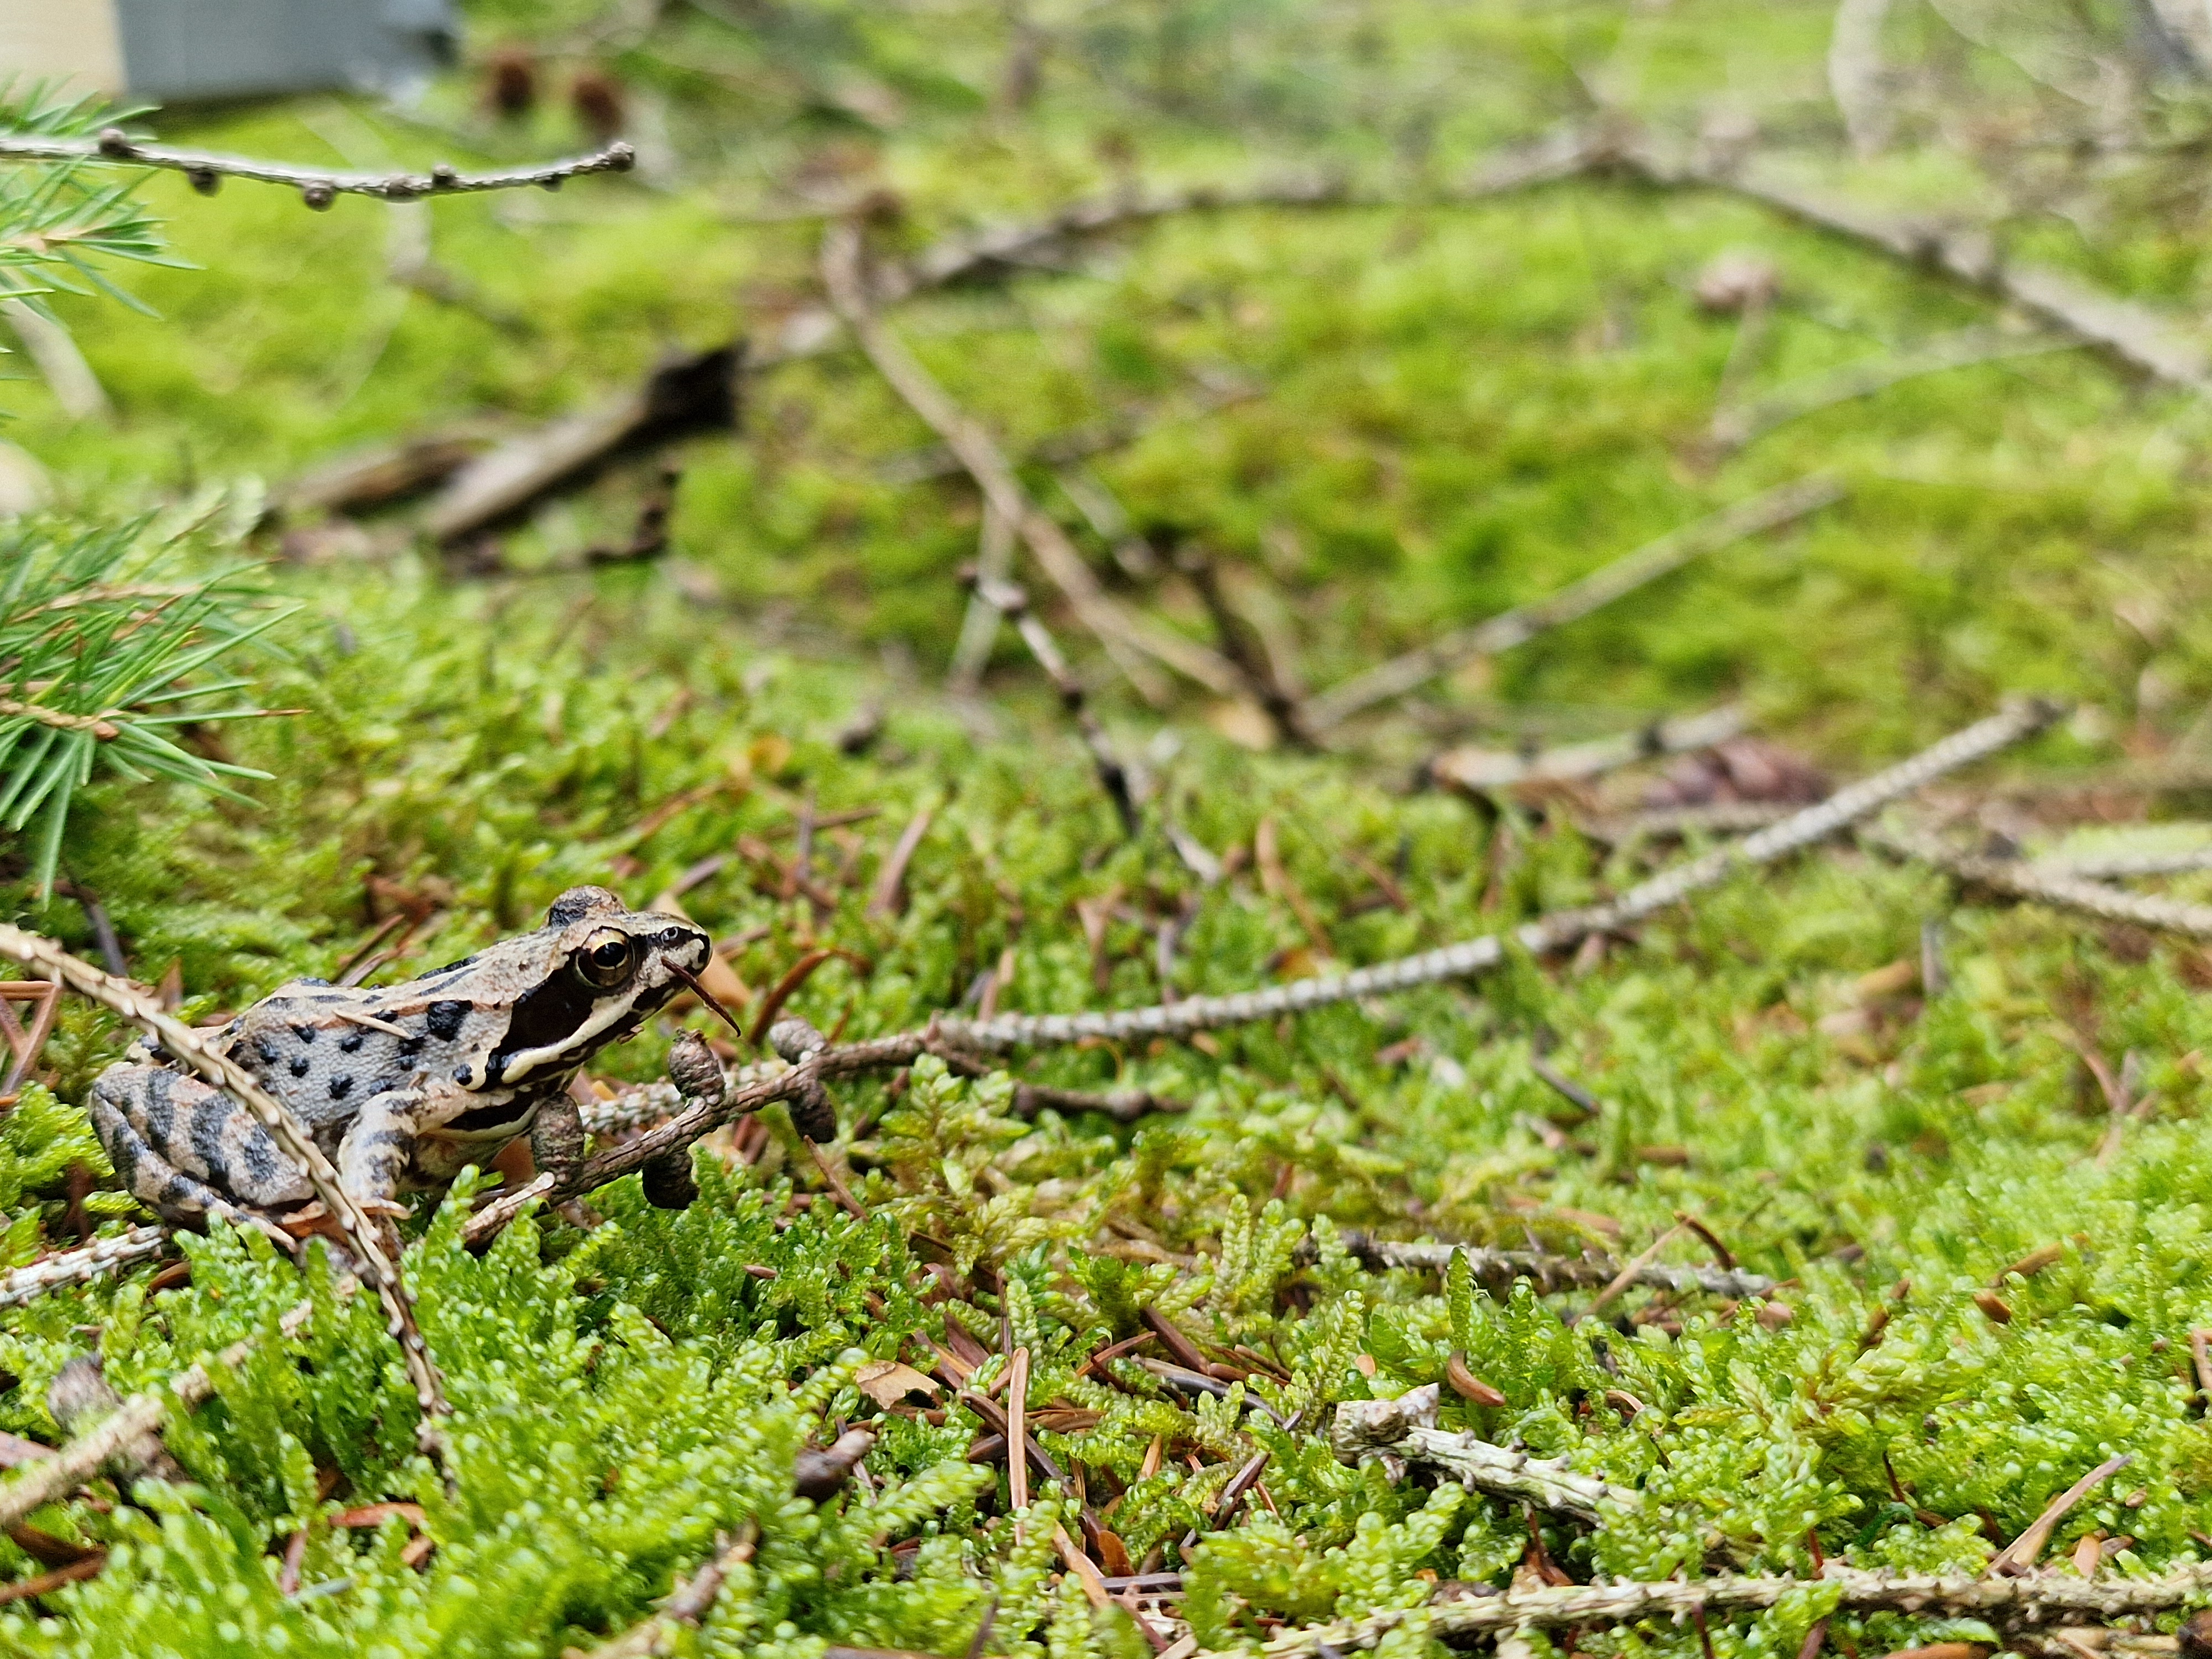
One of my all-time favourite plots was a dense Juncus field in the Fochteloërveen. Just one boring square meter of Juncus in a see of Juncus, surrounded by Juncus… But then, in that montoneous sea, we spotted a small, bright-green jewel among the rushes – a tree frog, a rare amphibian I had simply never seen before, and right there inside our plot.

European tree frog – as surprised as we were to find him in our plot!

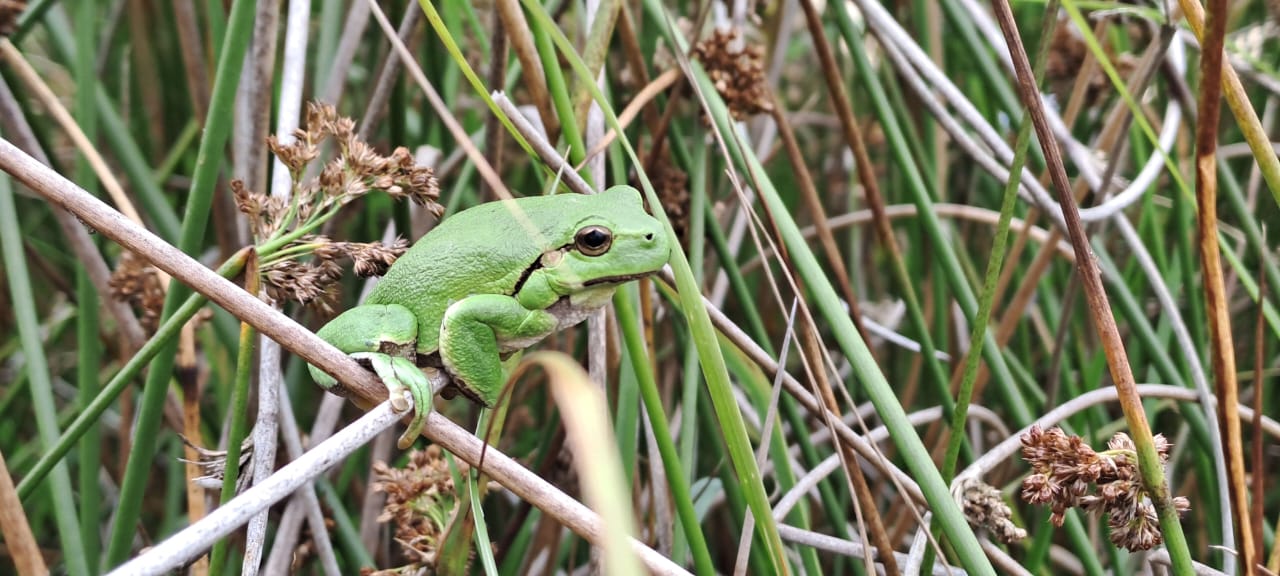
That encounter was a good reminder: low plant diversity doesn’t always mean a lifeless ecosystem. In the Fochteloërveen, the oftentimes poor vegetation still hosts a rich community of animals and soil microbes. But in other places – like in the middle of an intensively managed farmland – a monoculture might be the symptom of an ecosystem stripped of complexity from top to bottom.

Looking beyond the plants

At this stage, we don’t yet know which is which in most of our sites, as any site can surprise you in both directions. That’s why the next steps in EcoFracNet are so important. Future field seasons will expand beyond plants to include animal monitoring, soil biodiversity sampling, and measures of ecosystem functioning. That way, we can piece together how biodiversity at different scales contributes to the way ecosystems work — or don’t.

A virtual monoculture of pines in the ‘Utrechtse Heuvelrug’

A question for you

All these monocultures made us curious: where in the Netherlands would we find the highest plant diversity?

We’d love your suggestions – especially if you know great spots in Zeeland or Utrecht.

And if all this sounds intriguing, you can still join EcoFracNet and help monitor your favourite patch of nature. Whether your site is a botanical treasure trove or a stubborn monoculture, every plot adds a valuable piece to the puzzle!

Not entirely devoid of species – but pretty close to it!
Posted in General, Netherlands | Tagged , , , , | Leave a comment

Soil microbes care little about your climate gradients

We had a hunch: the biogeography of soil microbial communities was going to be messy. Even less than plants or animals, microbes aren’t paying attention to the broad-brush macroclimatic gradients that ecologists often use to explain species distributions. They live and die by local conditions – the pH, the nutrients, the temperature fluctuations, the root exudates – exactly where they are.

That’s the theory, at least. But testing it has been hard. Soils are notoriously tricky – both to sample and to analyze – especially at the scale needed to disentangle regional and local drivers across landscapes.

Now, a new study led by Kunwei Wang and a team from Northeast Normal University in China has taken a solid stab at this challenge. By collecting soil samples from across seven mountain transects spanning much of China’s vast climatic range, we set out to explore the spatial variation in soil microbial communities across a broad biogeographic scale – but with the resolution to zoom in on what’s happening locally.

Sampled mountains across China (left), and the fine-scale elevational sampling scheme on each mountain (right).

One of the clearest findings? A surprisingly relatively consistent hump-shaped pattern in microbial biomass. Across all mountains, microbial biomass peaked at or around the treeline. That’s fascinating – it suggests that the treeline isn’t just a conspicuous boundary for aboveground vegetation, but a key ecological transition belowground as well.

Patterns of soil microbial biomass (SMB), microbial biomass carbon (MBC), and microbial biomass nitrogen (MBN) relative to the treeline. Peaks occur relatively consistently around the treeline, followed by a decline into alpine tundra.

Microbial communities care most about the here and now

But the most revealing result came from the drivers of microbial variation. Above the treeline, local environmental variables (like soil pH, nutrients, and local temperature) explained far more of the variation in microbial biomass, carbon, and nitrogen than regional climate did.

In other words: macroclimate matters less than micro-conditions once you’re in the alpine zone.

Parameter estimates of key environmental drivers for SMB, MBC, and MBN. Bottom row: Explained variance grouped by factor type (climate, soil, etc.), split between areas above and below the treeline.

This finding supports what many microbial ecologists have of course long known – that microbes live in a world of fine-scale variation, and that their distributions are far more tightly coupled to immediate environmental conditions than to broader climatic envelopes.

Why does this matter?

There are a few reasons why this matters – and why we need more of this kind of research.

First, it reinforces that understanding microbial biogeography means getting dirty, quite literally. We need high-resolution, site-level data on soils and microclimates to predict how microbial communities vary across space and respond to change. Macroclimate alone won’t cut it.

Second, and perhaps more implicative, it suggests that the effects of climate warming on soil microbes may be buffered by local environmental filters. If you want to know how a microbial community will respond to a changing climate, you need to know what’s happening in the top few centimeters of soil, not just what the nearest weather station is reporting.

This also implies that other anthropogenic drivers, like pollution, land use change, and physical disturbance, may become even more critical in shaping soil microbial dynamics in alpine ecosystems, as these often mess strongly with these local soil conditions that are so critical for soil microbes,


The take-home message?

Soil microbial biogeography is messy — beautifully, chaotically, locally messy. And that’s not a bad thing. But it does mean we need to shift our perspective if we want to understand or model belowground ecosystems. The fine print of the soil matters.

And the treeline? It’s not just a line in the landscape. It’s a biogeographical boundary that shapes life above and below the surface.

Find the paper here: Kunwei Wang et al. (2025) Biogeographic Patterns of Soil Microbial Biomass in Alpine
Ecosystems Depend on Local Rather Than Regional Drivers. Global ecology and biogeography.

Posted in China | Tagged , , , | Leave a comment

Extremes

I’ve just returned from a field visit to northern Sweden – above the Arctic Circle. It was close to thirty degrees Celsius this week. We nearly got burned off the mountain.

This kind of heat is no longer unusual. It followed a strange winter, where most of the snow had melted away by February – only to be replaced by a late-season snow event that buried the mountain under snow well into spring. These abrupt shifts are exactly what we’re tracking in our Fingerprints of Change project on mount Nuolja, close to Abisko: how increasingly erratic weather affects plants, bumblebees, and the ecosystems they hold together.

Lots of snow on our Fingerprints of change project still late in spring, substantially delaying phenology even when temperatures are high.

It’s too early to say what the full impact of this year’s extremes will be, but we already see it’s substantial. And more importantly: this isn’t a fluke. These kinds of events are happening more frequently – in this system, and in every system.

Because climate change doesn’t play out like a slow, steady dial toward 1.5°C. It comes in jolts. It hits us with heatwaves, droughts, late snows, floods, storms. Shocks that used to be “once-in-a-lifetime,” but now seem to happen all the time. These Extreme Weather and Climate Events (EWCEs) are no longer exceptions. They’re part of the story, and in many cases, the main driver of change.

Yet in ecology, we’ve barely started paying them serious attention.

In our new paper, just published in Trends in Ecology and Evolution (TREE), we argue that this lack of focus isn’t because extreme events don’t matter. It’s because the data hasn’t let us see them properly.

How gradual climate change and extreme events shape species’ range shifts
(A) In the classic view, climate warming drives a slow reshuffling of species. Populations gradually expand into newly suitable areas at the leading edge – typically toward higher latitudes, elevations, or ocean depths – while slowly disappearing from the trailing edge where conditions become too harsh. The result: a steady drift of ranges over time.
(B) But extreme weather can disrupt this smooth story. Sudden droughts, heatwaves, or cold snaps at the trailing edge can wipe out populations entirely, triggering abrupt contractions. These losses might be temporary (recovery is possible if conditions improve) but they can also leave lasting gaps. At the leading edge, storms or other extremes can fling seeds, spores, or individuals far ahead of the current range, sparking rapid expansions. Yet here too, the next extreme could push them right back.

What’s missing?

First: climate data. Most biodiversity studies still rely on coarse, long-term averages or climate station data far away from where organisms actually live. But extreme events are short-lived and highly local – meaning we need fine-scale data in both space and time to catch them. But what is more: as we don’t know where and when the most extreme events will happen, that fine-scaled data needs large spatial and temporal extents, and is that that is hardest to find.

Second: biodiversity data. Most monitoring efforts rely on just a few time points, maybe two or three surveys across several decades. That’s not enough to pick up the biological fingerprints of rapid, transient shocks.

This paper emerged from discussions at the Species on the Move conference in Florida. We highlight how extreme events can accelerate or limit species’ range shifts. For example:

  • Storms can blow seeds or insects far beyond current range limits.
  • Droughts and floods can wipe out entire local populations.
  • Cold snaps can halt the northward spread of warm-adapted species.

So, while background warming may drive slow and steady shifts, extreme events can spark sudden advances or abrupt setbacks.

Extreme events can result in extremely far propagule dispersal, as visualized here by the dispersal kernel.

Where do we go from here?

To understand these dynamics, we need better tools. Microclimate models at the necessary resolution are demanding, but increasingly feasible. Long-term, standardized monitoring – like what we’re doing with the Fingerprints of Change-project in Abisko and through global collaborations like in the MIREN network – is helping us fill the gaps.

And it’s not just about research. Conservation planning must also start factoring in extreme events. That means short-term interventions, like shading turtle nests during heatwaves. But more importantly: long-term strategies, like ensuring connectivity so disturbed populations can recover through recolonization.

The Dickcissel is used as an example in the paper: extreme events at the core of its range are reducing its abundance there, while warmer temperatures at the edges might promote range changes.

A call to think differently

As ecologists, we’re trained to look for trends. We love linearity, averages, gradual change in our data. But extremes defy those expectations. They’re noisy. They’re messy. It’s time we shift our perspective.

In this paper, we call for a different lens: from “microclimate” to “microweather.” From gradual trends to abrupt shocks. From averages to outliers.

Because it’s in the extremes where much of the future will unfold.

Posted in General | Tagged , , , , | Leave a comment

Join EcoFracNet – we’ve got sensors!

Whether you’re already knee-deep in site planning for EcoFracNet or MicroFracnet, or just hearing about it for the first time, we’ve got some exciting news to share—and maybe even a little incentive to get involved.

Wait, what is EcoFracNet again?

Great question. EcoFracNet is a growing international network of field ecologists working together to explore how biodiversity varies across spatial scales using a fractal monitoring design. Alongside it runs MicroFracNet, its microscale-focused sibling, adding more hierarchical levels into the mix. You can read more and see the recent call for participation here: MicroFracNet | The 3D lab.

We’re doing this all bottom-up: no big funding yet, just shared enthusiasm and a commitment to doing robust, comparable science across diverse ecosystems.

A bonus for current and future collaborators

Although we’re still running both networks without external funding, you may be lucky. We’ve secured a batch of second-hand TOMST TMS4 sensors – those awesome little mushrooms that log soil temperature, moisture, and air temp just above the ground. And we’d love to share them with you.

We can lend up to 7 sensors per participating region, free of charge (until we run out, of course). Whether you’ve already joined the network or are still deciding, this could be a perfect way to get started.

A few important notes:

  • No TMD adapters included – We don’t have spares, so you’ll either need to buy one from TOMST for data download or send the sensors back to us after a year so we can extract the data for you.
  • Shipping – We can ship the sensors to you, but depending on where you are, it might be easier to coordinate through someone traveling to and from Belgium or the Netherlands. We’ll do our best to make it work!
  • Sensor quality – These are second-hand but should still have a couple of good years left. We can’t promise anything beyond that – but hey, free sensors.
  • Site setup map required – Before we send anything, we’ll need a clear map of your EcoFracNet setup (e.g., using Google My Maps). Use this example format:
    Blue = vegetation monitoring only
    Green = vegetation + sensor installation
    Red = no monitoring
    (Example Map from an agricultural field site in the Netherlands)
  • Timeline – With summer holidays and slow logistics, shipping will take a little time.
TOMST sensor in our EcoFracNet-site at Fochteloerveen in the Netherlands

Long-term vision

Remember, this isn’t just a one-off field season. EcoFracNet and MicroFracNet are being designed as long-term monitoring projects, with hopes of regular resurveys and extra measurements added in over time. The more consistent we are across sites, the more powerful the dataset becomes.

Ready to join in?

If you’re interested in borrowing sensors (or joining the network in general), please send us:

  • Your overview map (see above)
  • Your full shipping address
  • Your email + phone number

And yes, feel free to forward this to colleagues who might be curious or looking for an excuse to set up some long-term plots.

Haven’t signed up to the network yet? Do so here!

Me happy distributing sensors

Looking forward to hearing from you!

Jonas and Will – for the EcoFracNet team

Posted in General | Leave a comment

Boots in the bog

Far in the north of the Netherlands, on the border of Friesland and Drenthe, lies an endless sea of moor-grass, heather, and rushes – spread out across one of the last active raised bogs in the country: the Fochteloerveen.

Throwback pictures of our first fieldwork trip to Fochteloerveen two months ago, when summer was still far away

A raised bog is something truly special. Formed over thousands of years, it’s a living landscape built entirely from rainwater and sphagnum moss. Layer by layer, the mosses grow, die, and decay, creating a domed blanket of peat that rises above the surrounding land. These bogs are wet, acidic, and nutrient-poor, yet support a unique and fragile web of life. Carnivorous sundews, rare dragonflies, and strange fungi find their niche here. And underneath it all, the peat holds centuries of carbon, making these bogs some of the most effective natural carbon stores on Earth.

EcoFracNet vegetation monitoring in an sea of rushes, with not much else in sight

We visited this remarkable place in spring to set up a new EcoFracNet study site, focusing on biodiversity and ecosystem variation across a fine-scale moisture gradient, from boot-deep mud to dry sandy ridges dotted with pines. This is one more piece in our ongoing effort to cover all major Dutch habitat types with EcoFracNet. But there’s another reason this site deserves a closer look.

The area hosts forest understory that feels like it has remained undisturbed and untouched for a truly long time, slowly growing into beautiful perfection

To protect its rare biodiversity, park managers Natuurmonumenten and Staatsbosbeheer are continuously refining their management. Most recently, they’ve expanded the role of large grazers in the landscape, with a striking herd of Exmoor Ponies now roaming the area. These shifting grazing dynamics are likely to reshape local patterns of heterogeneity – and with them, the scales at which biodiversity varies. That’s exactly what EcoFracNet is built to study: teasing apart the spatial fingerprints of ecological variation, from the patch to the landscape level.

The brave and kind Exmoor ponies keep vegetation short where needed

We’re also looking below the surface. Together with colleagues from the group, we’re analyzing belowground biodiversity and ecosystem functioning, to explore whether patterns beneath our feet mirror those we see aboveground, or tell a different story entirely.

That’s all we’ve got for now. Our students are digging into the data (as they did into the mud), and we’re looking forward to seeing what they uncover. In the meantime, this post is really just a nod to this uniquely strange and beautiful landscape that so captivates you when roaming through it.

Posted in Netherlands | Tagged , , , , | Leave a comment

EcoFracNet at the farm

Our EcoFracNet project aims to uncover patterns of biodiversity across all kinds of landscapes — including those where biodiversity isn’t necessary a priority, like agricultural areas.

Even these landscapes can host a surprising variety of life: along field edges, in fallow patches, or even hidden within the rows of monocultures. By monitoring that plant biodiversity in exactly the same way as we do in forests, grasslands, or peatlands, we can put it into context. How much does it contribute? At what scales does it vary? And ultimately – what role does it play, and could it play, in the biodiversity of the future?

Given the central role agriculture plays in our landscapes, that perspective is essential – guiding us from understanding what’s there now to exploring how we can best make use of this space for biodiversity.

A sea of winter wheat – a monoculture for sure. But how does its diversity compare with those in the understory of our Dutch forests? And what’s still hiding out in the field edges or quickly colonizing the space after the harvest? We’ll find out!

We’ll explore these questions at De Rusthoeve, an experimental farm in Zeeland, the Netherlands. With its long history of working with scientists and sensors, it’s an ideal place to study biodiversity and environmental heterogeneity in an agricultural setting, without feeling too much like a bother to the general functioning of the farm!

Giant hogweed dominating the view in a field of poppies elsewhere in Zeeland

Last week, under a perfectly blue Zeeland sky, I visited the farm for the first time. Looking forward to returning soon and getting everything set up!

Posted in Netherlands | Tagged , | Leave a comment