I got myself a little present to celebrate two important milestones. First of all, today I am honoured to present my research in Utrecht, the Netherlands, as finalist of the New Scientist Science Talent Award. A fantastic opportunity to communicate the importance of global change to the wider public.
Next week then brings the first SoilTemp-meeting, where we gather over 35 specialists to discuss our growing database of soil temperatures, and how to move forward with this precious dataset. For me, this is a major step towards the future, in which we hope this global and accurate climate dataset will help us better predict the current and future state of biodiversity.
The present I got myself: climate stripe socks! This is a graph of the mean annual temperature of our planet from 1870 (my toes) to 2017 (the top of the socks). Nothing visualises the ongoing climate change better than this scarily beautiful colour pattern, if you ask me, and the perfect attire for our presentations on climate and land use change.
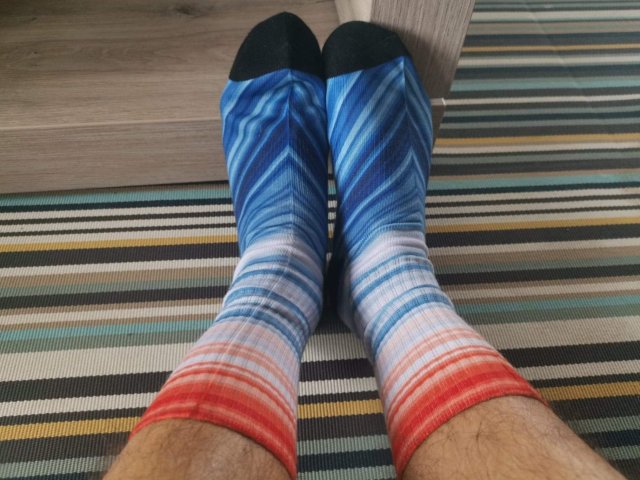
There is many more cool things where these come from, thanks to Ed Hawkins! Want to wear climate change yourself? Try out the ties, leggings or flip-flops. Cause as I always say: if there is flip-flops made out of it, the problem is undeniably serious.


")


")
")


")


")


")


")


")


