
I’ve spent over a decade now sticking small microclimate loggers into the ground, mostly to talk about temperature. Soil moisture has always been the awkward third wheel in that story: TOMST loggers measure it too, our CurieuzeNeuzen in de Tuin citizen-science project collected it by the thousands, and yet I’ll be honest – until recently we had done remarkably little with it. Soil temperature is intuitive, comparable across studies, and (relatively) forgiving. Soil moisture is none of those things. It depends on soil type, on calibration, on what exactly you mean by “moisture” in the first place, is extremely variable and rarely statistically ‘normal’. So it sat there in our growing database, a bit unloved and ignored.
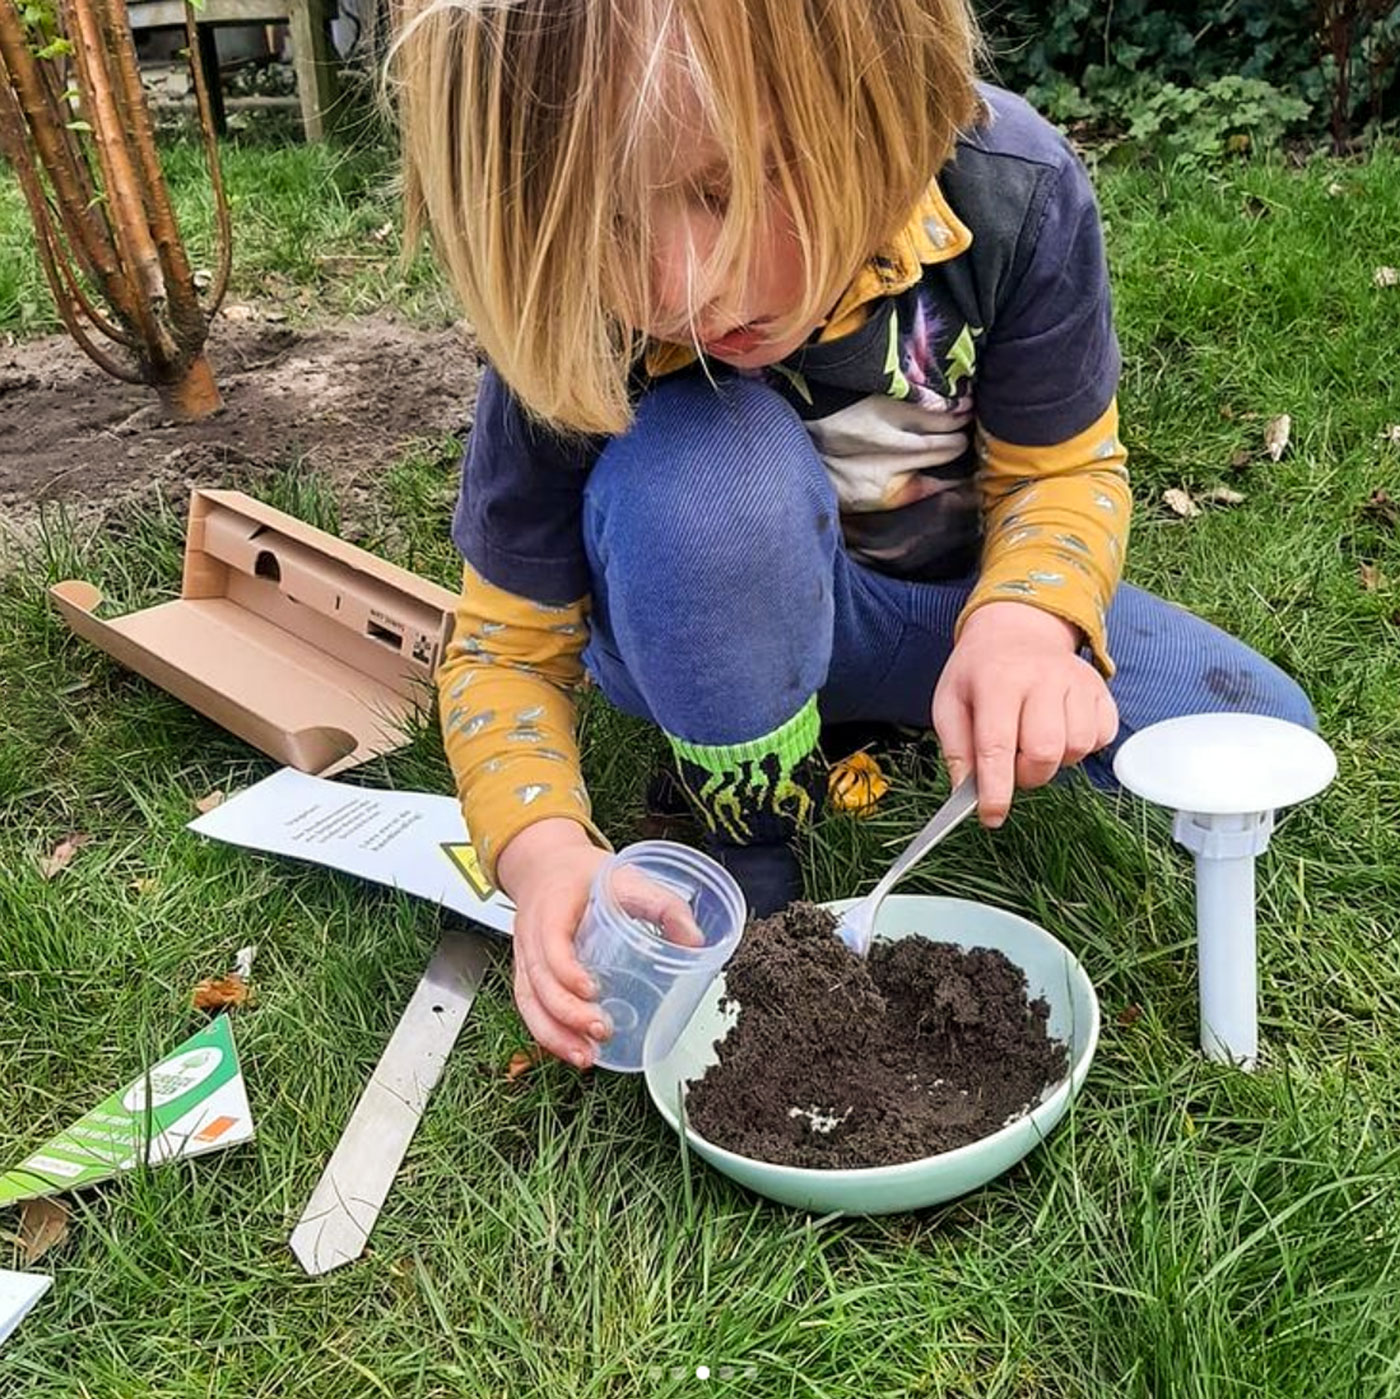
That changed, fortunately, when the hydrologists at the Vrije Universiteit Brussel came knocking with a very interesting question: can our garden sensors tell us anything about groundwater?
Borrowing eyes from a different field
The premise of the collaboration (now published here!) was nicely elegant. They had already built and run mHM, a proper physically-based hydrological model, for the whole of Flanders. The kind of model that needs detailed climate forcing, soil maps, land use, and a fair chunk of computing time, and that spits out things one actually cares about for water management: groundwater recharge, evapotranspiration, degree of saturation. Variables for which you cannot simply stick a sensor into the ground and read off directly at the same low cost we do for temperature and soil moisture.
Meanwhile, we had thousands of CurieuzeNeuzen in de Tuin loggers with two summers of near-continuous, low-cost, noisy, wonderfully abundant soil moisture and temperature readings, measured in places a hydrological model would never normally get near: backyards, parks, the occasional forgotten corner behind company head quarters.
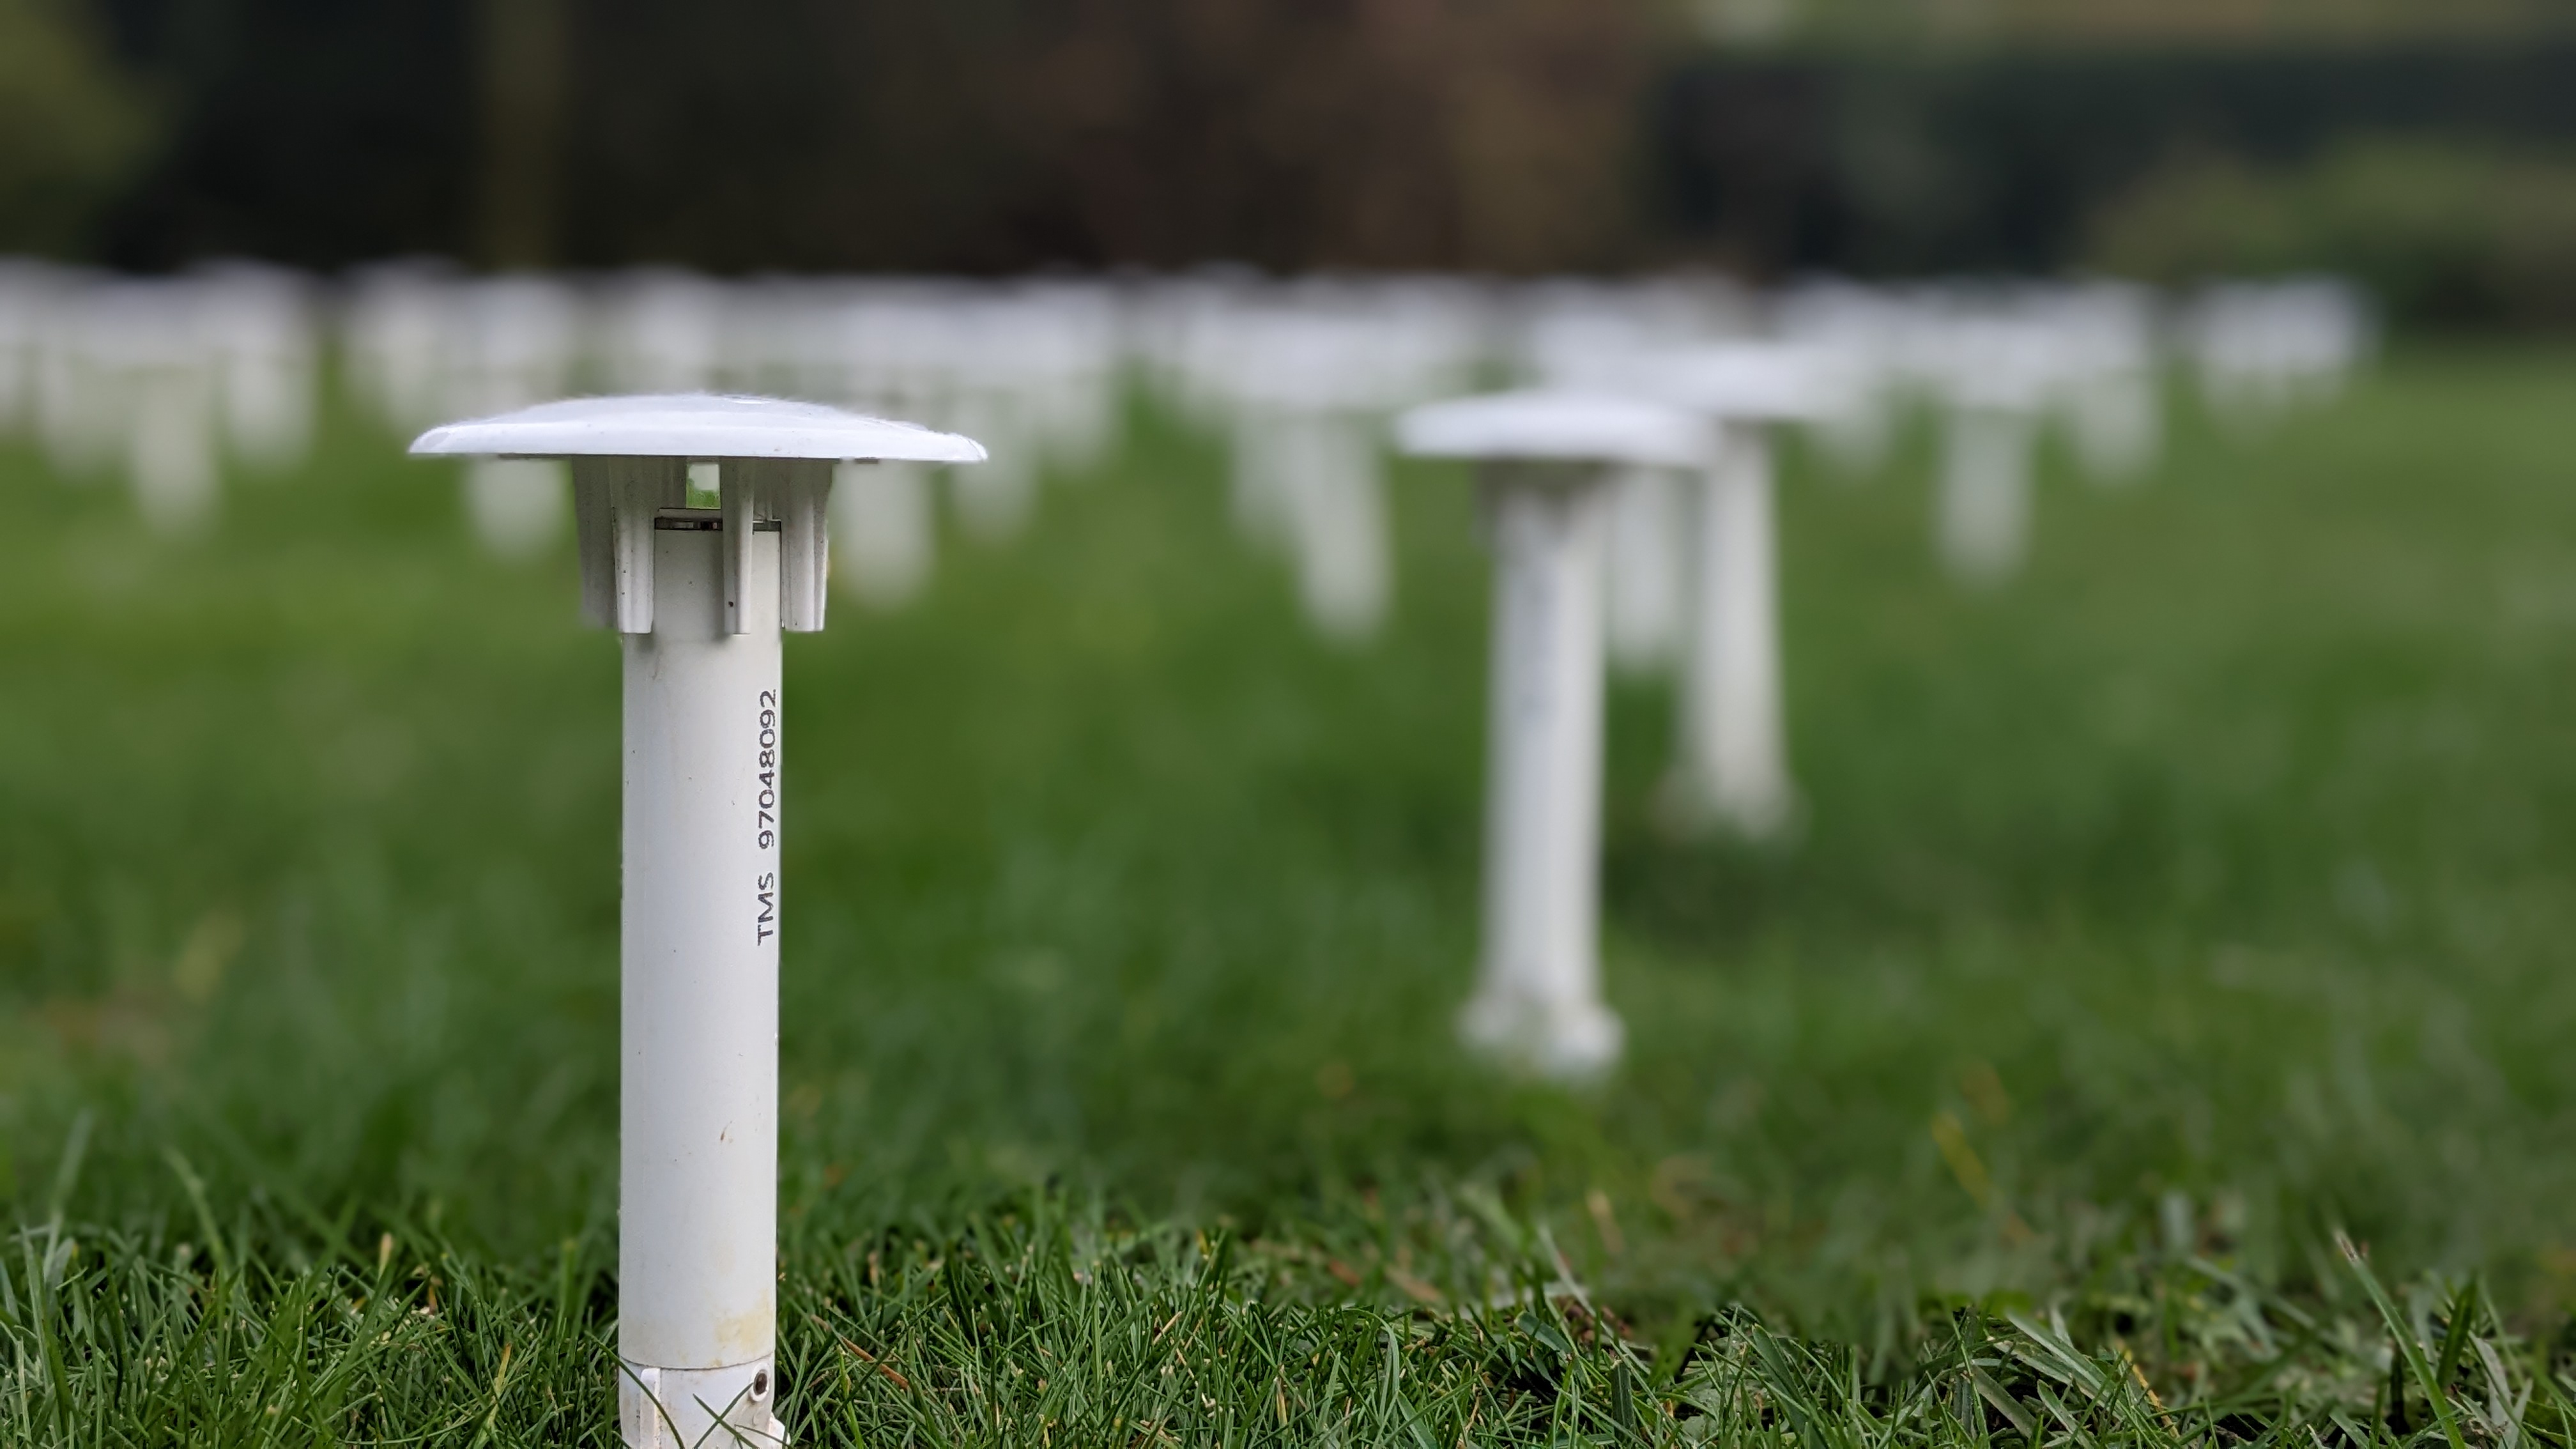
The question the VUB team asked was basically: if we feed a machine learning model nothing but our sensor time series – no rainfall, no radiation, no coordinates, just the lags, rolling means and differences of what the sensor itself reports – can it learn to reproduce what the full hydrological model would have said for that spot? In other words, how much hydrology is already implicitly encoded in a humble soil moisture logger, once you look at it the right way?
The answer: quite a lot, especially in bulk
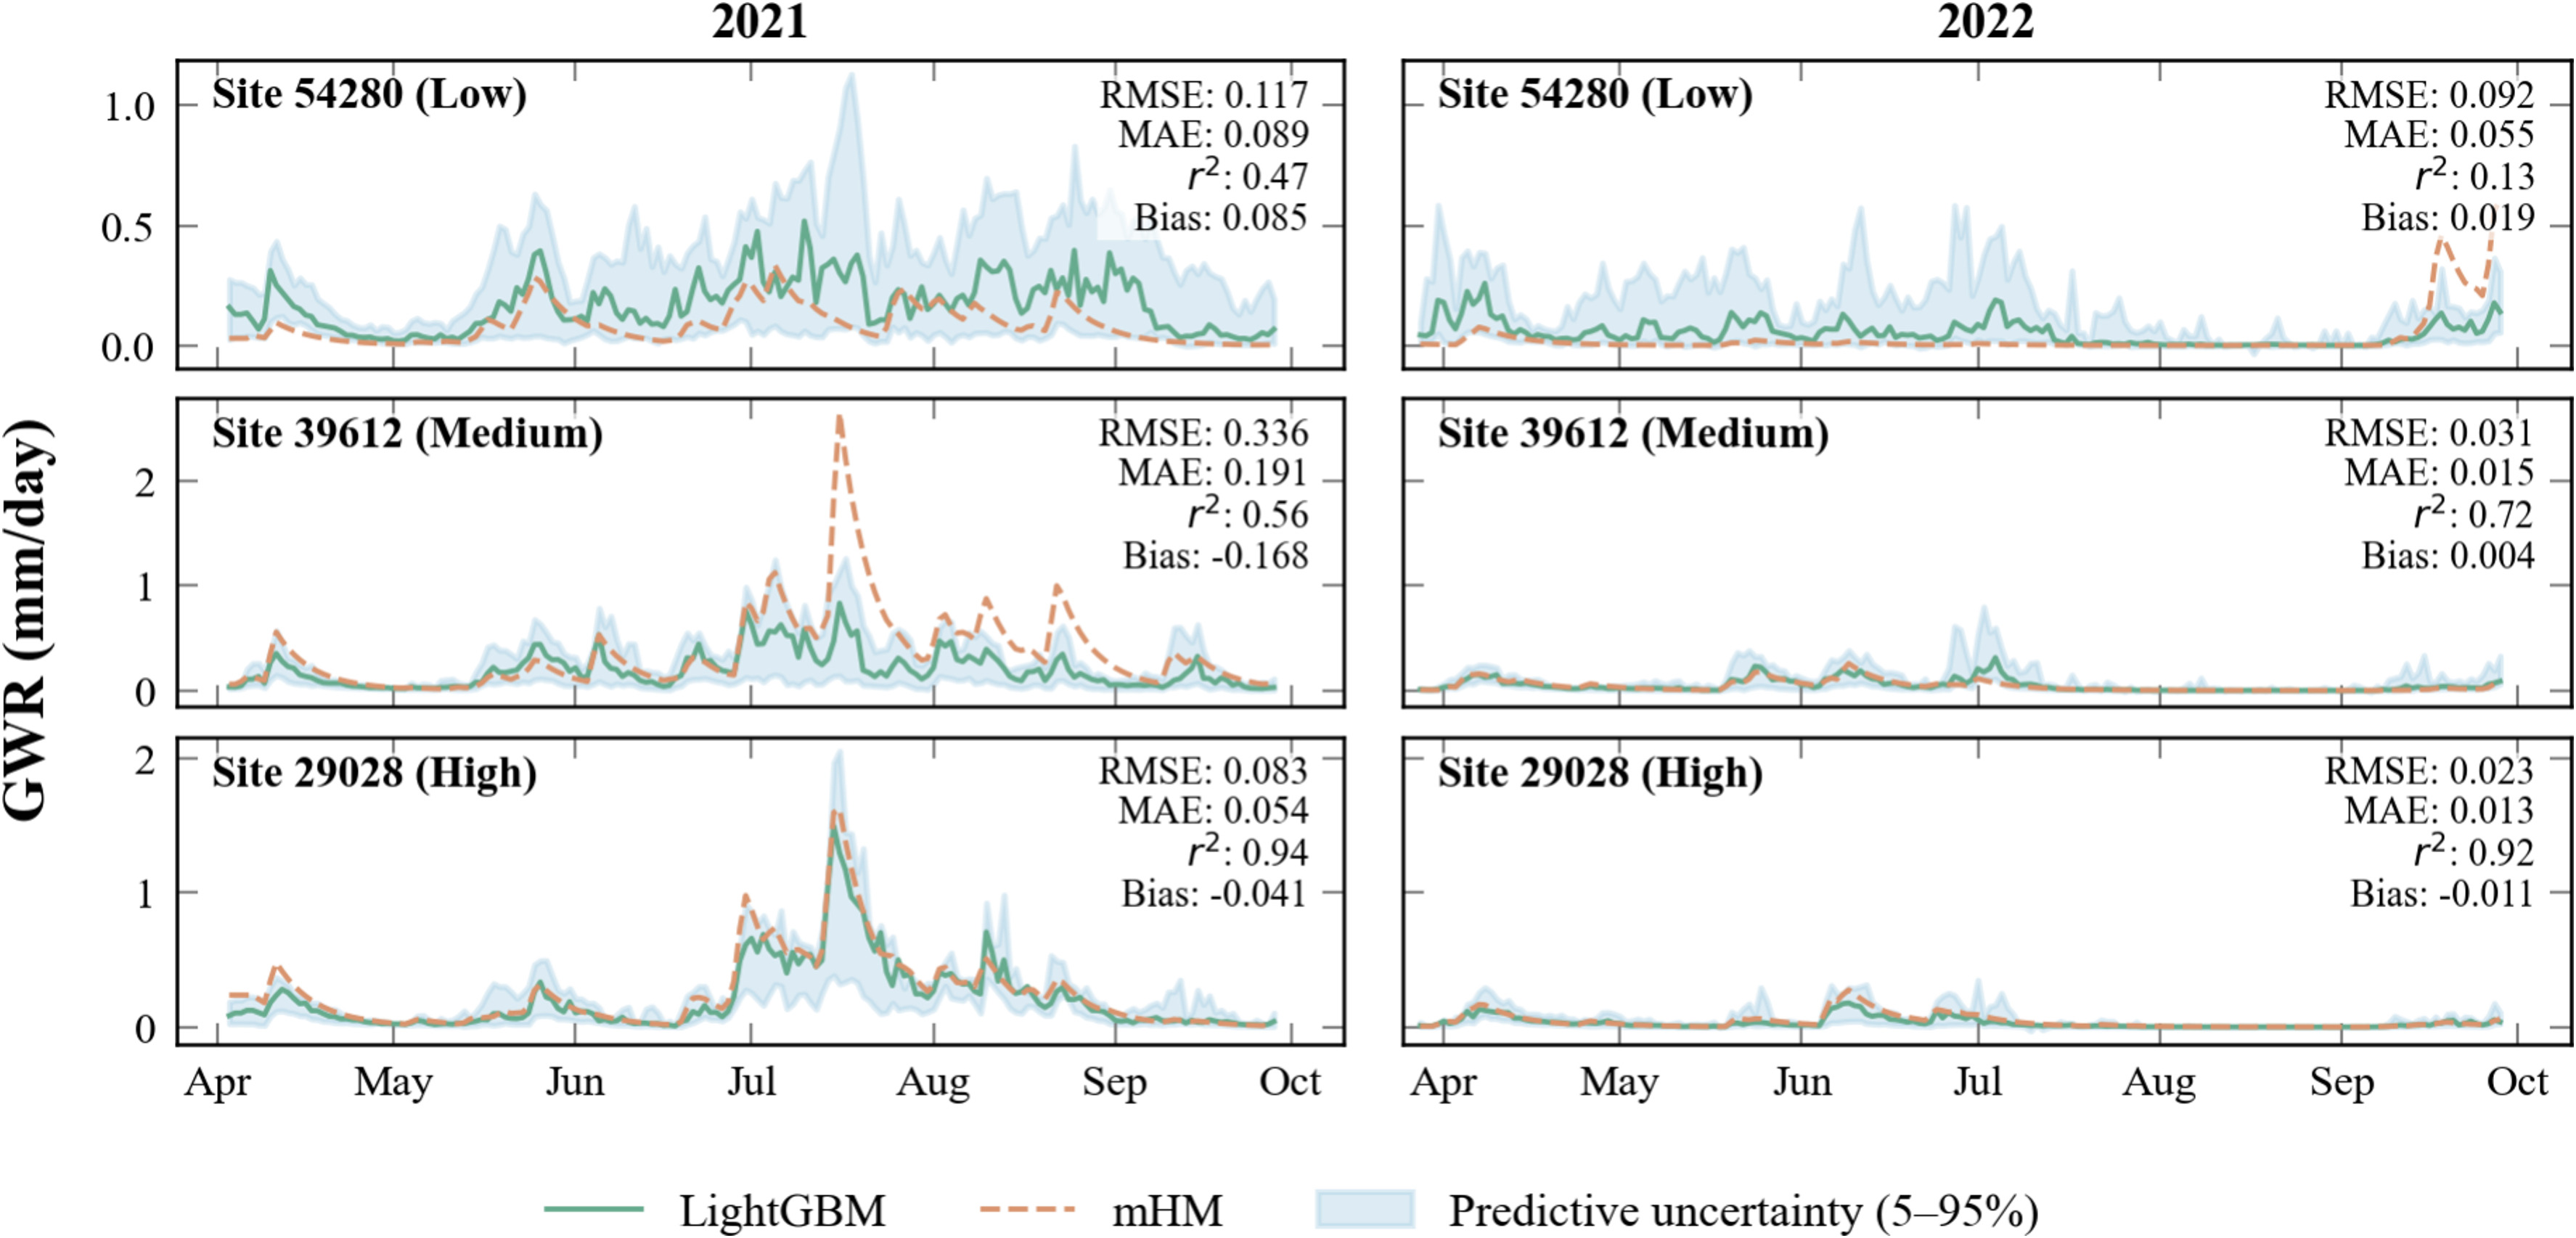
Using LightGBM (a fast, tree-based algorithm, chosen after testing a handful of competitors), they could indeed emulate mHM’s estimates of groundwater recharge, evapotranspiration and degree of saturation reasonably well at most sites, capturing the difference between the miserably wet year of 2021 and the properly dry year of 2022, catching the seasonal rhythm, keeping bias low. Not perfect, and definitely not a replacement for the real model (the paper is quite upfront about that), but good enough to be genuinely useful as a diagnostic and extrapolation tool.
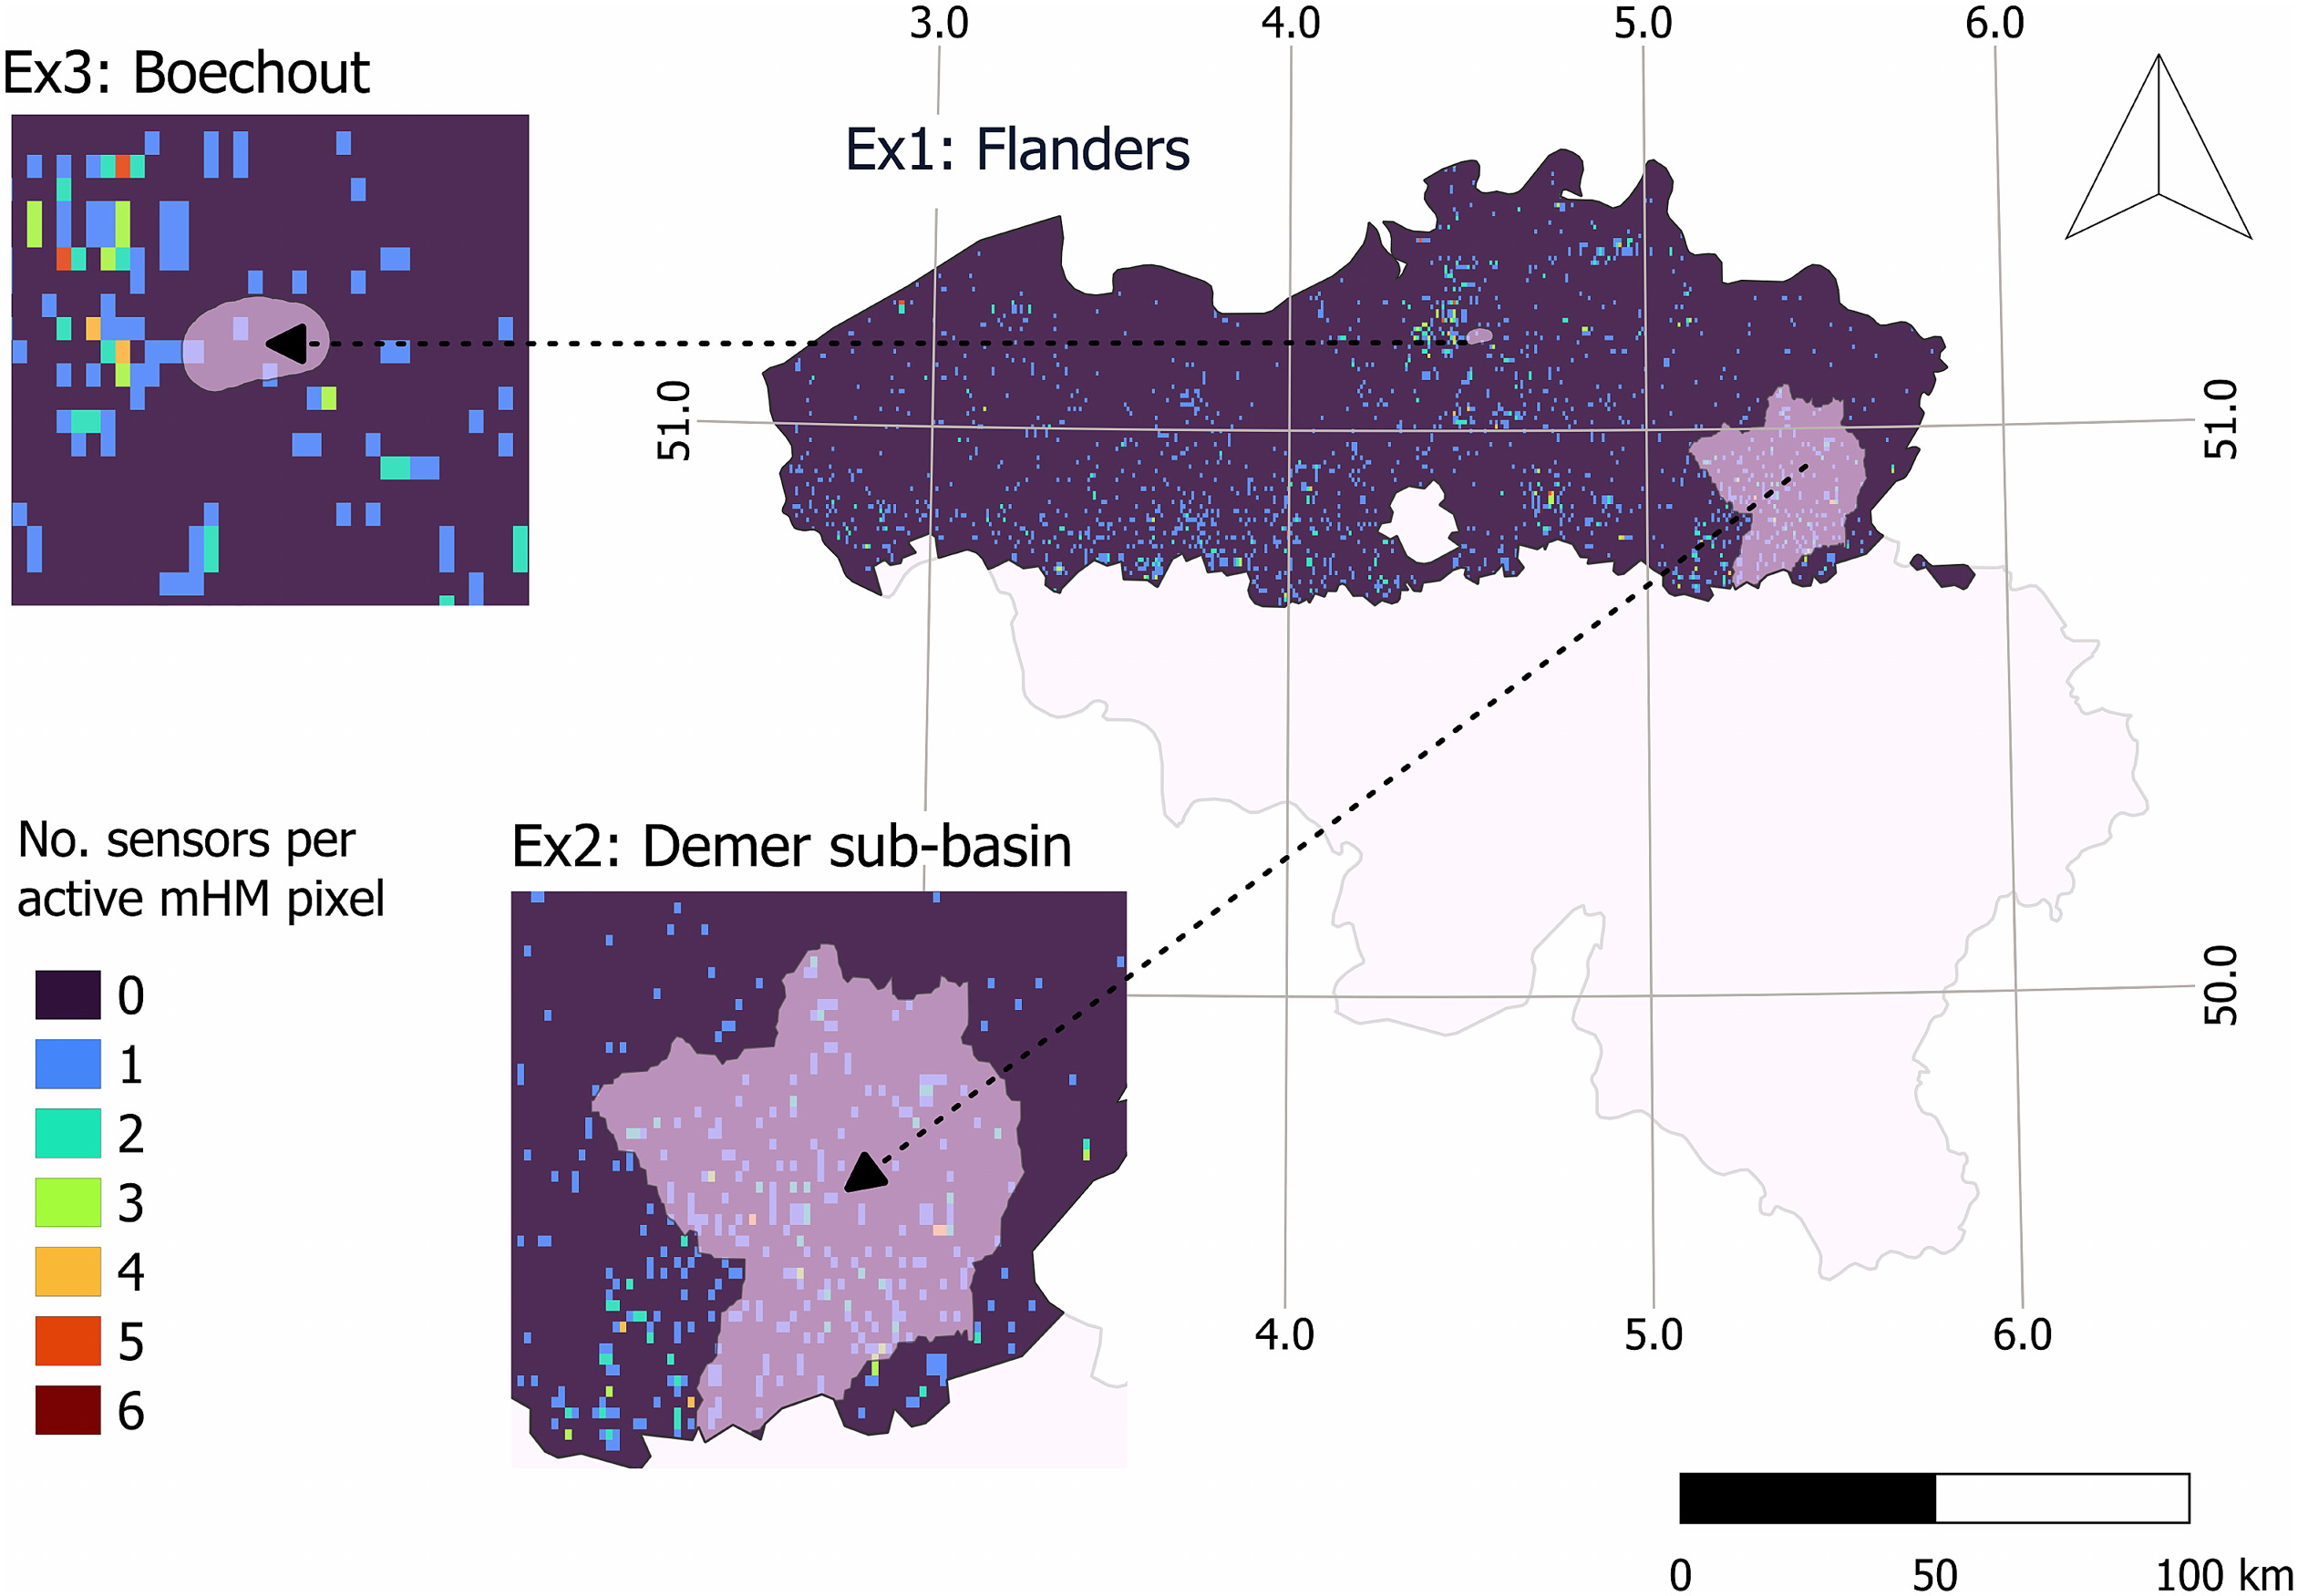
The part I find most interesting, though, is the following: on their own, individual sensors are a weak signal for this kind of hydrology – a single logger in one garden tells you a bit about that garden, yet very little about regional groundwater dynamics. Not a surprise there, as we knew the soil moisture signal was messy and hard to trust. But once you start aggregating across many sensors, the picture sharpens considerably: the density experiment in the paper shows that as more sensors get pooled together, the bias in the estimate stabilizes and the noise from single quirky locations melts away. It is, in the most literal sense, a case of the network being worth more than the sum of its parts. That’s reassuring to see in print, as that was the point I had been making about these sensors all along!
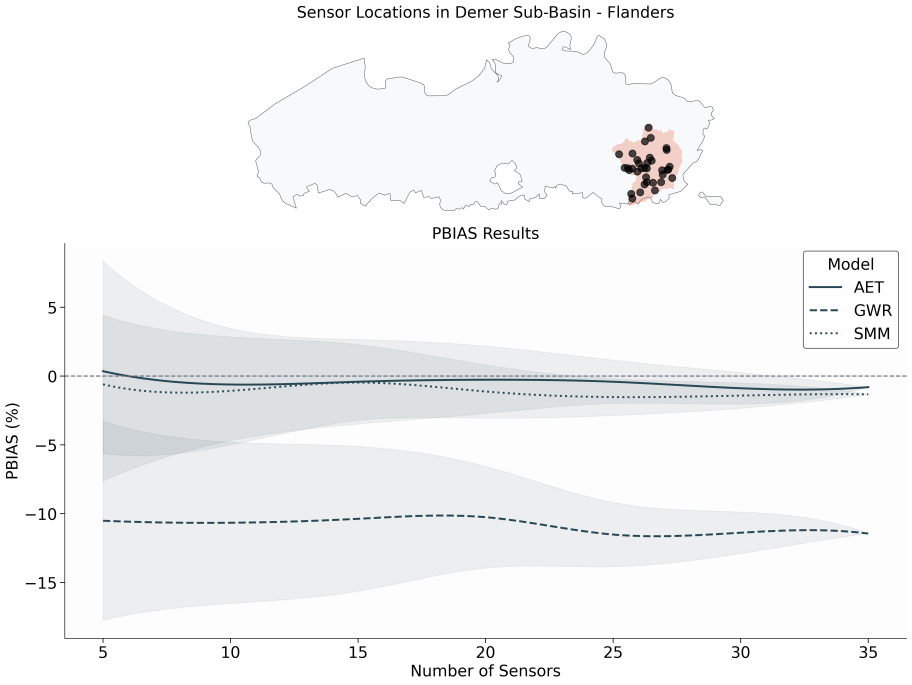
There’s a nice practical postscript too: when the model, trained purely on 2021–2022 Flanders data, was applied to an entirely independent site near Boechout (Flanders) the following year, its recharge estimates tracked the ups and downs of actually measured groundwater levels pretty well. That’s the kind of transferability test that is very welcome to see.
Why this matters (to me)
For me personally (selfishly), this paper did two important things. First, it took our soil moisture data out of the drawer we had secretly already put it in (“nice to have, hard to use”) and showed it has real value beyond microclimate ecology – groundwater managers, drought forecasters and agricultural planners could plausibly use dense, low-cost (citizen-science) microclimate networks like this one as a genuine complement to expensive physical models, especially in places where running a full hydrological model isn’t feasible.
Second, it was just refreshing to watch hydrologists do to our data exactly what we do with vegetation or temperature data: squeeze out patterns we hadn’t thought to look for. Another example of where microclimate measurements can inform other disciplines, as we have showed before for many other applications.
There is plenty left to do, of course, and the paper has a whole lists of suggestions: we had no winter data (when most European recharge actually happens), no proper soil calibration (remains a bottleneck for the TOMST sensor soil moisture data), no guarantee the same approach transfers to a different climate or a different model. But as a first demonstration that “yes, there’s real hydrological signal buried in a network of €100 loggers, if you have enough of them and someone willing to dig it out” – I’ll take it!


