
Each year, we have a few days in which the data flows in like a tidal wave.
We go to Norway, to our long-term observation gradients along mountain roads to check out on the temperature sensors we have out there. For the fourth year in a row, we can now add a whole lot of microclimatic data to our growing database, with very limited field effort required.
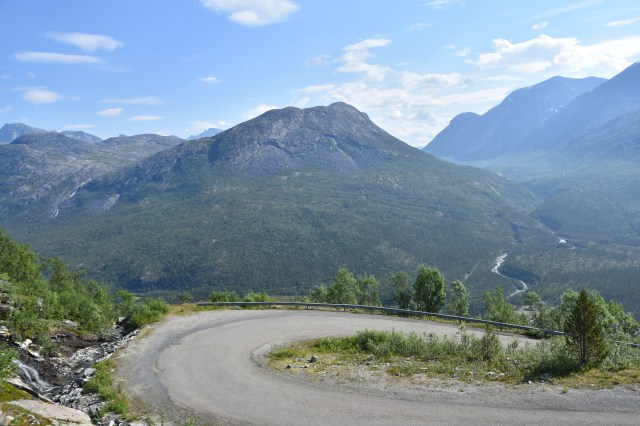
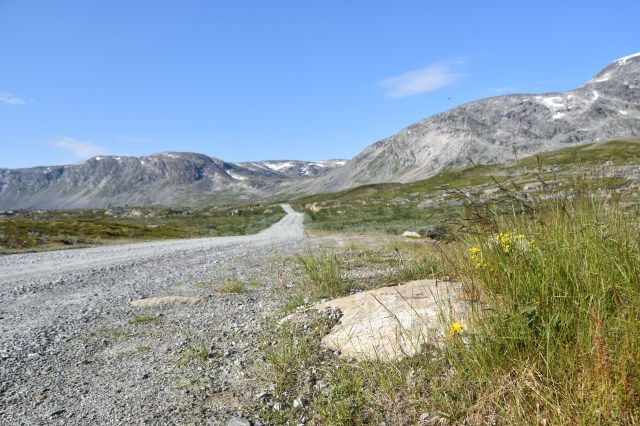
One of our mountain roads, within the longterm observational network of MIREN, the Mountain Invasion Research Network
This steady long-term data flow provides great opportunities for add-on projects. We look at leaf traits, root traits, soil conditions, mycorrhizae, bacterial membrane lipids… A whole variety of questions that all build on that beautiful backdrop that is our temperature data.
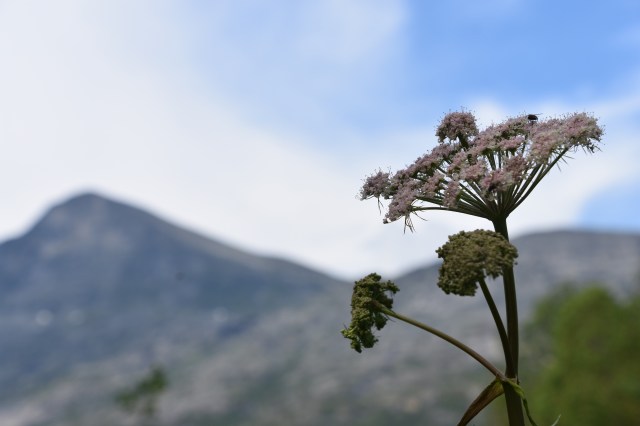
Studying plant species and everything related to them along Norwegian mountain roads
All of that brings a great set of data home, and next months will involve a lot of lab- and computerwork to get all of it figured out. Yet with every extra year in this field campaign, we start to know the system a little bit more, and we can put more and more pieces together.
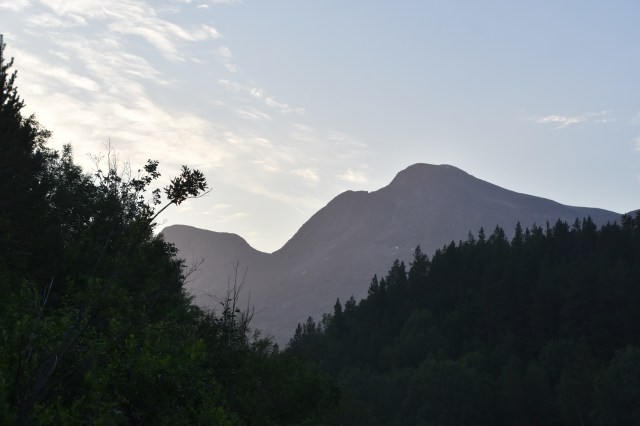
Close to midnight in northern Norway
And that is what makes this little trip to Norway feel so great: every year, you feel you understand it more and better. Every year, more questions have been answered.

More questions will be raised as well – of course – but that is for ‘future me’ to deal with in next year’s field campaign.


")


")
")


")


")


")


")


")


