
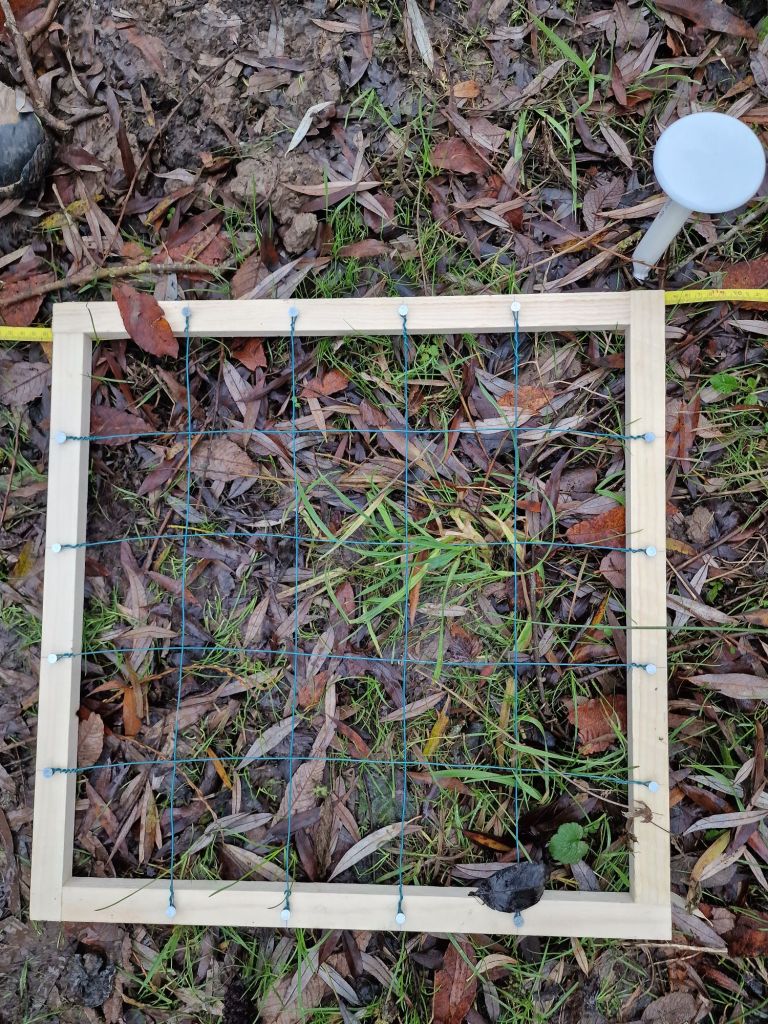
It’s fieldwork time again! We have started to enjoy some cold, grey and dark days in the Dutch mud the last weeks, for our new project on the scale at which biodiversity varies (more on that here).
Fieldwork in December, you might ask? Isn’t that by far the worst period to look at plant biodiversity? Oh, I can tell you, it is! The Dutch vegetation is looking pretty drabby at the moment – few hooray-moments about Dutch biodiversity, I must tell – and it’s also lacking quite a lot of its distinct features that facilitate identification.
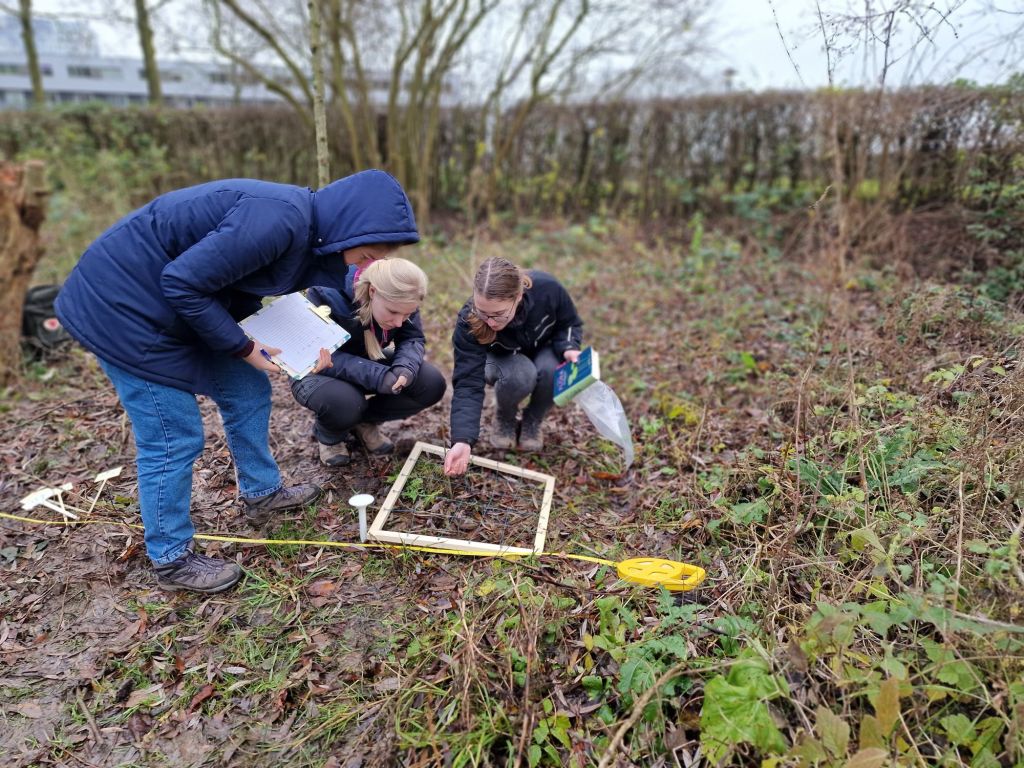
There are, however, two good reasons to go out into the field now. The first one is a very pragmatic one – I have a bunch of student interns for a short period of time that should do some fieldwork for their project.
The second one is a scientific one, though: we are interested not only in the spatial scale at which biodiversity varies, but also in the temporal scale: how much variation do you see in the same plot throughout the year and between years? How often should you monitor a plot to actually find all the species? What’s the period of highest diversity in a plot?
Important questions with strong implications for the way we are tracking biodiversity changes, so you should be grateful for us braving the Dutch mud to find out!


")


")
")


")


")


")


")


")


