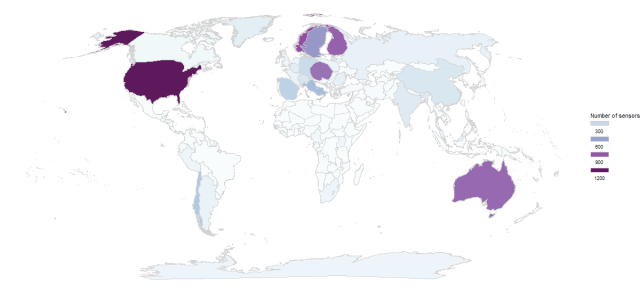
Cartogram showing the number of sensors in the SoilTemp-database. Countries colored and inflated based on the number of sensors.
We reached a milestone today: our SoilTemp database now hosts more than 10.000 sensors[1]! To celebrate this achievement – and the great news that our call for data in Global Change Biology is now published in its final format – I wanted to use our previous research to convince you why it is important to bother with this humongous task to compile a multi-thousand sensor database[2].

Figure 2: In our seed-addition experiment on north- versus south-facing mountain slopes, invader biomass increased significantly in warmer plots (expressed as Growing Degree Days, the sum of daily mean temperatures from days above 0 °C). Data from Lembrechts et al. 2017.
It all started during my PhD-work on high-latitude invasions in the northern Scandes and the southernmost tip of the Andes. We quickly realized that performance of our studied non-native plants related significantly to the local soil temperature – more than to the macroclimate gradient (Fig. 2).
It is during these experiments that we realized the issue at hand: this soil climate we measured seemed critical for studies on organisms living close to – or in – the soil, yet we lacked good high-resolution gridded maps to scale up our measurements.
Further prodding in the cold and snow-rich mountain range of the northern Scandes, confirmed our hypothesis: modelling the distribution of small plants works significantly better using soil than air temperature (Fig. 3).

Figure 3: summary of the results from Lembrechts et al. (2019).
We knew the importance of microclimate for ecology was gaining interest everywhere, however, and reviewed the great studies showing that microclimate can improve species distribution models. This review however emphasized the gap: we didn’t have high resolution microclimate data over a large spatial extent (Fig. 4)!
That is when plans started to materialize, and we set to work to fill that gap in our available data: the idea for SoilTemp was born. We started gathering the brightest minds in microclimate research, and brought together all their painstakingly collected regional microclimate datasets.

Figure 4: Workflow describing how in-situ microclimate measurements (as in the SoilTemp-database) can help calibrate and validate existing mechanistic models of present and future microclimate. Figure from Lembrechts and Lenoir (2020).
In the meantime, the potential for mechanistic microclimate modelling increased rapidly, a.o. thanks to the work from Ilya Maclean and Mike Kearney (Fig. 4). This created even more need for a global database, which would allow for large-scale calibration and validation of these models. Importantly, our ongoing efforts to build such a database are just the first steps: we’ll need long-term microclimate time series, and match them up with time series of biodiversity change and known physiological relationships (see Lembrechts, 2020).
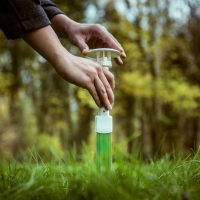
 Even more importantly: we need to predict future microclimate, and how it is shaped by the interaction with changes in land use and biodiversity itself (see figure on the right). This is fundamental to allow accurate predictions of the fate of biodiversity in the future.
Now look again at the cartogram above. There is some crucial work to do to improve the global coverage[3], but we are working on it. We have been shipping loggers to many of the empty holes in the map, and countless enthusiastic researchers from all over the world keep reaching out to us with more data.
We will keep doing this, and invite you all to stay tuned and, even better, join this quest for better climate data for use in ecology! Next up: usable global soil climate products so our ecological models can finally get the true microclimate data they deserve.

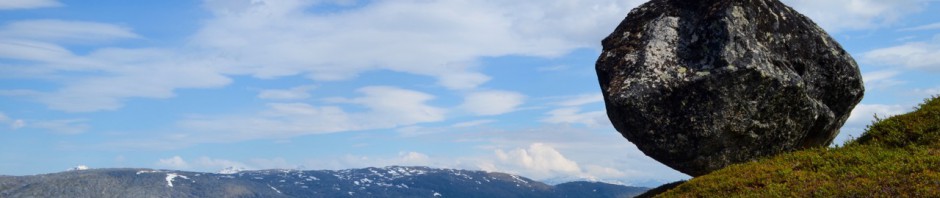
Microclimate logger in the Swedish mountains. Picture: Jan Clavel
Footnotes
[1] And many more still await processing in the coming weeks!
[2] Thanks Jonathan Lenoir for promoting these fascinating maps!
[3] And I truly believe filling this gaps is critical, both to get broad representation of all the Earth’s biomes, but also of a broad range of scientists from across all continents


")


")
")


")


")


")


")


")


