
Graphs often hide a lot of intriguing information, yet it is not always easy to get to what really matters. In ‘behind the graph’, I put in the effort to explain one of the main findings of our research and get to the stunning truth hidden in those simple lines.
This truth has been known for years: the higher you get into the mountains, the less non-native plant species you will find. They are common in the lowlands, gradually disappear towards higher elevations and are completely absent at the top.

Non-native plant species diversity virtually always decreases with increasing elevation in mountains.
That was hence exactly the pattern we expected to find when we decided to put these observations to the test in mountains close to the north- and southpole. A nice declining curve: the higher we got, the colder it would be and the lower our study plants’ success.

Putting the observations to the test with a seeding experiment in the mountains in northern Sweden (here) and southern Chile.
You will have to imagine the surprised looks on our faces when what we found was something completely different from theory. You’ll have to check for yourself on the graph:

Probability of invader establishment as a function of elevation in subantarctic Chile in disturbed (red) and undisturbed (black) plots.
Quadratic! The pattern we discovered turned out to be quadratic! Fascinating, isn’t it?
This means that the invaders actually perform worse at the elevation where they are most likely to be found in highest numbers at the moment. Their chances of success only rise to a maximum around the tree line (which is close to the highest elevation where they are currently found).
This quadratic function means that there is not one, but actually two different processes limiting invader success along the gradient; one at the top and one at the bottom of the mountain.

The higher you get, the colder it becomes. A day in the beginning of september at a 1000 meters in the Swedish mountains.
The one at the top is the easy one: the higher you get, the colder it becomes and the lower the chances for the non-natives to survive (who are not used to such cold from their home range in Western Europe).

Fresh snow on a plot close to the tree line in subantarctic Chile
The limiting factor in the valley is more intriguing, though. To understand what happens there, we need to take a look at our little graph again. As you can see, we have lines in two colours, a black and a red one. The black line displays the results from seeding non-native species in intact, undisturbed vegetation. Surprisingly, virtually none of them managed to germinate, nowhere along the elevation gradient. This implies that the vegetation in these cold mountains is highly resistant to invasion, at least when left alone and undisturbed.

The dwarf shrubs, grasses and sedges of the subarctic vegetation are not welcoming to intruders, at least not when left alone.
Our red line, which nicely shows the quadratic relationship, is for seeds sown in disturbed plots, where we removed the native vegetation as happens in roadsides, along trails or with construction works. The positive effect of this disturbance on the non-native species is astonishing: create a gap in the native vegetation and the resistance to invasion drops dramatically.
That is, it drops most dramatically at intermediate elevations, where temperatures are not too cold yet, but the native vegetation also fails at regrowing again. At low elevations, where we saw the unexpected drop in performance, the native vegetation manages to regrow fast enough to limit the success of the invaders.
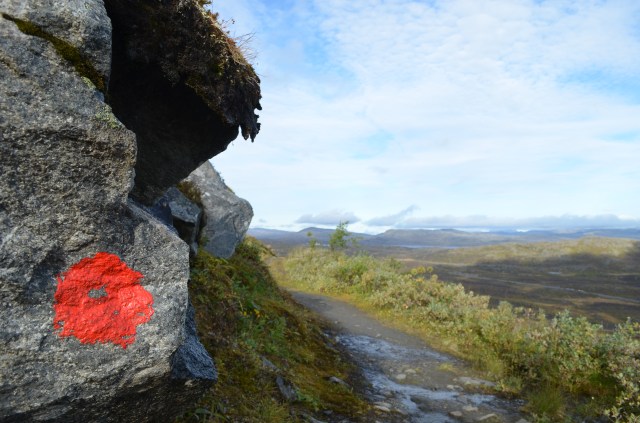
Disturbance events like mountain trails are a blessing for non-native species coming in.
So why is there this big differences in the expected and observed trend? The key lies in the amount of seeds that come in: at the moment, there are many many more seeds of non-native species at low elevations, which trumps the fact that they have lower chance of success. Yet that information predicts a grim future: if more seeds make it to higher elevations, and we keep messing around with disturbance of the natural vegetation like we currently do, plant invasions will rapidly increase in the very near future.
All of that in one little graph!

Trifolium pratense, a non-native species in the high north
Source: Lembrechts et al. (2016) Disturbance is the key to plant invasions in cold environments. PNAS.


")


")
")


")


")


")


")


")


Thanks for this interesting insight! 🙂
It seems you have a wonderful job!
You bet! 😀