An add-on to the global EcoFracNet monitoring protocol
Call to action: Monitor plant biodiversity and microclimate using a standardized design across scales from 0,5 m to 900 m to help us assess the scales at which biodiversity varies, and at which scale it matters for ecosystem functioning.
Main contact person:
Jonas Lembrechts,
Utrecht University, the Netherlands.
j.j.lembrechts@uu.nl
Join the network by filling out the 30 second sign-up form here!
The Ecological Fractal Network (EcoFracNet) explores how ecological patterns and processes scale across space and time using a standardized fractal design with nested plots. While the original design spans plot distances from 100 to 900 m, many landscapes – especially fragmented ones in multifunctional landscapes – demand a closer look. Small-scale ecological complexity is equally critical in topographically diverse regions like mountains or Arctic tundra, where fine features such as hummocks and hollows shape biodiversity (Fig. 1).
To address these needs, we developed the MicroFracNet add-on, which enhances EcoFracNet by zooming in on fine-scale heterogeneity. By adding plots at 11 and 33 m within the original 100-meter units, MicroFracNet captures trends often overlooked at larger scales (Fig. 2). This approach incorporates the observations made in the EcoFracNet about the complexity of many landscapes, and expands the focus beyond large natural patches to fragmented habitats and unconventional havens for biodiversity, such as gardens, schoolyards, urban spaces, and farmland—ensuring no biodiversity is left behind.
Each plot remains a 1×1 m vegetation survey area, subdivided into four quadrants for detailed data collection. Wherever possible, link biodiversity patterns to microclimate variability by installing sensors (e.g., TOMST TMS4, Fig. 3) in key plots (see ‘microclimate protocol’ on the EcoFracNet-website). This high-resolution monitoring can further be integrated seamlessly with other EcoFracNet protocols like the bird and butterfly surveys already on the website. We also aim to incorporate additional measures such as decomposition (tea bags) and soil nutrient analysis, for which protocols will be added to the website later.


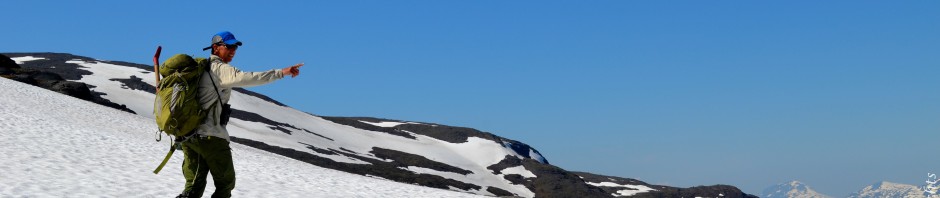
Figure 1: The scale of heterogeneity in a landscape varies widely and plays a crucial role in shaping ecological patterns and processes. In topographically complex regions like northern Norway (left), fine-scale features such as slopes, ridges, and valleys influence biodiversity. In agricultural landscapes (center), monocultures dominate, often creating large-scale homogeneity with little structural variation, as seen here on a misty morning in the Netherlands. In such landscapes, however, fine-scale fragmented patches of nature might still play crucial roles. In contrast, urban environments (right), exemplified here by Maastricht, Netherlands, exhibit extreme small-scale variability due to the diverse land uses and structural complexity of the built environment.
We are already piloting MicroFracNet at multiple sites across the Netherlands, developing a high-resolution case study to explore local biodiversity and ecosystem dynamics. We now however welcome both Dutch as well as international collaborators to join, as expanding the network globally will enable cross-regional comparisons of heterogeneity and enhance our understanding of how ecological patterns scale across diverse landscapes.
You can find a detailed version of the plot design here. For further guidance on setting up your study sites, identifying plot locations using GIS, conducting vegetation and microclimate monitoring, data sheets for data submission and exploring potential add-ons, refer to the original EcoFracNet protocols (Ecological Fractal Network – Protocol).
Join the network by filling out the 30 second sign-up form here!
By joining the network you will:
- Have the opportunity to be part of at least one joint paper on the spatial scale of heterogeneity and its implications for biodiversity (Fig. 4).
- Join an international community using a shared data standard to understand spatial scaling.
- Automatically have your data be eligible for inclusion in the wider EcoFracNet database.

Figure 2: MicroFracNet study design. The study design builds on the standard EcoFracNet framework by incorporating additional plots within the core bottom triangle (open circles), spaced at distances of 33 and 11 m from each other. Each plot consists of a 1×1 m vegetation survey area, consistent with the standard EcoFracNet methodology, and is further divided into four quadrants for detailed analysis (see inset, bottom right). Plots in red should – as much as possible – be prioritized. However, in areas of 500 x 500 m or less, one could also limit themselves to the bottom triangle only. Note that the orientation of the triangle can be adapted to local conditions.

Figure 3: if possible, augment the plant biodiversity monitoring with microclimate sensors (here a TOMST TMS4), to help us quantify heterogeneity in environmental conditions that underlie heterogeneity in biodiversity.

Figure 4: Preliminary findings reveal high community dissimilarity even at the smallest spatial scales within a 0.4 ha nature reserve at Utrecht Science Park, the Netherlands. The red line highlights the increased dissimilarity driven by fine-scale variation in management practices, specifically differences in mowing regimes.


")


")
")


")


")

")


")


")


